Friday, May 2, 2014

SQQQ Follow Up

As mentioned earlier, there were a number of assets I had looked in to from GLD which I'm virtually certain is coming down to inverse ETFs (even though earnings season is close to over) and numerous companies.

The Q's, near term have looked to be in the worst shape to me and for initial momentum with leverage, SQQQ looked pretty darn good vs. confirmationary signals in QQQ. 3C is interesting in that even though SQQQ is suppose to (and generally does) move exactly the same as the QQQ, except inversely and 3x leveraged), the difference in volume and size of trades can give you very different signals, I saw that earlier this week and declined to enter trades because I wasn't seeing confirmationary signals in GDX vs. NUGT vs. DUST except in one important place, the 10 and 15 min charts which all suggested GDX and NUGT which were at the high end of the range that day, would move below the range and it was just a day and a half later that this happened and these were the only 2 charts (10 and 15 min) that had confirmation between the 3 linked assets.

So I'm going to show you SQQQ (UltraPro 3x Short QQQ) next to the same timeframe is QQQ, there are some minor variations, but it's the underlying trend that I'm interested in, not small differences in noise.
 SQQQ 2 min. with a rounding bottom and an increased ROC on the 3C leading positive divegrence as we go in to today.

Interestingly the QQQ 2 min looks a bit different but was picking up on the same increased ROC in 3C intraday signals with the mirror opposite leading negative divegrence (confirmation).

 SQQQ 3 min, like VXX, I wonder if this is two distinct bases of one large double bottom? I suspect it is one large base because of the nature of the divegrence and how it is even stronger at the second potential bottom as is the case with "W" or double bottom patterns.

VXX is very similar as are many other assets.

QQQ 3 min could generate the same question as distribution sent it lower around the 24t through the 28th.

We also have a stronger divergence, much stronger at the second top like SQQQ's second bottom.

SQQQ 5 min leading positive

QQQ 5 min leading negative and this is also around the same double bottom/top area.

SQQQ 10 min

QQQ 10 min

SQQQ 15 min

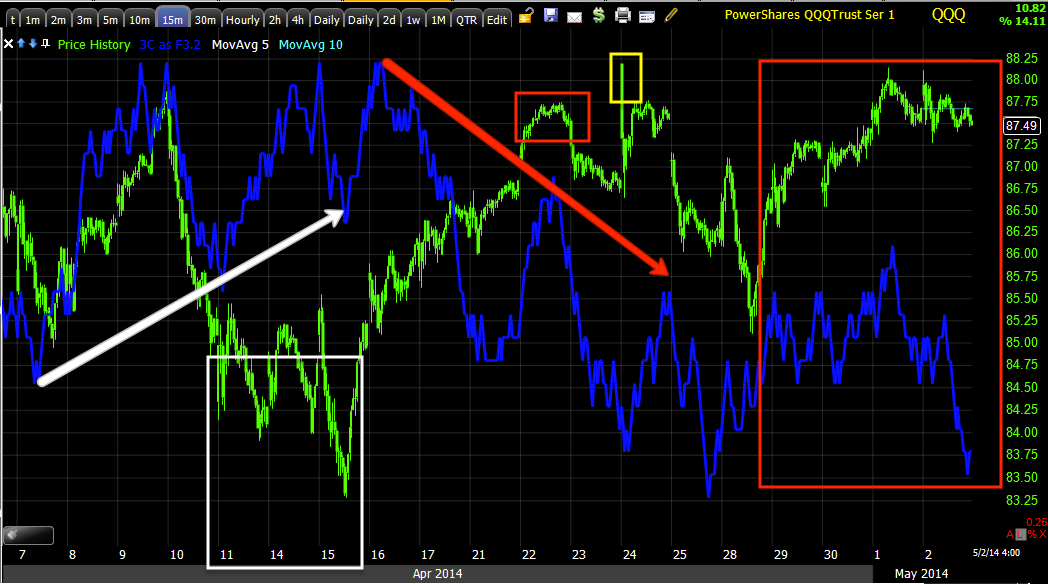
QQQ 15 min and below a longer look at the QQQ 15 min

Remember the 11th when we not only posted at the lows we'd see an upside move, but pretty much hit the target on the nose thus far before we saw the first day of price movement higher.

However, the deterioration in the Q's on this important timeframe is the real issue. Having the short term fast charts in line with these longer ones is what I call a full house and generally means a move is right around the corner.

SQQQ 30 min and watch the chart from left to right, from confirmation to leading positive divegrences and the possible double base.

Now look at the QQQ with the same confirmation to the left, the same deep divergence except distribution and possible two bases.

I also compared QLD and QID to SQQQ and QQQ for additional confirmation.

Trade Idea: Adding Trading Position SQQQ Long

The Q's look the worse to me near term, I think there are more than sufficient signals in SQQQ (3x short the QQQ) to justify an entry here.


Looked at a LOT of Potential Trades

There are a lot of potential trades, for instance, GLD should come down, however as close as some of the charts on trades like this or inverse ETFs of the averages are to being choice, they are missing a few charts here and there, the only thing I can think of is that they need a day or so, as in a Monday entry.

In many cases I'd have already entered a lot of these, but in this environment, as much as I want to get set up and make some money, I continue to remind myself, "It's easier to keep it than make it back", so I'm requiring a very high standard for new trades.

I'm going in to the weekend holding positions that were opened for a near term move down including FAZ long, VXX May 17th calls, FXI long, TBT long, SPXU long (that's been in the trading portfolio-down about 5%) and I'm looking forward to adding as you saw the averages, the Index Futures, VXX and Leading Indicators.

I guess, Patience is sometimes the hardest thing, but it's generally been the most rewarding.

Leading Indicators

There are some very interesting indications here, for one it looks like they're going to try an EOD ramp using HYG and VXX, TLT likely will not cooperate, but that's 2 of 3 of the SPY Arbitrage lever (short term or intraday market manipulation) and the bigger message is just as I suspected with the market averages, Index Futures and VXX.

 This is HYG, the lever as I posted earlier this week is broken and you can see that clearly in price, High Yield Credit tends to lead the market and this chart is suggesting it will be leading the market lower shortly.

As far as EOD manipulation, this is VXX with the SPX's price inverted so you can see the correlation which was near perfect until just recently as VXX is underperforming which is what you see when they try to activate intraday manipulation using the SPY Arbitrage, but they need HYG as well.

This is HYG on an intraday basis and SPX scaled normally, there's some out-performance there, so it looks like they'll try to ramp the close, but the HYG chart above is a much stronger signal or indication, this is just EOD intraday stuff.

 TLT needs to move down to help the SPY Arbitrage, not sure that will happen, but this chart of TLT with its correlation to the SPX which has price inverted to show what the normal correlation should be, shows a clear flight to safety in Treasuries.

 And on the sentiment side of things (professional, not Stocktwits), they are clearly getting out of town, expecting something ugly coming which is right in line with our charts.


Quick VXX Update / Trade Reiteration

I am going to put this out there once more as a long trade position, whether VXX or the 2x leveraged UVXY. As for a call position, I would have preferred enter that on the move below support today, the same one I suspect was our head fake move (used for timing ) and was saying yesterday that this was the only thing missing from the reversal process in VXX / UVXY.

Again, I like either as long positions, I'd prefer UVXY for the 2x leverage, but that's a very personal choice as far as risk tolerance goes.

Here are 5 charts of VXX, in nearly every one look at how much it has added just today alone and these are the "Flying " divergences only seen in VIX related assets that I spent almost 2 months waiting for.

 1 min which is actually stronger than it looks here, I just wanted to show the area I suspect was out head fake move this morning as well as how much it added today alone on such a move.

This is a PERFECT example of the "Flying divergences" that we only see here and on a 5 min chart as well

This is how much VXX added to a 5 min chart today alone in leading divergence.

And here's the 10 min chart, I suspect both of these rounding bottoms are like 1 large "W" base as the second bottom almost always (90+% of the time) makes a lower low whereas technical analysis tells traders to look for a higher low, this is one of the many ways TA is used against traders and it makes a lot of sense from a Wall St. perspective.

Here's the 15 min chart and how much it added today alone as well as the rounding reversal process which I compare to an "Igloo with a Chimney", except in this case upside down. The head fake move is usually right at the very end , just before a reversal (to the upside in this case) and the averages don't argue with these charts nor do the Index futures as you saw yesterday stretching out to 60 min negative divergences.

Market Update

Considering what the VXX looks like (this is a VXX update from Wednesday April 29th) and the probable head fake move put in today, taken with these charts, I think the information that I gather the last two hours of Friday is pointing very clearly to a significant move to the downside in the market.

I said if I had a chance I'd put up some charts, here are some charts of the averages, I'm also looking at potential trades in several different assets, I like VXX or UVXY long a lot and there are several (actually many) others, but in most there's 1 nagging chart I'd like to see resolve.

In any case, if you look at the VXX signal trends and these, I think you'll agree, we are on the edge of a significant move down, not the noisy , volatile chop that has dominated for about 2 weeks now, but a real move that makes a lower low in an index like the NASDAQ 100 (I mention that one specifically because it had retraced the most (all of the Feb. rally).

 DIA 1 min

DIA 2 min

DIA 5 min

DIA 15 min, this is the killer that's screaming new lower low.

IWM 1 min intraday

IWM 2 min

IWM 3 min

QQQ 1 min

QQQ 2 min, that's a lot of movement even for these faster charts.

QQQ 3 min trend

QQQ 10 min

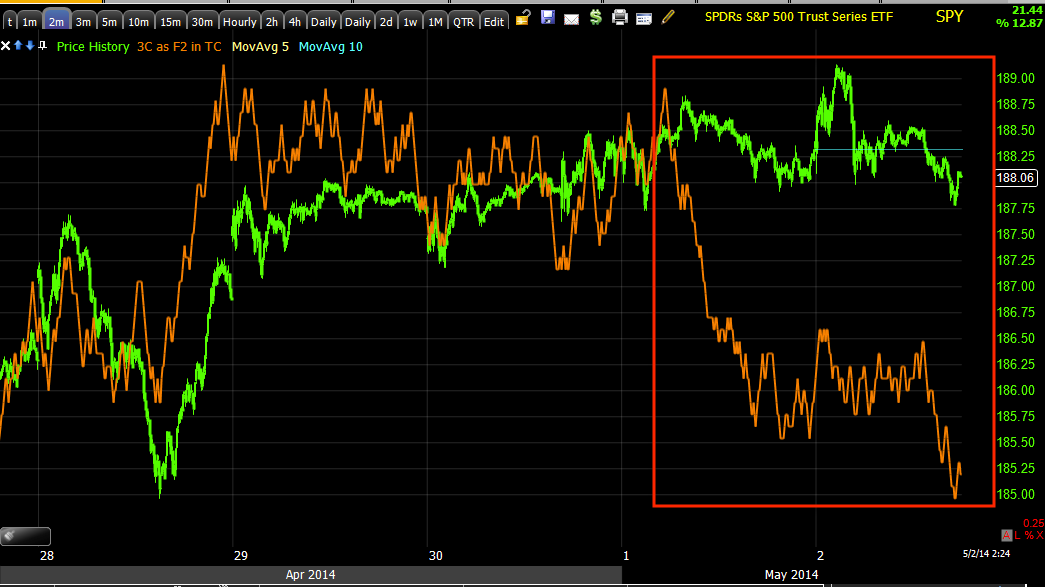
SPY 1 min. -you see what I mean, this looks like it's ready to fall off a cliff timing wise.

SPY 2 min, another great example.

SPY 5 min

I'll be adding more as it comes up, I'm really trying to decide whether positions here are appropriate or a day more...the op-ex doesn't help

FXI Trade Follow Up-

We have an open FXI equity long position so I'm following up on that as this may be a decent add to area. Calls in FXI which were opened on 4/25, Closed FXP trading position long, opened regular size FXI trading position long & FXI Calls were closed on 4/29 I Am Going to Take FXI May $34 Calls Off the Table as I saw signals for a pullback/gap fill and here's the follow up for that 53% gain this week FXI Follow Up.

 On a daily FXI chart the white arrow is where both a call position and an equity long were entered, at the red arrow the call position was closed for a +53% gain and the equity long was left in place as an open long trading position as I didn't expect a sever pullback, but enough to warrant closing the calls.

The real, longer term trade I like is FXP, UltraShort China 25 rather than FXI which is UltraLong China 25, here's why as I think FXP has some excellent upside.
 60 min FXP China 25 UltraShort leading positive. However, as we were long FXP some signals came across the charts and we switched trades on 4/25/2014... Closed FXP trading position long, opened regular size FXI trading position long & FXI Calls

This is the FXP 30 min chart going from in line to a negative divegrence and that's when we closed FXP and entered FXI long. I do intend on re-entering FXP as a longer trend trade, but it needs to finish its correction and set up our entry, until then, FXI looks pretty good.

 This is the FXI 15 min chart,  you can see the clear positive divegrence forming and on the 25th at FXI's lows and FXP's reaction highs, we flipped trades.

This leading positive 15 min chart should still have significant upside and as such I think this is a decent area to consider FXI long if you haven't before or as an add-to area for existing FXI longs. I do not like this area or set up for a new call position, I'd want to see a sharp move lower with strong accumulation to enter a call.


 The FXI 5 min chart shows the highs and no 3C confirmation which is why the call position was closed on the 29th...I Am Going to Take FXI May $34 Calls Off the Table again, for a 53+% gain for a few days.

The 1 min FXI looks like the pullback/consolidation is nearing its end as you can see a relative divergence transform in to a stronger leading positive.

 The 2 min chart also shows then on-confirmation at the 29th highs and the relative positive and leading positive since the pullback from the 29th's highs which basically filled a gap.

The 3 min chart shows the same thing so we have a trend that is migrating through the timeframes, remember FXI is not the prize, but it's the trade for the time being until FXP sets back up.
Again, FXI's 5 min chart shows the non confirmation of the highs of the 29th, and a steady positive divegrence on the pullback from those highs.

I'm not moving anything as I already have an FXI long equity position, but you may want to consider FXI for some diversification (China) and as a reminder, although I think there's a time and place for options and they may very well work fine here, this is not the kind of options trade set up that I prefer, it just doesn't have enough entry edge for me.

Quick Market Update

Remember this is a weekly op-ex Friday which means there's generally a pin (of the market) in place, this generally ends around 2 pm and price starts to move, however the 3C indications we get during the last 2 hours are some of the most valuable of the week and tell us a lot about what to expect over the course of the coming week.

Right now even though Index futures are perfectly in line intraday, the averages all have intraday negative divegrences and look like they'll be coming down.

In fact some are strong enough that I'm considering opening some trades, I'll try to get some charts up for you, I just don't want to miss a good trade set up capturing charts.

GDX / NUGT Update

I'll also try to get out a GLD update.

I think GDX / NUGT will be coming back down, probably sooner than later (I'm thinking likely today, but I DO NOT like DUST even as a counter trend quick play)...

This post, GDX / NUGT / DUST Update is from Wednesday April 30th, detailing near term expectations for GDX/NUGT which have already come to pass, although I think there's more to be done, but the entire trade set up in which GDX/NUGT COME TO US on our terms at a better entry point, lower risk and much better timing so we don't have open market risk or opportunity cost, can be found in the post linked above.

There's also the longer term GDX perspective in which this looks like one of the few strong (long) trending trade candidates, so a trade set up in GDX/NUGT isn't just for a bounce or a swing move, this is a pretty serious position.

The charts ... (I've used GDX, NUGT and DUST to confirm each other).
 This is the GDX daily chart and the range that has been so obvious (a technical price pattern called a rectangle). GDX spent about 6 days inside that range making it very obvious and a strong candidate for s stop run just below support which it seems we saw a little of in yellow, but I suspect before GDX is done with this area and moves on to a upside trade, it will likely create a bear trap and do some more work below support as it popped back inside the triangle today.


As far as GDX pulling back, this is the 1 min intraday leading negative.

 This is NUGT (the 3x long version of GDX) with a 1 min negative

And this is DUST (the 3x inverse GDX ETF) with a 1 min positive, that's confirmation in all 3 assets on the same timeframe.

This is the GDX 3 min chart , also with a negative intraday signal.

This is NUGT 3 min with a negative signal

And this is DUST showing distribution before its fall and a small relative positive, this is one of the reasons I DO NOT like DUSt as a counter trend quick trade, the objective data to support the trade is not there even if I do expect GDX/NUGT to come back down.

This is GDX 5 min and it's not confirming so it's in an intraday leading negative position.

The same 5 min chart seen through the range of GDX looks like this...
 It looks VERY much like GDX has been accumulated through this range and the small negatives seem to be creating the range and s ending GDX back to support where it is accumulated as a larger position (long) looks to be under construction. This fits well with the longer term charts which are where the highest trend probabilities are, in other words the longer term charts are telling us the probabilities of this area resolving to the upside are strong.

For example...
This 4 hour GDX chart shows a stage 1 base or the low of it, I'm not convinced that we are not still in the base area. There was a confirmed move higher and a small negative divegrence for a pullback creating something that looks like a bullish Cup and Handle price pattern (although technically not textbook). Within the pullback area we have a very strong leading positive divegrence which is the behavior of a base, not a stage 2 trend meaning the larger the base is, the larger the trend and the longer the can support the trend to the upside.

The "Price Implied Target" as of now is at least $42.


This is the NUGT 5 min chart with a relative negative divegrence, thus supporting the idea of GDX/NUGT pulling back from today's earlier move up.


This is DUST (the opposite of GDX/NUGT) 5 min chart, you can clearly see the negative divegrence for a move down here, but there's nothing more than an "in line" signal right now, thus I see no edge in trading DUST, despite the fact I think GDX will come down. Perhaps something develops later that is more interesting in DUST.

 This is GDX's 10 min chart and one of the main reasons the GDX / NUGT / DUST Update post was urging patience  as the negative divegrence here indicated to me a high probability of a move BELOW the rectangle trading range and a head fake set up in the area, which would give us an excellent entry once the 10 and 15 min charts that look like this are resolved to a positive divegrence.

This is NUGT's 10 min chart, there is minor improvement on it today, a higher 3C high would be definitive improvement and I think they need to pullback even if the intraday signals weren't there, to do that work.