Tuesday, February 7, 2012

DIS Misses on Revenue, something a little fishy

Disney (DIS) reported right after the bell, the beat on EPS and missed on revenues.  Interestingly (coincidentally?) the miss that has DIS trading down 1.81% in after hours, erasing all of today's gains, just so happen to occur on the very same day that DIS broke out to end the primary downtrend, an enticing breakout to buy.


If you are familiar with the dogma of technical analysis, a breakout is something that is coveted and to be bought, a breakout that ends a primary downtrend even more so.

Here's DIS today breaking the Primary Downtrend with a breakout above the July closing highs on about a 1/3 increase in average 200 day volume.

 As you can see on this chart of the last 2.5 days, volume surged on the breakout, leaving buyers at a loss right now. Coincidence or just a well planned head fake move?

 The daily 3C chart shows DIS moving up in confirmation of the trend in 2010, then distribution takes place during a topping formation in the first half of 2011, DIS falls 34% from the top's highs, quite a fall for such a large cap that is not typically associated with beta.. From June 2011 through the October lows we see a strong 3C positive divergence and DIS gains 41% through today's close, but on a negative divergence at today's breakout.

 On an intermediate 15 min timeframe DIS sees a negative divergence sending it lower in to an accumulation zone for the move through resistance and an important breakout, yet there's no 3C support as DIS breaks out.

 A 10 min chart shows a little more detail of a negative 3C leading divergence in to the breakout

A 5 min chart shows a steep leading negative drop today, just around the time the breakout started.

I wouldn't think a company as big as DIS would have a leak in earnings and of course we can't ever know for sure, but a breakout with buyers stepping in that would have ended a primary downtrend with all the 3C charts above in agreement, something is definitely a little fishy.

AEO Follow Up

This was another trade idea (short) from Feb. 2 that we were just waiting for the set up

I think we are pretty close to where we want to be on this one.

 The last two days have broken below the pivot, although the highest probability trade is on a close below $13.70, I think it probably doesn't make too much difference as you have a little advantage here on placing a stop just above $14.50, an even tighter stop can be used with a close above $13.95 or so.

A break below the red trendline should send this one on the next leg lower and with a breakaway gap in place, this is a very bearish chart. My personal preference would be to treat this as a swing trade just until we see what the trend looks like on the downside and see what stops would work best in a trending situation, thus far we just have a nasty break, but no indication of what the down trend would look like.

Again, you can either wait for a break below the trend channel and have a higher probability trade (although I like the probabilities here) or enter around this area and have a tighter stop with less risk, or you can split the difference. Either way, that's a nasty break from the uptrend and a rare break away gap, very bearish looking

Trade Idea PPO (Short)

Use your advantage over Wall Street with this one, PATIENCE! Let the trade come to you. This is also a trade that I consider to be in a Primary downtrend, but I think it is best treated as a Swing Trade, I think if you do so, you'll get quite a few decent trades from this one.

 This is a really beautiful head fake move out of what appeared to be a bullish descending wedge, then they took EVERYONE to the cleaners in 1 day, every long who had bought, no matter where was at an instant huge loss in a single day, now they are enticing the longs again...

 Although if you look at the long term chart, it is not immediately clear, the 150 day moving average is what this trade is all about. If you look at the areas I have highlighted, that has been where breaks of support have gapped down hard, there has been resistance and breakouts have failed, it's also where they took all the longs to the cleaners in a single day.

 So I would not get greedy and look for a few extra percentage points trying to jump in early, let this come to you, but you need to set an alert for when this breaks below $46.25 and be in the trade really quick, you never know if you'll get another massive day down and waiting for the close, you may miss it.

Here you can see this wasn't a random price pattern that looks like a head fake, they set this up way in advance with accumulation near the wedge's apex and then dumped it hard. Like I said, treat this as a swing trade, keep your stops on the tight side and this should offer you many opportunities as they bleed this one in a primary downtrend.

GALE/QCOR Pair Update

Gale was brought up on Feb 2. as a pair trade to a QCOR short. At the time GALE was at $.88.

Here's the QCOR Trade Idea...

The idea is to buy GALE long and short QCOR, they are both in the biotech sector, it's kind of a hedged trade.

GALE made up to 58% as of yesterday at the intraday highs and is at a profit on a pullback today of 24%.

I liked the idea of a phased entry in QCOR on the short and GALE long, of course GALE is much more speculative so the position size should be smaller and treated as a speculative trade.

 Here's GALE's daily chart, as mentioned earlier today, biotechs are pulling back, so if you didn't take the trade and maybe are interested, you may get a chance to buy GALE on a pullback, just remember that unlike QCOR, it is a speculative position.


 As you can see, the first pullback is usually to the 10-day m.a. in yellow, subsequent pullbacks tend to be deeper, probably between the 10 and blue 22 day, but possibly as deep as the 22 day, much beyond that and we need to re-evaluate the position.

 This is the stop I'd suggest, a 1 day Trend Channel which on a pullback with it still rising right now, would probably be in the $.80 area, but it rises more each day and tomorrow it will be even higher.

 The daily GALE 3C chart seems like it can support a bigger move in GALE, although how you chose to manage the trade (trade around pullbacks are just hold) is up to you and your risk tolerance. When market conditions change, that will also have an effect on long positions so stops may need to be tightened in that scenario.

 GALE is pretty much in line on the short term charts so I would expect the pullback /consolidation to continue, it has had a big move in a few days and those gains need to be digested and the weak hands need to be shaken out.

 This is the long term daily QCOR chart, there's an obvious problem here that can be seen in the changes in volatility, tops get very volatile. There's also an RSI divergence in place. The long term target for QCOR is around $20, but they often overshoot those targets so in the mid to high teens is realistic.

 We wanted to phase in to QCOR and add on strength and then add the last part of the position on confirmation, a break below the 150-day moving average would be pretty good confirmation to add the last portion, whether it be in 1/2 , 1/3 or 1/4 entries. Today looks like a decent day to add or start phasing in if you didn't already on yesterday's strength.

 The daily QCOR 3C chart also shows problems with QCOR, thus the basis of the long/short pair trade, although either trade can be taken independently.

Looking at QCOR's volatility and hoping to capture a trend to $20, I think a 2-day Trend Channel which is a bit wider is a better stop then a 1--day.


 If you have any questions of either, just shoot me an email.

USO Update

 USO daily has benefitted from a stronger Euro/weaker dollar on this morning's Greek news

 Intraday there's a consolidation with volume confirming, it however is a descending triangle rather then the continuation (bullish) ascending triangle.

 The 1 day Trend Channel has held fine, although as I have mentioned, I prefer the wider 2-day as a stop.

 The X-over screen saw 1 false crossover which was not confirmed (red box) and then a recent cross-over which is a short signal. More importantly, the first pullback is usually to the 10-day moving average in yellow, which is where we are today. I mention this because I have been asked about USO as a swing trade, we want to short in to strength and today provides that.


 Today's 3C action in USO would suggest this is a pullback and nothing much larger then that.

 The longer 60 minute chart which is why I have been bearish on USO has had no damage done to it and continues to trend lower.

On the swing screen, the red candle is the short swing trade, white candles are noise, the recent long legged Doji from Friday suggested a pullback , which we have seen. That same candle is also the pivot, so a stop out on the trade wouldn't come until at the very earliest tomorrow and only if it posted a low higher then Friday's high.

All in all, with the strength today and the larger trend, it doesn't look like a bad swing entry here. There's also SCO/DTO which could be bought for more leverage or options (Puts) could be used, I'd prefer a few months out for a swing trade so the time decay isn't as bad.

Ah, I found it

Published 4 minutes ago...


Greek leaders' meeting on new austerity measures postponed to Wednesday

Perhaps It was the Spiegel Opinion Piece?

Here it is and they are correct...

The unknowns and the political as well as financial backlash are setting in with a German and French populace that are soon to be going to the polls. Eight months ago Merkel was losing support in regional voting, losing. It looks pretty clear at this point that Sarkozy will lose and will be replaced by a president who wants to renegotiate and over turn just about everything Germany, France and the EU task masters generally, have agreed upon.

We already know as I've pointed out as does this article, that the rescue package that Greece is trying to obtain is already too small since it was agreed upon last October, the Greek economy has shrank faster then the Troika thought and the bailout is insufficient. The debt restructuring which we haven't heard much about lately is filled with unknown outcomes, will a sufficient number of bond holders agree to losses or will Greece need to apply retroactive Collective Action Clauses to force creditors to accept the terms. Then what does that mean for the other PIIGS once such a precedent is set? Will the hedge funds that have been buying Greek debt in hopes of taking legal action to make a profit by recovering full par succeed? What happens when Merkel and Sarkozy are thrown out and the German tax payers are on the hook for all of the Greek aide to date and a new set of leaders decides to end the great experiment called "saving Greece" with the aide already handed out amounting to 30-50% of German GDP?  "IF" this is successful or even if it is not, a precedent has been set, what stops Ireland, Portugal, Spain and Italy from seeking similar treatment?

If there ever was moral hazard, we are looking at it.

No News, but the Euro is hinting something is up

Thus far the news today has been sounding pretty positive, although we have seen this what feels like a hundred times, rumor/denial, so why the Euro just took a bit of a plunge and one candle specifically, I don't know, but you saw the last update.

 Often major changes in the market are seen in fleeting glimpses, maybe this is one?

A close up view shows the Euro declining on a series of smaller candles and then a relatively large drop on 1 candle. As far as I know, the Greek coalition government meeting hasn't started, but the Greek population is not happy and I have seen head lines of riots as today is also a general strike by several unions.

Market Update

I've had a lot of interest in my Swing Layout and the rules, I'm going to fit it in to this market update real quick.
 While I don't have the Swing Layout open, the white arrow is the highest high in the uptrend on a 5 min intraday chart, it becomes the pivot or signal candle, specifically, its low at the red trendline. The first 5 min candle to make a high that is below that trendline (below the pivot candle's low) breaks the uptrend and signals a short if conditions are right, which you can quantify with many different indicators, for now since this is an update, I'll use 3C.

 3C started going negative and the market lost all relative performance, even with a new high, the relative strength dropped way off and as you can see, the 1 min 3C is now leading negative, which adds some weight to the swing candle signal.

 The next 2 min intraday chart shows the early accumulation for the move up with the Euro and is also now leading negative.

ES below has been in a negative stance all morning.

Quick Update

I can't stress enough that today is all about Greece, the news that a final draft between the Greek PM and the Troika was being put together sent the Euro higher, correlations have been pretty strong as you saw with GLD/SLV and as you will see with the SPY. The market seems to understand that a draft document is not an agreement, the real fight will be later today when the Greek coalition ruling party members meet to either accept, reject or counter-propose what is contained in the draft, I'm actually a little surprised that the market reacted as positively as it did to a draft of conditions being drawn up, there's no real news there and as was noted yesterday by the EU, they are past the deadline. To get the money Greece needs in time, it will take time to get the PSI debt restructuring deal done, agreement itself will not pull Greece out of the fire, there is a time component and if they get the bailout tranche, but 1 day too late, Greece still defaults.


 The SPY compared to the Euro intraday, very similar to what we saw in GLD/SLV. There was an RSI divergence and for the time being, it seems likely that the market will tread water awaiting further developments.

on 1 1 min 3C chart we see early confirmation of the move off the lows to above yesterday's close (white trend line) and since 3C has fallen off as the market has lost upside momentum with the Euro.

Not much makes a whole lot of sense in sector rotation this morning except financials due to yesterday's start of pre-announcements, essentially lowering the bar for the quarter when we are only 1 month in to the quarter. Tech seems to be the strongest thus far of the 3 major groups, it also has the least correlation to the Euro. Interestingly, we are seeing some strength in rotation in Tech, but at the same time in the very defensive utilities. This is what I meant when I said rotation this a.m. doesn't make a whole lot of sense.  Energy makes sense considering the FX correlation and the recent loss of momentum in Euro upside/dollar downside. Interestingly, Industrials are way off.

The bottom line appears to be a holding pattern. I'll be watching for any unusual activity in this area as it might be an early heads up of things to come.

Gold and Silver (GLD/SLV) Update

I've had a lot of requests for updates on both, each are my least favorite assets to analyze, mostly because of the unpredictable nature of each, especially when it come to the COMEX. However, here is where we are at this point. The GLD charts were captured first and then SLV, so you will see a little bit of a decline taking hold intraday, that will be obvious from the SLV charts as compared to the first GLD charts.

On a side note, listening to Bernanke in the background as he testifies before Congress, he made a statement about the NFP that in his view, it is "understating unemployment". This is one of those good is bad/bad is good as that statement could be taken by some bulls that QE3 is not off the table. Just a little side note.

 GLD since the last update (daily chart), that odd  non-consolidation pattern did break. Applying Swing rules, the white candle was the pivot, the red candle was a break of the swing uptrend and today's candle represents noise, in a Swing context, GLD would be a short swing trade with today representing noise.

 Intraday, GLD like the market, has appreciated with the Euro/weaker $USD this morning, obviously on the news out of Greece regarding a final draft between the Troika representatives and Papademos.

 There was some initial accumulation in GLD , it is not clear that the move up is being confirmed, it did see confirmation early this morning, but that has faded.

 The same is true of the next timeframe at 2 min.

 As well as the 5 min chart...

 The hourly is the worst looking as this particular cycle  has gone from confirmation to distribution, you could think of this as the 4 stages and we'd be somewhere in transition between stages 3 and 4 (distribution/top and decline).

 Even though the trend line has been broken, as I pointed out in the last GLD update, my preference would be to see the Trend Channel broken to the downside before considering this to be a high probability stage 4 move. This of course would go a long way in helping us understand whether GLD has reached a bubble, whether that be a very dangerous primary trend bubble or a large pull back in an intermediate trend. My custom indicator at the bottom "Close within the range" (think candlesticks), grew well during the uptrend as it should have, it has since declined as I would also expect on a break of the trendline that we recently saw.

 As for SLV, the last time I updated, I said I believe that there may be a line in the sand around $34, it is likely that this has a lot to do with JPM's short on silver, we are in that area and there is significant overhead resistance in the area, There is a short term trend line that is on the verge of being broken, similar to GLD.

 Again, intraday, the Euro has supported commodities broadly this morning and GLD/SLV specifically as you can see the very close correlation (Euro in red), RSI has gone negative in this morning's trend and as you can see, as this capture is a bit later then the GLD captures, a slight fall off in the Euro is effecting both GLD and SLV.

 Intraday we see early a.m. accumulation and we are close to in line right now, with a slightly negative stance in 3C-intrady.

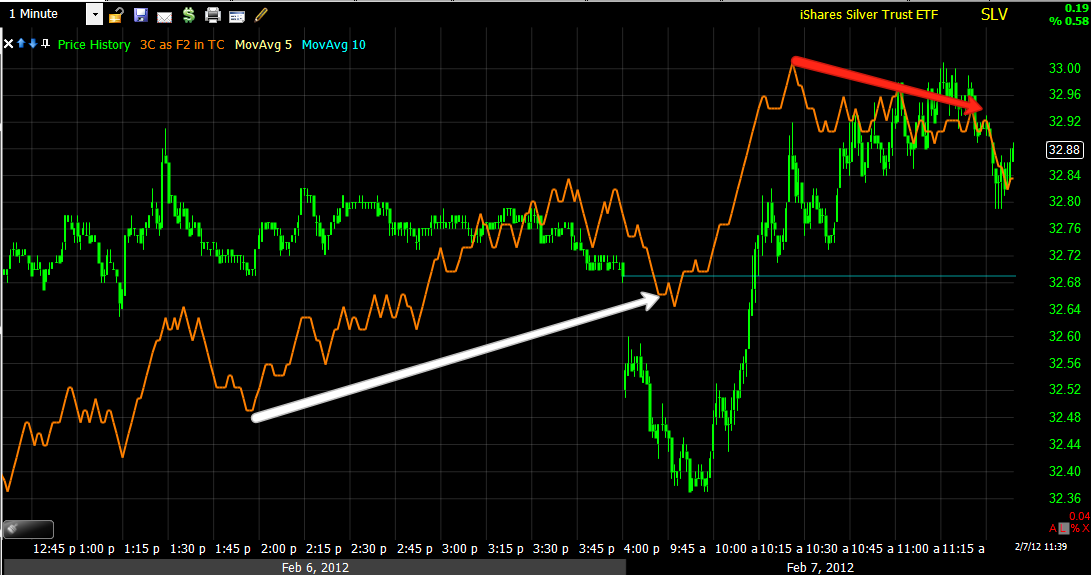
 On a 5 min chart, it does look like SLV has hit an area of resistance and appears that the next trend is being set up for a decline or stage 4, which is very similar to GLD's position.

 Longer term, the 15 min chart is confirming the 5 min chart and in the same area.

 The 30 min chart also is confirming what the previous two charts show.

Once again, the Trend Channel is what I would pay the most attention to as far as defining a stage 4 decline. Longer term, I don't feel SLV has as much of question mark regarding a top, SLV has been manipulated severely by the COMEX, at one point SLV was looking as if it may enter a bubble like area, but the COMEX (and in my opinion, to protect JPM as a favor via the F_E_D) hiked margin rates 5 times in a row in something like 6 day and absolutely stopped SLV in its tracks, this was not the kind of volatility margin increase that is normal, especially when they kept hiking it after they had already killed the upside momentum. That being the case and SLV/silver probably not being in a bubble, makes SLV less attractive to me for any trades either long or short.

Speaking of which...

Here is the chart when the Silver vigilantes (remember there was a viral web campaign to break JPM's short) finally pushed SLV through resistance that Blythe Masters has managed to maintain, the resulting move was very parabolic so a margin hike did make sense, but 5 consecutive hikes was clearly something other then dealing with volatility, it was like kicking a man who was already dead and perhaps was a message. SLV lost nearly 30% in 5 days!

Longer term it is hard to look at this chart and argue that SLV is in anything other then a primary downtrend right now.