Wednesday, December 7, 2011

Idiotic Traders

Today we saw just how idiotic equity traders can be, what's left of them. The S&P ratings agency comes out and says today that not only are the 15 EU countries on downgrade watch, but the EU itself as well as just about every bank in the EU. A false rumor about the IMF spending $720 billion dollars more then they have to bailout the Eu comes along and equities rally and this is why equities follow credit because credit is where the pros are and to prove it, just look at the Context model.
ES rallies on the IMF rumor (since discredited) while Credit and all other risk assets sell off on the very real S&P threat.

Here's ES as of now looking like it's going to give back some of those ill-gotten gains.

That's 3C leading negative and note there was no positive divergence sending ES higher, just pure IMF fiction.

And just because CONTEXT is a basket, here's the truth about the real pros in trading and how they handled the IMF rumor, they are aware the IMF is already 120 bb underfunded for current commitments and instead payed attention to the S&P warning.
 Commodities refused to rally  and weren't far from their lows of the day.

 High Yield Credit sold off into the close and close to the lows of the day

And yields did close at the lows of the day.

Today's EOD action is precisely what I would call the sheep being led to the slaughter and they make it so easy.

Unreal Rumors-IMF to lend EU $600 BB-NOT!

About 30 minutes before the close as the market was rolling over from an all day affair with filling the gap, the Nikkei News wire announced:


  • G-20 CONSIDERING IMF LENDING PROGRAM FOR EUROPE:NIKKEI;
  • G-20 CONSIDERING $600B IMF LENDING PROGRAM FOR EUROPE: NIKKEI
This ignores the fact that the IMF doesn't have the money and is short $120 bb to fund already proposed credit facilities, but irregardless, the market latched on to the rumor that had a half life of about 15 minutes as CNBC's Steve Liesman confirms the truth that there is NO basis to the rumor.

"Imf official denies 600b aid rumor.

And that's the end of that!

CONTEXT shows that only equity traders fell for this one as broad risk assets didn't move.


ES in red, broad risk assets in green, I guess some might call equity traders the biggest fools based on this latest rumor, which at this point is well above and beyond the 2008 rumor cycle. It's beginning to feel a lot like a market thats a lot worse off then 2008.

JEF/KCG Short Trades Update

We were looking for a bounce to add to the first of two the financial shorts, JEF/KCG. The 15 min charts show this looks like the area we were looking for.

 JEF 15 min

KCG 15 min.

USO trade Update

If you took the intraday trade on USO, you'll be interested in this post.
 On a 1 min scale it looks like it will either consolidate or bounce toward the close, for intraday profits I'd have a tight trailing stop here.

 However the longer term harts show more deterioration today and this may very well turn in to a nice swing trade down.

Both charts above are now leading negative, the 1 min is strictly intraday, these other two charts have day to day ramifications.

The longer term charts beyond these timeframes remain negative.

Technology Follow up: TYP Long

This is a long trade in the WOWS Model Portfolio, TYP is an inverse leveraged ETF that gives you short exposure to tech. Since the market has been directional since August, I chose a broad ETF rather then a specific stock, that will change moving forward, but for now, TYP should look like the opposite on XLK 3C-wise if there is confirmation. So lets take a look.

 First accumulation almost always occurs on light volume over a period of time as to not arouse any suspicions by traders running volume surge indicators. There's no point in accumulating at low prices if you announce to the world you are buying there, then prices are driven up and the average accumulated position becomes more expensive. We can see that very concept in TYP in a rounding volume type of bottom pattern.

 Here the 5 min chart is leading positive, the opposite of the XLK chart, thus we have some confirmation.

 The 15 min chart is leading very positive.

 As is the 30 min chart where we see two distinct areas of accumulation right about at the same level. Orders by large institutions are often placed with market makers or specilalists to be filled at  a certain price, that's why the VWAP is so useful. If the middleman can fill the order at the customer's target price, they get more business, if not, they lose business, so you an see there's a pretty particular price where accumulation is found and when TYP move up, the accumulation stops until it is back in the range.

The hourly chart probably shows this best and is very positive, unlike XLK which is very negative which makes sense as this is an inverse ETF or a short on technology.

Technology -Our next short target?

I said that as soon as we start moving out of the congestion zone we have been in, that we would move from market directional trades to sector specific and stock picking trades, financials was one of the first groups I started posting specific stock trades in, but increasingly technology is capturing my attention as you may have noticed from my recent reviews of AAPL (the last one last night)


Tech is highly dependent on low rates which we have and the other side of the equation, borrowing so as liquidity locks up in the US as I think it will (the lag effect) R&D in tech companies will be significantly reduced. AAPL being a huge cash cow is an exception, however if Black Friday told us anything, it's that consumers are turning toward low cost good and a new Macbook Pro may very well be put on hold when one can pick up an Acer for $450.00. More then anything though, the greatest gravitational force on any stock is the market first, which traders always have backwards, they look for stocks and then worry about the market when you should be looking at the market and deciding what stocks fit best with your analysis. The second most influential pull on an equity's price is the Industry group they belong to.

One of the reasons I have been looking at AAPL is very simple, Index ETFs need to be balanced to reflect the performance of the underlying stock market average that they track. So if the broad market is moving lower and the averages (S&P-500/Dow-30/NASDAQ 100) tend to move roughly in unison, then it would make sense that to balance the QQQ ETF to match the performance of the NASDAQ 100, one of the first stocks that will be used because of its size, liquidity and weight in the NASDAQ 100 will be AAPL. It may not be fair to AAPL shareholders, but the managers of ETFs like the QQQ often use these big basket names and that is one reason that they don't track well on certain money flow indicators like On Balance Volume, because many of the trades are used simply to balance the Index ETFs.

I haven't dug deep in to the specific sub-sectors yet, I'm thinking bio tech with little in the way of earnings and high dependency on banks for R&D may be a good place to start looking, but for now, lets just take a look at the overall tech average via XLK.

We will start from the micro to the macro

 Here's the recent bounce we had been expecting, look at the 1 min 3C cumulative positioning on XLK, it looks a lot like the bounce was used to sell short in to.

 Here's a closer look at the 1 min for today, the gap was filled, but that's about it, since then it's gone in to a leading negative divergence which is the worst kind.

 The 2 min chart called a negative divergence on yesterday's head fake move out of the triangle in the market averages, today, once the gap was filled, 3C went down hill very quickly.

 The 5 min chart has been lagging in a leading negative position throughout the bounce ( the longer the timeframe, the more significant the divergence).

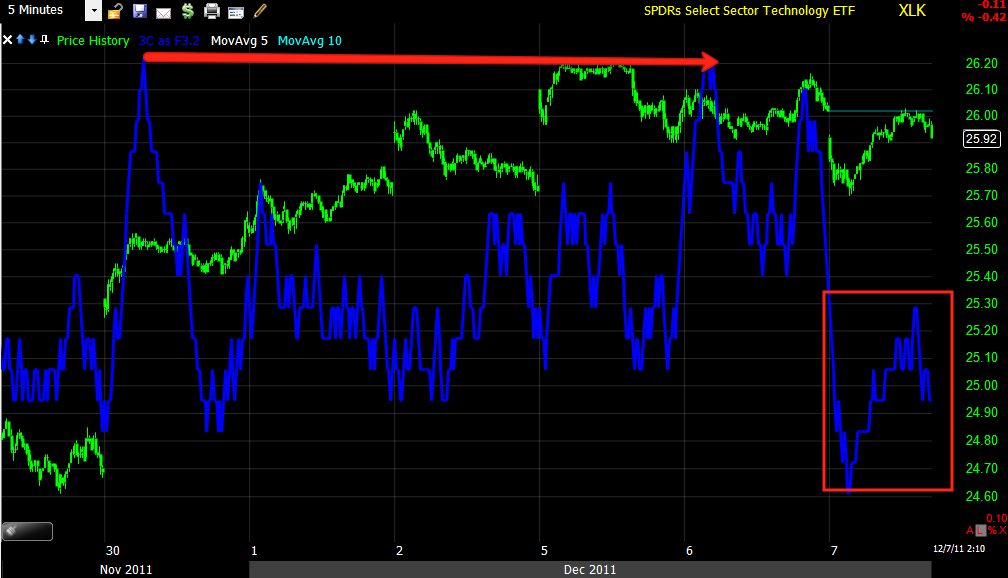
 Here's the zoomed out 5 min which saw a relative negative divergence at the red arrow and a leading negative at the red box. Again, this signals distribution which is selling, whether it's outright liquidation of longs or short selling, we can't tell the difference, other then connecting some dots, for example, was there a strong accumulation period before the rally?


 The 15 min chart did accumulate share at the lows in the white box, but not that many, so as prices went up, they were sold in to strength, but since there wasn't a huge inventory and 3C looks progressively worse, we can deduce that later selling in the trend was short selling.

 The 30 min shows much the same and is leading negative on a relatively long timeframe, even though it sounds like a short intraday timeframe, it can effect trends that are longer in duration then a swing trend.

The hourly should give you some idea of how potent a negative divergence can be on this chart, just look to the far left in July, those negative divergences led to a deep sell-off and now XLK is leading negative and hitting new lows that haven't been seen probably all year.

So, expect to here about tech names to put on your list in the coming days.

Credit/Risk Assets

The reason we follow these is because credit tends to lead the market and risk assets should rally with a risk on rally in equities. When that doesn't happen, we get dislocations and the market usually corrects, in this case to the down side, and sometimes quite violently.
 Commodities have tried to keep up with the s&P as it filled the gap, but they remain severely dislocated as the longer term chart below shows. This also has been the basis of our theory of a weakening China, and we saw this probably a few weeks before China's PMI numbers confirmed what commodities where telling us.

 Longer term, commodities are virtually running in the opposite direction compared to the S&P, not a good sign and this is why I consider this bounce to be one that can be used to add to shorts or initiate new ones so long as you are aware of the volatility possible during Friday's EU summit, which may produce a short term photo-op sugar rush, but if the EU could figure out how to make 2+2=4, they would have done so by now.

 Yields are moving lower today, equities gravitate toward yields.

 Longer term there's been two serious dislocations between yields and the S&P, the first saw a nasty drop, I imagine this time shouldn't be too much different.

 The Euro which has a historical nearly 1.0 correlation with equities (so long as QE is not underway) remains severely disconnected from the S&P-500.

 High Yield Corporate Credit has not been as excited compared to equities, there have been several recent dislocations like this one that have all led to downside in the S&P.

 XLF had some momentum this morning in filling the gap, but...

Longer term, not able to keep up with the broad index.

As for the European close,
High Yield European Corporate Credit lost ground all day today, despite the European gap up on the open (a European dislocation and apparent flight out of risk).  EU Financials lost ground as well swinging from their highs to their lows.  There was a signifiant move out of low quality credit and in to higher quality credit (another safe haven trade as traders deleverage risk and move to safer environments.) EU sovereign yields shot up higher, there was a late day bounce on news of an ECB intervention in the secondary markets (buying up debt to try to stabilize yields from moving even higher). Commodities also lost ground, I believe this is not only a sign regarding the risk trade, but a larger sign of problems in China.

Finally CONTEXT gave up support for the move in ES toward the end of the European session.
You can see CONTEXT decoupling from ES as they were largely in lock step.

All in all, from Europe to what we have seen in the US thus far, (although I still need to look at several industry groups), it appears evident that the appetite for risk is diminished and I believe that started yesterday with the head fake move above the triangle noted, which allows for short selling at better pries and remains a highly predictable weak point in technical analysis which Wall Street has long ago adjusted to, but technical traders still don't get it after nearly a decade.

Should my long term hypothesis of a first ever secular bear market come to fruition, these trader are going to have no idea how to trade it as they can't even adjust to the typical technical pattern head fakes. It's so pathetic that there's actually free software that will dig up whatever technical pattern you are looking for, now imagine what Wall Street is using to run these head fakes, not the least of which includes a fully open order book (which is why all my orders/stops are mental until I place them).

USO looks like an intraday short here

I said earlier we usually get a bigger move and was a little concerned that the first divergence was a consolidation, both turned out to be true.

However now we have the typical move and 3C is falling apart, if I was taking the intraday trade on USO, I'd take it here.
 The consolidation and a move higher more in line with what we normally see and a leading negative divergence

The 5 min chart, which is more important is negative here. This is where I'd take the intraday short.

ES Futures look ready to follow suit

A slight positive divergence at the lows of the day as the market moved to fill the gaps, and a negative divergence now. Note the move to fill the gap was on declining volume.

Credit/Risk indicator update coming up next.

Market Update, Here it comes...

As I mentioned in the last update, very few gaps are left unfilled and it's all about the gap this morning, as the DIA filled its gap, weakness started to set in. Now that all the averages have filled their gaps, 3C looks ready for an intraday reversal to the downside.

 DIA 1 min

 IWM 1 min

 QQQ 1 min

SPY 1 min.

I Wonder if Timmy G. Proposed this yesterday?

It's been announced through a Thursday edition of the German newspaper that Wolfgang Schauble, Germany's finance minister is taking a page out of Hank Paulson's playbook, one in which then NY F_E_D head, Timmy G. was present, and being he started his advice tour yesterday, it is ironic that Germany is about to do the exact same thing that Hank Paulson did, stuff German banks full of liquidity whether they want it or not.  The irony here cannot be emphasized enough and given Timmy G's presence in Europe as of yesterday, the timing makes it that much more ironic.

Which now leads to the question of just what in the heck is really going on in Germany. Commerzbank is a known wounded institution, but this is all German banks apparently and it sounds like (from the bad google translation) that there will be an element of nationalization of these banks which is not surprising in Commerzbank's case as they are already 25% the way there.

The second question is what is Germany really preparing for as the summit draws near and lastly, how worthy is Germany of that triple A rating?

Everyday it's something, I wish I still had my news buzz/count indicator, you'd see how off the scale we really are with nearly a month's worth of news coming out in a single day now.

GLD/Gold Update

I have been cautious of GLD ever since it first hit the 150 day moving average where it has been a screaming but for nearly three years, but this time it looked different and I have urged caution. There are a lot of things that don't make sense, why is oil looking so weak with the geopolitical tensions, why is gold looking like a potential top when we are in one of the biggest fiat currency crisis the world has seen? I don't know the answers to these questions, the same way I didn't understand why during the 200 tech meltdown, homebuilders were seeing incredible amounts of accumulation only to see a housing boom a few short years later. It's hard to know why smart money does what it does and if you wait to for the reason, you missed the move.

In any case, GLD doesn't look that great here, it looks like a top is forming, whether it is a bubble as I have brought up or an intermediate top, I don't know.

 Large triangles at the end of trends, whether up trends or down, tend not to be consolidations, but rather tops or bottoms, this is what I would call a large triangle, much larger then a consolidation pattern and volume is correct for the pattern. It is near the apex so the break is coming shortly. I would guess that the break will be down (not accounting for possible head fakes as I have seen head fake breaks on triangles of this size, ADM comes to mind) .

 Here it is in the trend, volatility by volume looks right for a top.

 Here's the 150 day moving average which has been a great place to buy over the last few years, however the way GLD approached the 150 on the last run was worrisome, it wasn't a pullback, but a full on decline and this is why I urged caution in buying near the 150 day ma. As you can see, thus far the touch of the m.a. has not led to a new leg up, but rather a volatile triangle. A break below the moving average will be a very bearish sign and I would certainly be looking for short exposure.


 Short term the most recent bounce looks like it has played out already.

 On a 15 min chart we see accumulation areas in white and distribution areas in red.

 More disturbing is the 60 min chart which has gone from confirmation, to distribution to a leading negative divergence lower then any other 3C reading in more then a year.

The long term daily charts are just as bad and this 6 day that reduces noise is leading negative for the first time in nearly 7 years. Something is certainly going on with GLD, we are not out of the volatility zone in the near term as a false breakout could occur, or even a break below the 150 day moving average (very bearish) is likely to test that average and perhaps even bounce toward the apex of the triangle in the "Kiss goodbye" retracement that is often seen. However, for those who have a longer term perspective and are patient, this could be a huge opportunity in GLD. While short term swing trades can be taken, the real money would be in a trend reversal. We'll keep watching GLD, this has been a worrisome trend that has been developing for some time now.

USO looking worse here

We usually get bigger swings, but USO is now entering a leading negative divergence here.

Market Update

Very few gaps have been left unfilled and I think that is what we saw this morning, but it looks like they are ready to turn down on an intraday leg.

 The DIA filled the gap and has turned negatively divergent.

 The Q's almost filled the gap and they are turning negative now.

The SPY didn't quite make it, but it is turning negative as well.