Tuesday, January 15, 2013

UNG Opportunity

For long term members, you know UNG (Natural Gas) is one of my favorite long term secular bull market positions and it seems we are in the right place at the right time to start a position or add to one or just hold.

 We first noticed a change in character before UNG changed it's downtrend, you can see it here on my favorite chart to start analysis with, a 5 day- look at volume. Since then, a lot of very interesting things have happened including legislation that makes Natural Gas and Nuclear the only two viable energy sources for any new US power stations.


 We identified the base in UNG through 3C positive divergences and many members already have a +25-30% gain and we haven't even started stage 2 mark up yet. We also identified this last failed breakout attempt as a head fake move and that gave members the chance to sell UNG high and be able to buy it back low, but it also told us that the pullback was likely going to be used to accumulate a big enough position so the next breakout will take us to stage 2 when the stock moves in to an uptrend.

 Here's the 60 min 3C chart clearly showing a leading negative divergence at the head fake breakout in yellow, but on the pullback as we predicted, we have a huge leading positive divergence.

 The 15 min chart is also leading positive and the reversal area seems to be clear, but we may also have a short term pullback allowing us to enter UNG at a lower cost and less risk.

 The 2 min chart (intraday) seems to agree, so w'll be looking for a pullback and short term accumulation to tell us when to look at buying or adding to existing UNG long positions.

I'm thinking the 60 min Trend Channel will hold the pullback so you might want to set some price alerts for the $19+ area. I'll keep an eye on it and let you know when the intraday charts line up with the long term charts, there we should find a good bargain and high probabilities for a trade that could last years.

DeMark Calls AAPL Bottom

It seems Tom has been busy this week, a market near the top, AAPL near at a bottom, interestingly all in line with our own analysis.

Tonight on CNBC Tom DeMark, who is one of the go to guys for Stevie Cohen of SAC Capital and well known, said that AAPL either bottomed today or will tomorrow in this video.

Of course I had no way of knowing this as I didn't even here about it until after 9:30 p.m. tonight as I had a meeting, but you may recall earlier today this post, AAPL Quick Trade.

Most of you know I am very sparing on options positions, I have a very high standard of evidence to consider an options trade, yet that's what happened here in a following post today, Speculative AAPL Calls-February $485 finally followed by this post later today, AAPL Charts in which I pointed out strong leading positive divergences on the 1, 2, 3, 5 and even out to the 10 min. charts.

This is the second night in a row I've heard DeMark make a call and it's the second one that is pretty much exactly in line with what we have been predicting.

My DeMark inspired indicator isn't giving a signal, I believe Tom's TD Sequential is the one giving a signal, but 3C was giving strong signals today as you can see above.

One other thing I might point out, especially for new members if this trade works out as planned...

The price pattern in AAPL right now is a large descending triangle which is a bearish consolidation/continuation pattern. We not only thought we'd get a head fake, but we discussed several times a Crazy Ivan head fake. You see, for Technical Traders, they expect this price pattern to follow the red arrows, the breakout to the upside would have voided the pattern thus it's a head fake move in yellow. The Crazy Ivan is another head fake breakdown in the opposite direction, essentially clearing and/or triggering all the stops and orders. Yesterday I talked about AAPL and the psychological century mark of $500, the chance of a Crazy Ivan and today we have the signals that would tend to confirm today's break down as a Crazy Ivan head fake making the long call trade today a high probability trade. It will be interesting to se how this plays out, but I rarely hear of DeMark calls and now 2 in a row and both the same direction and the same timing as our own analysis, I'd actually prefer DeMark didn't make the public calls, but they're out and it will be fascinating.


So far, So Good

There's a really delicate balance between getting a great entry that also substantially reduces your risk and gives you a much higher probability trade, and getting lost in the lines as I call it-essentially being so myopic that you miss something really good over something so miniscule.

However in most cases like this, it's only after some time has passed do you realize what a great entry you actually got. Our short in BIDU earlier this year was honestly about the best entry you could ask for, I think most people wouldn't even believe it. We did this with a number os positions, by far the majority and I don't think we took anything that was more than 5 or 6% off the local top.

In BIDU's case it travelled sideways for a bit longer, the entry was still as good as you could get, but we had to wait a few more days than I'd prefer. Other positions we entered on May 1st which was the last day before the market started down. This is one reason I prefer to phase in to positions, you look back a month later and a few percent here or there makes absolutely no difference.

Any way, I've had a gut feeling since we first expected Trend #1 that trend #1 would dovetail in to trend #2 (act as a momentum primer) and this is pure gut feeling, but that the reversal would be fast.

If you have been around a while, you know that I almost always talk about any reversal either up or down in terms of a process and not an event, a "U" rather than a "V". I don't know why, but I have felt strongly that trend 1's reversal would be a strong first half of the day, one that has people talking (although we kind of already got that with the IWM new high) and then something just as strong , but happening in a very short time (I wouldn't be surprised if it was intraday).

In last night's Daily Wrap, I noted the following...

"As for the 1-5 min charts of the averages, the IWM looks the best right now, I'd call the 5 min chart a positive divergence, the QQQ have a positive looking 1-2 min but negative 3-5 min,"

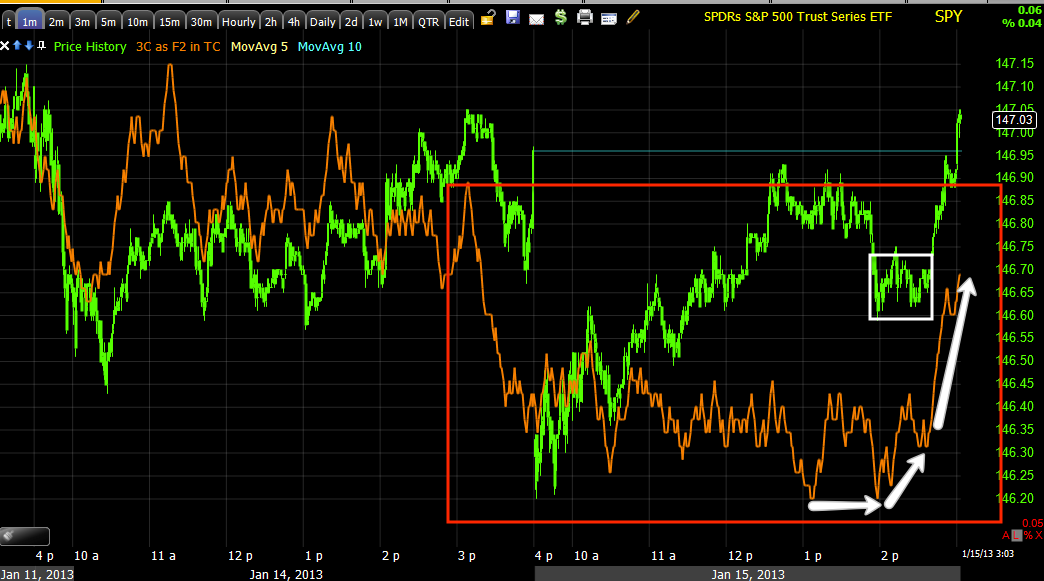
As you probably know, the IWM outperformed the Q's today, but the IWM and Q's flipped places on the 3C charts. In fact I'm going to show you something later in the IWM leveraged long and short ETFs toward the end of the day.

The other gut feeling I had that was more recent, today in fact was that the earlier downside wouldn't hold yet and we'd see a move to the upside, but as that move went up, leading indicators would head down as well as 3C charts, they'd see worse divergences.

As far as we got today in the afternoon run, there is more weakness in Leading Indicators: Commodities came off the highs of the day, disconnected with the SPX and weren't too far from closing at 0%. The SPX moved up WITH the dollar, that tells me there's manipulation of the market, but I'd be shocked if there weren't. HY credit performed worse today than yesterday and sold off in to the close as the SPX went the opposite way!!! Hurrah! Yields hit another new lows since their negative divergence, the Euro appears to be done with it's move and finally, while it wasn't what I hope to ultimately see, HY Corp. Credit and Junk had trouble with their end of day performance vs the SPX, so that's another strike.

There were some other things I liked and there's a lot I haven't seen or been able to scan until the EOD stats are in.

I'll probably have a closing wrap a bit later as I am going to Skype with my wife who is still in Budapest for just about a month now and then I have a meeting at 7 p.m. until about 8:30.

I'll also be positing at least 1 long position that I really like as well and I think you will too, so hang in there, bear with me and we'll have it out tonight.


If I had to guess

Looking at the difference between the IWM and QQQ chart, I'd say the Q's rotate in tomorrow and IWM rotates out. It was like this yesterday, QQQ didn't look strong, IWM did and look at their performance.

So if I felt I wanted short coverage today, I'd pick IWM (SRTY) and try for SQQQ (QQQ short) tomorrow.

AAPL Call position still open

There hasn't been any deterioration, this makes me feel a little less rushed because I'm thinking we will have at least tomorrow based on what the short term AAPL charts look like.


Couple of Positions Taken

More out of time than anything I just grabbed


A FB (short) add to
I like GOOG (short) as an add to, but I'd like to wait
VXX is a long add to that I just decided to do
DE us an add to, but I think I'll wait just a bit
IBM is working (short) so it was an add to position that I went ahead with
ERY (long) seems like it would make sense, I would like to explore the chart some more before jumping in.

Of course there are the leveraged short/bear ETFs, SQQQ and SRTY are both open, SDOW and SPXU are two others.

FAZ or SKF are short Financials,

TECS short Technology.

However as I said, you want to be careful not to over-correlate too much.

If I had to chose 4 positions, I'd go with SQQQ, SRTY, SDOW and SPXU, they have exposure to Energy, Financials, Tech, small caps and large caps.


Hints

You know the reversal scenario I described, here are some more hints that support that and make me think that it may be better to start adding some of those positions before the close.

Check it out...
 DIA 2 min would have only had a very small accumulation period this afternoon, that wouldn't be enough to sustain the move very long.

 At the next timeframe, 3 mins., there's no sign of migration of the divergence so not only was it short in duration, but not all that strong.

 IWM 1 min is moving up in to a negative divergence

The SPY is similar to theDIA, the accumulation period would have been very small and on a short term chart. In addition, although if I zoomed it would look like a leading divergence (positive), the whole thing is in leading negative territory.

Trades

In my gut feeling scenario I imagined a very volatile move to the upside and that is quickly followed by a very volatile move to the downside, this is not the norm for a reversal, usually we have more time (if this is how it goes down), so this could be a very tight squeeze.

There are some assets that I like right now and some I'd like to get at a little higher prices.

GOOG is one that I think is worth it here, if you can add at a bit higher level, great. Remember if you are phasing in to a trade or considering it, that needs to be part of your risk management before you ever enter, it can't be a reaction that violates risk rules like Dollar Cost Averaging.

Volatility looks really good here, very tempted although it could see better prices. VXX and UVXY long are the plays, I'd be looking at an add to with VXX.

FB a bit higher because it seems like there's some game with support defined intraday like that.

FAZ I like a lot, but as an add to, I'd rather wait a bit unless things go really bad at the end of the day and it looks like a gap down tomorrow

AMZN short, SQQQ and SRTY long, maybe SPXU, but be careful with correlation. If you are short with SQQQ, then watch the Tech correlation with say something like TECS long.

There are a few longs I want to look in to as well, UNG being one of them.

I'll bring you more as I can, but I really need to pay attention here. I am expecting this move has some upside volatility, but again that is what I have been expecting for the reversal so that would put us right at the reversal.


Market Update-Up

The scenario laid out a few times of the market coming back up and hopefully we just get more negative and leading indicators fall, looks like we are going to at least get the first part of that with the up, there are enough positive divergences that this is real and should hold as a move, there are enough negative to make that scenario a high probability.

FB Announces New Graph Search Feature

Volatility went nuts, implied volatility was at 7 month highs vs realized volatility before the announcement.

Here's what FB looks like now, I'm still leaning toward I like it long term, but I think it needs to come down first.

 Daily base in FB and Breakout, I still like it longer term, but as I said above....


 Intraday volatility looks like algos went crazy with this

 The 60 min trend channel which has held this entire trend is giving a sell signal here.

 The daily chart has a slight negative divergence, that would be along the pullback lines I'm thinking and have been thinking

 30 min is negative relative


 Now short term 1 min there's a positive divergence, I think it's because there may be some artificial support that has been created, if the divergence migrates then it's a different story, but I think risk management can handle the situation if anything changes.


 2 and 3 min are in line w/ price as I'd expect.

 5 min trend has been negative for a while.

 A closer view of the 5 min

 Here's where it's stronger probabilities, 10 min leading negative

15 min leading negative.

I suspect there may be some game playing around what appears to artificial support, I'd personally take FB here at 1/2 a normal position in the equity model portfolio and wait to see what the game is or if there's a better entry to add to.


Answering Some General Questions

On days like today when I need to be paying attention as the market moves fast and I need to be watching probably 40 different assets, it's hard to get to emails as my first responsibility is to update all members, then emails. I'm going to try to deal with a few emails in this post.

As for Credit, Junk Credit is acting worse now than it was before, but by and large I believe the downward pressure on the market right now (other than the negative divergences) is the $USD shooting up.

US Dollar shot up, the Euro shot down and the market followed. As for the $AUD, overall it has a slight negative tone, intraday though it's tracking the market nearly perfectly. Yields just continue to move laterally at their lows, they haven't grown worse which is one reason I'm still trying to stay patient although I certainly have the "Itchy finger". Commodities are tracking with the market due to the $USD.

Again as to credit, Junk is underperforming the market, HY hasn't changed too much since the last update and HY Corp. is just ever so slightly underperforming the SPX. I'm kind of hoping the market pops back up to the intraday highs and the 3C charts as well as leading indicators just keep going south.

That may be a possibility as the TICK is starting to break the downtrend channel to the upside, but at least it's finally showing movement with the last move down hitting -1200

I'll cover some more individual stocks you have asked about.

As for a quick market update, the DIA 1 min is positive, the 5 min still hasn't gone negative which kind of fits with the scenario I spoke of just above, the SPY is still ugly, not too much change there.

The QQQ is starting to show a little more negative activity than before.

The biggest change on the day is the IWM, for that reason if you don't already have some coverage in the IWM short, like SRTY (3x short the R2K/IWM), that would be one I'd certainly be interested in and I believe that's one of the add to positions that I'll probably wait out just a bit longer and see what happens in the next hour.


GOOG (Short)

This is on the list as an add to. There's been some strange price action just a bit ago. GOOG was negative in to the upside portion of that price action.

For me, I think GOOG is worth at least a partial position here and I don't think I'd have any problem filling it out today personally.


Volatility is getting very close

These can be tough ETFs to trade, especially since the recent asset of choice to try to support or ramp the market over the last week or so seems to have been selling volatility.

I have to imagine that the epic volatility in the VIX is going to continue and likely see a new record move set.

I'd be looking at adding to VXX, but I know some of you are interested in UVXY.

 1 min leading positive today

 There's a longer positive trend, but I'm trying to focus on today, 3 min really leading positive, very nice divergence.

 60 min where the long term probabilities are, leading positive and I'm not convinced that the November area isn't part of the same overall accumulation as there was no negative divergence at the downside reversal.


 XIV is the Inverse of VXX and UVXY, it should have the opposite price action and 3C signals, the 3 min leading negative

 5 min leading negative

I'm curious to see how far the divergence can migrate today, if it can go to 10 or 15 min today, I'd be a buyer of VXX.

And the 60 min in XIV as well with a leading negative position confirming UVXY.

Right now I'd hold, but I'd certainly have this on the radar.

Thinking Out Loud

I'm going to pick a couple of charts to represent each average and give you my gut feeling with regard to what's going to most likely happen which is more or less a game plan for when to enter positions on the short side.

 DIA 3 min leading negative, the 2 min looks a lot worse, the 5 min is still close to in line.

 SPY 2 min leading negative, the 1, 2, 3 and 5 are all negative, still probably the worst looking of all the averages. The only thing it has going between the intraday negatives and the 15 min negative touching is a 10 min chart that is more or less in line and that's it.

 I was surprised at how fast and how negative the IWM 3C charts turned, this is 3 min, but the 1 and 2 min look worse and are hitting new lows below anything on the chart! Only the 5 min is more or less in line.

 QQQ 1 min is not negative at all, it's in line with price and if anything actually leading it a bit.

The 5 min chart has managed an in line status.

I'm thinking if we go down intraday soon, then perhaps before the close we make a bounce attempt and we see the 5 min charts then go negative and that would be an ideal area especially if leading indicators fall apart more and we get stronger signals in the assets that we would want to enter.

The other possibility is that we range in this area and just keep going negative from here, in either case we'd be looking for the same things to happen so I'm going to be on watch. I'll bring you anything I really like as of now.

AAPL Charts

 1 min leading positive in a pretty big way today


 3 min trend in leading positive position

 3 min intraday leading positive as well

 2 min leading positive, there's very good migration of the positive divergence from the 1 min chart.

 The leading positive trend of the 5 min chart.

As well as intraday.

I believe this is why the QQQ look so much different than nearly everything else.

Speculative AAPL Calls-Feb $485

Discipline requires that I have to keep the size speculative because of the AAPL calls already in place. I'd probably be a little more speculative even without other calls in place.

AAPL Quick Trade

There  are quire a few of the charts that are looking bad, there are a couple that aren't, specifically the QQQ which makes me suspect that AAPL is going to make a move to the upside as the charts there continue to look better. In fact I think I'd consider AAPL calls for a short term trade.

Market and AAPL charts coming

Leading Indicators

Ok, we have some changes, some that have been negative are worse, some that started going negative are continuing and some that have not done anything are just starting to. I would not call the current Leading Indicators a solid reversal signal as we have seen much better signals, but it can be one of several things, the signal just isn't going to be as good as we have seen in the past due to a number of unique circumstances or perhaps they will start to show more momentum and actually look the way we have seen them in the past when they were giving the highest probability signals we have seen.

 Commodities did not act well for quite a while, now for whatever reason (there are a few possible I can think of), commodities seem to be trying to revert back to the SPY's risk level. I suspect they may kiss there and head down together.

 The move today in commodities is seen here vs the $USD, as you can see, commodities are being driven up by the invisible hand, the $USD hasn't made a lower low so commodities "shouldn't" have made a higher high, but that's what short term manipulation looks like.

 The same is true of the S&P (green) vs the $USD, the $USD didn't make a lower low, the SPX looks like it was just pushing through froth to an intraday blow-off area.

 Here we see the Euro weakening, this is all about Germany and exports, they can't afford a high Euro with Germany on the verge of a recession.


 Yields (the equity magnet) continue to track lower in a negative divergence with the SPX, this is one of the best divergences, but honestly it is still not as strong as some past ones we have seen, well...  it's a tough cal, it's pretty close.

 Here's the same, just intraday today.

 On this chart you can't se the sell-off yesterday in HY credit, you can see it in my Closing Wrap post from last night. In any case High Yield is adding to the downside and negative divergence with the SPX, which is something I speculated would happen and bleed over to Junk and HY Corp. Credit too.

 This is the over all High Yield Credit divergence, it's starting to take on some shape now beyond just intraday charts.

Junk Credit is starting to take on a little shape too as it diverges with the SPX today, this was the speculation last night, "HY credit's EOD sell-off will bleed over to the other 2 forms of credit".

High Yield Corporate actes weird yesterday in that it tracked the SPX nearly tick for tick (green arrow), today there's a very slight negative divergence, but also remember that HY Corp. Credit has near record short interest, that doesn't always translate to a short squeeze, sometimes there's good reason.