Thursday, July 12, 2012

The EUR/USD looks to be the catalyst

A quick refresher in currency/market correlations, a weak dollar makes US goods and dollar denominated assets like oil less expensive, so the arbitrage correlation sends the price of those higher. The Euro trades against the dollar so it behaves the exact opposite most of the time, meaning that a stronger Euro means a stronger market and commodities in general. Just think of the Euro as a risk on currency when it rallies and the Dollar as a risk off currency when it rallies.

I don't want to get too ahead of myself, but we did note some strange behavior in 3C on Tuesday, it seemed like there was a VERY sudden shift which kept the 1-5 min timeframes more positive than I expected them to be; it was startling and I'm still not sure if maybe, just maybe someone in the smart money crowd got word of something coming up.

If we were to see a new round of QE for instance, that would send the dollar down and in the past, send risk assets up, whether they deserved it or not, the correlation took over and that was that.

This post shows underlying weakness in the dollar, there's some underlying strength in the Euro which is a market positive, I don't know which came first, the chicken (Euro) or the egg ($USD). I see no reason for Euro strength, so it is possible there's some WE rumor in smart money land, but that's just wild speculation based on a few observations at this point, but I want you to know what is in my head as possibilities.

For practical purposes, it seems the EUR/SD will strengthen very soon (maybe overnight) and this should be market supportive. The charts in the two currencies aren't exactly the mirror opposite that confirmation would demand, but there are different issues in each so there's a little difference here and there, but the trend overall is what is important.

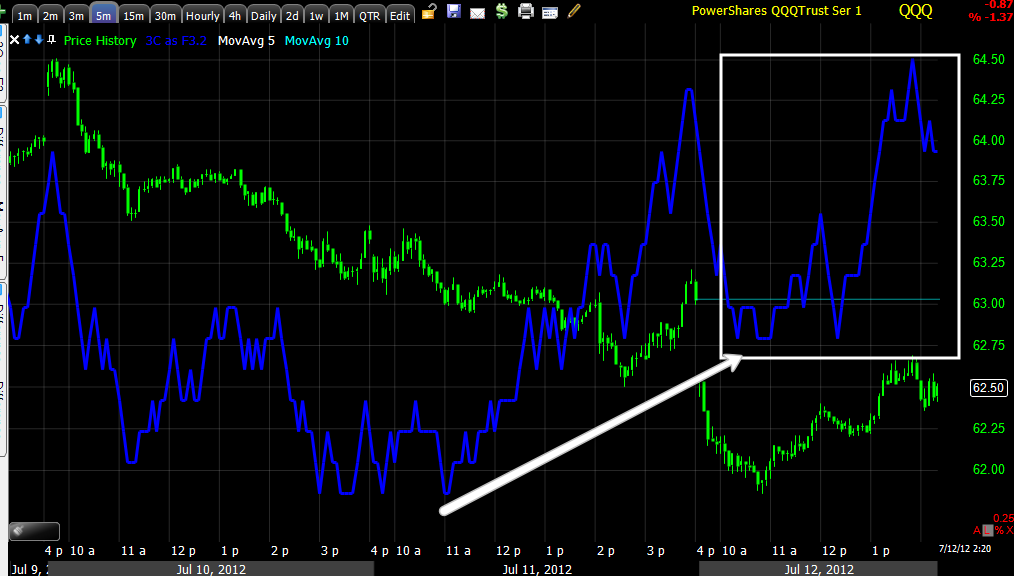
This is a comparison between the Euro (E) and the $USD (U) in various timeframes

 E 1 min

 U 1 min

 E 2 min

 U 2 min


 E 3 min

 U 3 min

 E 5 min

 U 5 min

 E 30 min

 U 15 min

 U 30 min

 E 60 min

 U 60 min

E 4 hour

If anything, it looks like whatever the catalyst is, it's going to move the currencies which will move the market

LOL-And there it is!

It takes a bit of time to capture, upload, comment and post; while I was doing that this happened...

That's 3 intraday calls today that have worked out just as 3C was showing, 1)the gap fade up instead of a break lower 2) the consolidation on the 1 min negative and 3) a bone for the shorts

This is that bone (or at least the start) that I just posted would likely be seen.

The shorts see today as a "bounce" and failed attempt at gap resistance. 10 years ago I would have shorted a set up like this.

Like I said, I'm not too concerned with it, we've had a week of leading positive divergences suggesting more upside in the short term timeframe (which I would normally define as 5 days or so-although lately that seems to be a little optimistic).


Just a head's up

Just to give you an opinion here...

Earlier I mentioned a negative 1 min divergence and made the distinction between a pullback and correction, since then we've pretty much seen a correction. I wouldn't be surprised to see some downside volatility, especially with resistance from the gap in the area, which would bring shorts in and frustrate them again, but overall the market looks better and better for another short term move higher, perhaps in to last Friday's gap area, maybe more. Here's what I mean

 Remember this 1 min leading negative divergence? I thought it would either pullback intraday or consolidate sideways.

 It's been pretty much a sideways consolidation, bears see this as a loss of upside momentum, a failed gap fill attempt, etc so the market may throw them some downside confirmation to drag them back in on the short side.

However the longer the timeframe, the more important it is and we have been looking at leading positive position 1-5 min divergences, take a look at the 5 min chart below.

 The 3 min suggests to me the market may give the shorts a little bone to get them in, the more shorts, the easier it is to move the market higher.

The 5 min chart has no signs of any negative divergences and is leading positive. I wish I had taken the time this a.m. to place a long trade on the idea of this gap down being fadd to the upside, it would have made for at least a decent quick trade, but I feel pretty confident that we'll see a move to the upside so I'm not too concerned with any intraday noise between now and then.

GDX Follow Up

If you prefer, GDXJ (Junior Miners) don't look much different than GDX.


 1 min positive leading divergence, just pay attention to the gap resistance coming up from yesterday's close.

 The trend of the 1 min chart shows a clear change in character, the first one since it turned down

 2 min chart also leading positive, note the head fake move in orange, today seems to be a little head fake move as well, I like these for entries, less risk.

 The 5 min chart showing a leading positive divergence as well.

The 15 min chart looks good here for at least a short term trade. Maybe I should have taken GDX rather than GLD.

Gold Miners/GDX Follow Up

Yesterday we looked at Gold miners, specifically GDX.

The first paragraph of yesterday's update went like this

GDX-Gold Miners, is interesting. I'm not a big believer in "V" shaped reversals and the fact of the matter tends to be, "The larger the base, the greater the move it can support", so in light of GDX's price position, I personally would prefer to see a larger base form before considering GDX as anything more than a VERY speculative long.


And today...
 More of a "U" shaped base rather than a move up yesterday which would have been a "V" shape.

GDX also broke below recent support on positive divergence and today is forming a bullish reversal daily candle on increased volume, something we've noticed in the past to be a pretty effective combination.


I probably wouldn't mind looking at a speculative position long in GDX right now, the charts yesterday looked pretty good. I'll post this so you can consider it and get some more charts together.

GLD AUGUST 152 Call

I just want to reiterate for newer members, I AM NOT a fan of options, I do however think you need to use the right tool for the job and with this market being as choppy as it is, quick trades have worked well for us, but they aren't worth the risk in most cases without some leverage. When we have a better trending market you'll see far fewer options trades if any.

I decided on a GLD Aug. $152 Call, about 50% of a normal position size, so still in the speculative range of position sizing.

 I wish I was able to take my own advice and fade the gap from this morning, but my first duties are to the members.

I like this 15 min chart's look for a short term trade, perhaps up to the $162.50 area as mentioned before. I said earlier in the week the 15 min chart was shaping up and the last 2 days it has really looked a lot better.


Closing GLD Put-Moments After the last post...

First I'm closing this put based on the last post...

 It's a small loss of 7%, not a big deal

 Just after I published the last post, GLD breaks out intraday

 Here's the large flag's support which GLD pulled back to and local resistance ahead. I may consider a GLD spec. long call position, I'd like to have the time to watch how it reacts at the white trend line, but I don't so if I enter a GLD option, it may not be the best entry, but that's the time I have. I'll let you know if I decide on a position.


The larger view of the bear flag, in the white box you can just make out a bullish descending wedge.


A Different Perspective on GLD

The danger in analysis of stocks, markets, or even just general opinions (you ever notice when you have an opinion of someone you just meet, it sticks and can be hard to shake-even when you finally do shake it and they do something, you jump back to that opinion? Those are generally arbitrary opinions that most of us are all too happy to form), these opinions in the market can be very dangerous.

In life if we don't form an opinion of something (think politics), people say we sit on the fence, we don't pay attention to the issues or we are apathetic. There's nothing wrong with not having arbitrary opinions, changing your mind when facts present themselves and trying to see both sides of an issue.

In any case, I'm applying this logic to GLD which we have recently been trading from the short side based on the longer term charts, even though the daily chart appears as if it may be shaping up and a new trend in GLD (was an uptrend, changed to an intermediate downtrend), most likely a long term bullish one may be under construction.

Still, short, hit and run trades are working best right now.

 These are the areas we have made some of the bigger trades in GLD both short and long and recently the trades have been based on that small bearish descending triangle. So lets erase the trendlines and look at this again.

 Now we see a bigger pattern, a bearish bear flag and quite large. If in fact this is correct, then the short term move in GLD should be up to the top trendline. I have thought for the longer term trend to turn bullish, it will have to break below the lateral trendline which is also similar to a break below the large bear flag.

 Near term 2 min shows price being knocked down and recent positive divergences (first a relative positive, then a leading positive).

 Again on the 5 min, price is knocked down from a head fake breakout in the yellow box with a strong negative leading divergence and several positive divergences formed.

 I stopped trading GLD from the short side because the 15 min chart started shaping up, here it is in a local leading positive divergence

 Even the 30 min is shaping up, going from a relative positive to a leading positive divergence

And the 60 min chart is shaping up too.

I still think trades in GLD should be leveraged to make them worthwhile and nimble/short lived. I think we have a ways to go before a new primary trend is established, but this bearish pattern actually would be helpful in establishing a new bullish primary trend.

In the mean time, GLD may be worth a look for a speculative long on a move to the $162.50 area.

Follow up-Charts

These shorter term 3C timeframe divergences can mean a consolidation which is a correction through time or a pullback which is a correction through price. Lately the market has found more utility in price movement, my sentiment report yesterday had the Twitter Stream traders actually cursing the market, both longs and shorts as it chops about and these traders are finding their conventional technical indicators useless. I'd guess most are trading based on pure emotion and opinion and as usual, chasing the market at the worst possible time to chase a market.

 ES 1 min has a large relative/leading positive divergence compared to the negative intraday so again, given what we see on 1-5 min charts for the last week or so, I doubt very much this is a pullback of any meaning, just noise for us and headaches for retail.

 I like the IWM/QQQ version of 3C for stuff like this as it responds faster than the other versions (which is simply a function of different asset classes trading differently, but also makes some sense as the yellow version tends to be a bit slower and also tends to be applied to more NYSE stocks while the faster blue version is applied to the NASDAQ network stocks as a general rule-obviously the call out NYSE method is no where nearly as fast as trade on the computer network of the NASDAQ).

The IWM 1 min shows a slight negative divergence.

 The 5 min is leading positive, this is like rock, paper, scissors with the 1 min being paper and the 5 min being scissors.

 QQQ 1 min with a lading negative intraday divergence

 The 5 min lading positive to a new high.

One other thing to mention, accumulation generally comes in an environment of declining prices and flat trade ranges, why would smart money want to buy in to strength? So these dips intraday are also most likely utilitarian.

 SPY 1 min

No sign of anything negative on the 3 min.

So this doesn't look to be an important divergence, just a nuisance.

Intraday Consolidation or pullback

Seems to be setting up, doesn't look like anything major, but they've got to keep everyone on their toes and guessing. Charts coming.

Adding BIDU Calls

I'm actually going to add to the BIDU call position using August $110, it's a very small position as I don't want to get in deeper than the original speculative position. I'm not adding this as a way to average down, I like the charts here and usually would have used a longer dated option (even for short term trades), I view the $112.75 area as being decisive for a BIDU momentum or short squeeze move up.


BIDU Follow Up

This is a follow up to the BIDU July 110 Calls.

Although a speculative trade, its still at a loss, but with BIDU looking the way it is here, I have no intention of closing it right now. In fact, if I didn't have a BIDU position, I would probably be considering some August Calls for a speculative, short term trade; I may still. I also still have the core short equity (no leverage) BIDU position which is up over 25%, I intend on holding that as well as those shorts were hedged with some long positions in the equities model portfolio.


Here are the charts...
 BIDU looks like many other stocks in that it looks like a bear trap set from a break below a bearish descending wedge, this is somewhat similar to last night's post, The Anatomy of a Bear Trap.

 Intraday, ROC is showing the change in momentum to the upside now.

 The 3 min chart is leading positive to a new local high.

 That has bled to the 5 min chart also leading positive

And even the 15 min chart is now leading positive.

I'm going to take a look and see if it might be worthwhile to look at some August calls, I don't want a position that's too large and violates the speculative position sizing.