Friday, December 16, 2011

Santa repellent: Moody's cuts Belgium by not 1 but 2 NOTCHES to AA3

And now it's on...., like Donkey Kong.

I didn't think it would take long after the last failed EU summit, but we are yet to hear from S&P and that's where the flood of downgrades will comes from. Belgium for their part is no longer committed to the EFSF as they have lost their AAa rating. France will likely get 2 notches and then any hope of saving the EU is out the window.

RIMM Update

I meant to get this out earlier, but the day flies by sometimes. I decided to hold RIMM as something just doesn't add up here. I checked two versions of 3C a fast and slow and both did not confirm the downside move and both actually built stronger positives today. The selling last night and premarket is retail, institutional traders aren't moving positions in the low liquidity of extended market trading and they didn't push RIMM down today at all, other then that, the market has left very few gaps unfilled recently.

I have to run out t an appointment I'm late for, but the timeframes are in the upper left hand corner and the divergences should be self explanatory.


AAPL Update, still waiting for a bounce to add

AAPL longs are almost as hardcore as gold bugs, but what they don't understand is that until the NASDAQ re-weighted the NAS 100, AAPL represented nearly 20% of the NASDAQ-100's weight, which means if you took the bottom 50 NASDAQ stocks and combined them and added AAPL and called it the NASDAQ 51, the bottom 50 stocks could be down 2% on the day, if AAPL were up 3% on the day, the NASDAQ 51 would close up 1%, that's right, the weight of AAPL was the same as the bottom 50 NASDAQ stocks combined, which explains why the Primary dealers (after making billions in each POMO operation during QE 2) flipped money in to AAPL because it was the easiest way to move the average up and create what Bernakacide called in congressional testimony, "The wealth effect" vis-a-vis the market being higher, unfortunately 8 months of consecutive outflows meant that most regular Joes weren't in the market and the true nature of the POMO arrangement was to give banks some earnings (as you may remember many banks had quarters where they didn't have a single losing trading day), you might call it a sort of bank bail-out.

In any case, frothy money from the PD's is not the same as fund accumulation which truly supports a stock, and furthermore when QE2 was coming to a close, those same PD's pulled all of their money out knowing QE3 wasn't coming and therefore wasn't going to support asset prices anymore. This also means the high flyers like AAPL have the most to lose as they sit at lofty prices, but have little underlying support left. When the market flushes, it takes everyone with it.

So back to the AAPL short, a bounce would be great to add and given AAPL's weight on the NASDAQ 100 (which is unknown now unless you pay NASDAQ $10k for their formula) which is still likely very heavy. It's little wonder that AAPL's 3C chart looks a lot like the QQQ's

 Short term it looks like the middle men are stocking up (market makers/specialists, etc)

 The 15 min is similar to the QQQ, also note the flat price environment.

 However the bigger picture shows the daily chart in a leading negative divergence, just in time for the end of QE2.

Long term, AAPL has had good confirmation, but when we eliminate the noise of PD manipulation using POMO dollars, AAPL all of the sudden appears to be in the worst spot it has ever been in. That makes for a nice short, it's just timing on the entry.

Market Update

Well I was hoping we'd get an op-ex bounce today, it seems they are looking to pin the market around $122, which is strange because there wasn't much open interest in the area. However that doesn't mean the bounce idea is over.

 The 5 min Euro is leading and accumulation almost always occurs in to a flat environment, if you think about why that is the case, it will make some sense on a few different levels.

 The 15 min, while short in duration, is still leading and again, the price environment is pretty flat,

 Here the DIA accumulates on a 2 min chart in a flat area.

 And 2 15 min divergences, one moved the market higher the more recent one is still building, again in to flat price trade.

 Look at the short term QQQ, again a flat price environment

 And the 5 min has accumulated a few times, both flat areas


The same with the QQQ 15 min chart.

The 15 min chart is powerful for a swing reversal, but there isn't a long enough divergence to suggest a move beyond a bounce. However the extent of the divergence leading upward seems to suggest they are moving fast to accumulate in to flat, stable prices. This would lead me to believe early next week we bounce.

Remember we have 1 holiday on the 26th to observe X-mas, there will be window dressing, but because of the T=3 settlement rule, the funds need to move all their positions by the 27th, tax selling can go right up to the new year. Volume will be low so expect some decent volatility.

Trade Idea-PEIX Long

This falls in to the Cats and Dogs trades, they an move fast, but they are low priced and usually low volume, which explains why they can move fast. All speculative trades like this should have strict risk management, I almost ALWAYS cut my risk money in half on these.

PEIX has had a decent fall, but if we get the bounce like I still believe we will, PEIX could see a near term pop of 30% or more easily n a few days. This would only be a trade for a market bounce, nothing more and I like to take profits on these when they hit double digit returns.

So here's PEIX and why...
 The last trade we had in PEIX coming off a bullish descending wedge made nearly 300%, the stock can move, but that cuts both ways, so this is a speculative trade and risk management MUST reflect that. Wider then normal stops need to be used, that can be accomplished by lowering position size. Or you an run a very tight stop and use a larger position size.


 The longer term X-Over Screen is still long, I don't expect it to stay that way for a lot longer, but we are only looking for a bounce trade here. It has found support at the blue 22-bar m.a. which is where it should pullback to.

 The short term charts have been supportive and went positive leading to today's 6+% gain.

 Here you see the same, after weeks of confirmation of the downtrend, we have the first positive divergence.

 The 5 min chart's positive divergence was right on track shooting PEIX up higher today.

 Even the longer term 60 min chart that showed distribution at the top before the stock rolled over has also shown confirmation of the downtrend and now we have the first positive divergence here as well.

To the left you can see my custom demark based indicator give a sell signal, this is the first hourly buy signal and right as the stock bottoms and finds some support.

Again, this isn't a buy and hold, but the cats and dogs trades often pop off right before the market crashes lower. It's worth a look on a speculative trade basis.

GLD Bounce may set up a long position in DZZ (Short Gold)

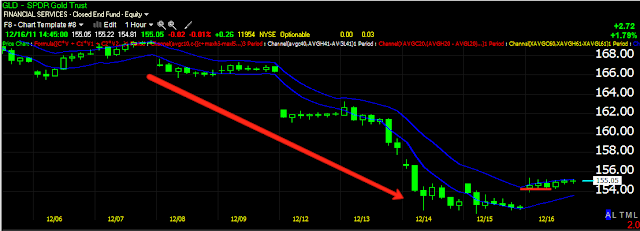
We have been watching a big triangle in GLD and unusual volatility, I have said this is either a bubble or an intermediate top, but my expectations were for GLD to break down, which it did. What we know is that major breaks often see volatile counter trend moves shortly thereafter, after that counter trend move, that's where we want to look to short an issue like GLD, we don't want to get caught up in the counter trend volatility unless you want to run a quick leveraged long position for such a move.


Here's the GLD Update
 The short term charts were positive showing short term accumulation before GLD moved higher.

 You can see the same on this 5 min chart, this is what appears to be the start of the volatility based, counter trend move since GLD did break down as expected.

 The 15 min chart isn't showing a huge divergence, but enough for a the kind of move I'm expecting.

 Here the 60 min Trend Channel has held the entire decline out of the triangle top, it has now broken above the top of the Trend Channel signaling a short term change in trend from down to up.

 The daily Trend Channel is solidly still short, the red area would be the stop out, the yellow area is a very bearish break away gap.

Here's the daily chart with the triangle I suspected was some sort of top and the 150 day moving average that has provided support for several years without fail, both were broken to the downside and the yellow arrow is the breakaway gap mentioned above. As usual, when an important break like this occurs, we see a counter trend move (up) usually to kiss the triangle goodbye or perhaps the moving average. So in the short term, GLD looks like it will see the counter trend bounce up, especially is the Euro rallies. At some point, we'll get negative divergences as the bounce nears the end and the shorts pile in, that's where a DZZ long may make some sense or just an outright short on GLD. You may want to consider playing a short term long trade on GLD with a leveraged long Ultra ETF, but it is short term only and you need to be quick about exiting the trade when the time comes.

Keep an eye on this one, there are a lot of longs trapped right now and the next lower low will create a snow ball effect as they start to sell at deeper losses. This is the first GLD trade I have seen in some time that makes sense.

Market ready to move to the upside....

What we have here is the SPY in green and the Euro in red. The SPY has made a "Traditional' "W" or double bottom, the reason I say traditional is this s what you see in technical analysis textbooks with the  second low slightly higher then the first, in real life now these are almost always head faked with the second low being lower then the first, drawing in shorts who will be squeezed and triggering stop orders for longs, this didn't happen today as I doubt they have the time to run such a head fake and it may not be in their interest as far as what they want to accomplish today. The Euro is higher and thus supportive to higher equity prices from this intraday base.

We'll see, but the positive divergences have at least stopped the bleeding to the downside, so there's no reason to think they won't provide upside support. The DIA/QQQ and now even the SPY are all looking better on the short term charts

Euro update

The short term FXE/Euro charts look sloppy today, but there's still a decent positive divergence suggesting the Euro is not ready to give up $1.30 just yet.

 The 1 min chart with a negative divergence and an overall sloppy trend

 The 2 min chart going negative at the highs today and sending it lower.

 The 5 min is in line which is an improvement.

 Close up the 15 min seems to be in line too, but zoom out a bit and this is what appears to be the Euro still getting prepped for a bounce.

Note the leading positive condition here, this should still send the Euro higher, so we may very well get our chance. I've had a lot of emails asking if w should add to shorts today, my gut feel is that we need to be  a little more patient and wait for this 15 min chart's implications to resolve. I'd rather add on a break then add here and then have a pop in the market that puts your positions underwater, even if the longer term trend suggests you are right to add to the shorts, why suffer through draw-down?

Corzine may have been right on his bets at MF Global, it remains to be seen although I doubt it, but he didn't have the staying power to deal with the drawdown, so even if he was right, his timing ended up costing him the company. This is why I advocate some patience, you can be right on direction and still get hammered if the entry isn't timely.

The VXX-NOT the VIX, tends to confirm our market theory

The VXX is more reliable then the VIX in my opinion, it is the intraday volatility index and like the VIX, it trades inversely to the market so a strong VXX means a weak market or a strong positive divergence in the VXX means the VXX is under accumulation and should move higher, meaning the market moves lower. I hope that wasn't too confusing.

The indications on the VXX seem to follow the market theory of a bounce that can be used to short in to in the market and then a fall in the market.

Here are the full VXX charts
 The 1 min chart shows weakness in the VXX, which matches with the market positive divergences we have seen in recent updates today.

 Even though the 2 min is leading, relatively it is showing some weakness, again matching up with the markets as they should have nearly the opposite readings.

 The 5 min VXX shows a positive divergence at the lows, this is when the market started to roll this week, it is leading, but there's a little recent weakness, still it suggests any market bounce will be contained and fairly short lived.

 The 15 min chart is much more bullish, this would be bearish for stocks.

 And the 30 min chart is very bullish for the VXX, negative for stocks, below I compare the SPY 30 min so you can see the inverse correlation.

 SPY 30 min is leading negative and looks very bearish for stocks. The 30-60 min charts are more the trend of the market, not short term counter trend moves, so this indicates a bearish trend as the top in the SPY/Market rolls over. At some point that roll hits critical mass with longs trapped, they start selling and we get the snowball effect on the downside which can be a sharp decline. The EU downgrades and the pace they are coming in won't help the trend in equities.

Finally the VXX 60 min is leading positive on the VXX pullback, this again is bearish for equities. Now if we can just get a short term bounce to get good short positioning, all the pieces are lining up. Unfortunately the end of year not only has a lot of window dressing from funds, tax selling, etc, but volume is typically low, which makes all the moves in the market that much more volatile.

Market Update

ES which has been very reliable, continues to move higher and the DIA and QQQ have seen the 1 min divergence strengthen and migrate to some 2 min charts

 Here the DIA 2 min almost perfectly called the bottom with a positive divergence and is leading higher.

 ES is also seeing the leading positive move higher from the last update.

 QQQ 1 min also almost perfectly called the bottom with short term intraday accumulation running right in to the lows.

The 2 min chart is starting to see some of the 1 min chart strength migrate to the longer timeframe, but still intraday timeframes.

The SPY remains pretty much in line with price.

Risk/Credit Basket

 Commodities are holding up a little better then equities today.

 The sell off in Yields was pretty extreme, as I have been saying, the market gravitates toward yields and now they are nearly tick for tick, except on a longer time frame, then there's still a lot of equity downside to catch up.

 The Euro is slightly stronger then the S&P

Look at this move up in High Yield Corporate bonds, it appears I wasn't the only one looking for a bounce in the Euro/market today.

Let's see if this latest divergence gets us anywhere. There was so little open interest this month that they may be trying to create some profits where very few existed prior to today.