Monday, May 4, 2015

Daily Wrap

The gist of last week's forecast and Friday's "Week Ahead " forecast was,

"I expect next week, at least early on, we'll continue to see a bounce.Make no mistake though, this market is BADLY damaged, I'd think by mid next week we'll be turning to the downside and making a lower low"

When I say by mid-week, I don't mean we'll be making a lower low by mid-week, but the bounce should lose momentum somewhere around there and typically we'd expect a couple of days of reversal process. However I noted several times today a "gut feeling", not backed by objective evidence, that we may see a sharper "V" shaped turn to the downside. As you know I don't typically expect sharp reversals or reversal events, rather I expect a reversal process, but something doesn't feel right about this market the second day in to the bounce.

Europe was closed Friday and volume was low, this week Japan is closed until Thursday (the Golden Week holiday) and the UK was closed today for May Day. Volume was even lighter today than Friday.

On the day small caps led +0.42% (you may recall last week I mentioned their underlying trade / divergences looked better than the other averages) and the NDX lagged , barely closing green at +0.08%. The SPX and Dow were around the same at+0.29%/+0.26%.

On the day the major averages looked like this...
 The NDX is in blue, Transports in salmon and the R2K in yellow.

This is what intraday breadth looked like via our custom NYSE TICK/SPY Indicator...
Thursday's expected stop-run/capitulation is seen at the large red histogram, Friday was rather flat, but improved, today lost ground and saw worse breadth.

All of the averages closed with something akin to a bearish "Shooting Star" on the daily chart like this SPX...
Daily SPX with the large triangle, the head fake / false breakouts last week, Friday's strong close (but weak volume) and today's "Shooting Star-like" candles with longer upper wicks indicating higher prices were tested ad rejected.

The $USD was one of the first assets to give us a clue we'd be looking at a (short term) bounce which started Friday, but the $USDX barely moved today despite some Euro weakness. Thus the USD/JPY was essentially flat on the day as well.

The divergence for a counter trend bounce in the $USD is still there and I don't see any good reason why it shouldn't bounce. 
 10 min $USDX futures positive divergence and a base.

The 10 min negative divergence in the Euro should certainly be of some help.

As to the Yen, it's mostly in line with recent weakness so I don't expect any major changes there very soon (next couple of days), thus the USD/JPY "should" bounce and give the market some support.

It's the VIX short term Futures as shown earlier today, VIX, VIX Futures, VXX, UVXY, XIV and last week that are really raising my eyebrow, they closed green today despite all of the averages closing green.

I also noticed on a very short term intraday basis, not a huge signal yet, the Index futures that had something in the way of gains to sell in to had the divergences showing that selling in to higher prices...

 ES 1 min showed early distribution in to opening gains(SPX closed +0.29%).

 NQ/NASDAQ 100 in line, no distribution signals (NDX closed +0.08%) so there really wasn't much to sell in to in the way of higher prices.

However TF/Russell 2000 futures saw the strongest negative divergence on the day (intraday 1 min).

And as for VIX futures, look at the accumulation of the dip with VXX outperforming the normal market correlation by a wide margin, even closing green today...

 SPX in green is inverted so you can better see the relative performance, normally the two would travel almost in perfect sync, but today VXX (short term VIX futures) showed strong relative performance just like last week indicative of a bid supporting the flight to protection.

 The 15 min VXX 3C chart already has a huge positive divergence, thus as soon as I see momentum fading and I believe we are close to a pivot, I'll be closing the VXX puts which are up about +.45% right now and looking at VXX calls or maybe UVXY long.

 As for the SPY 1` min intraday, distribution right on the open and very close to a leading negative divergence with the opening divergence almost lower than Friday's late afternoon. We saw some mid-day accumulation intraday for an attempt higher and that fizzled out.

Early today the 5 in chart showed no near term damage, but by the end of the day, we already had this leading negative divergence on the day. Again, it seems smart money is very quick to sell on any price strength and is maintaining a solid bid under protection (VIX related assets).

 The 10 min SPY shows some deterioration, but I believe there's still gas in the tank for something more along the lines of the bounce I was expecting late last week that started Friday. I just am not so sure we'll get a normal reversal process, as I said, I suspect we may see something a lot faster, sharper and more "V" shaped than "U" or "W" shaped (again that's a gut feeling as of now).

Thursday was the stop run we were looking for, that's when the UVXY long was closed in the afternoon (3:15) Taking UVXY long off the table and the VXX Put was opened, (3:30) Trade Idea: Extremely Speculative (Options/Puts) VXX.

I updated that position today.

 As for the Q's, they just didn't look good all day and I suspect we start tomorrow off on a weaker tone.

The IWM is the one that looks like it wants to continue to lead for now.

We'll see how fast these divergences develop, but you know my gut feeling for now.

Treasuries are selling off and yields are rising, normally as a leading indicator we'd take that as a positive for near term market movement as yields tend to attract equity prices toward them like a magnet...
TLT as yields rise and Treasuries sell off. Normally we'd use this as a leading indication, the problem is as mentioned last week, when the Carry Trade unwinds, bonds tend to sell-off. We have no historical precedent to compare to, but I suspect that we are seeing bonds selling on the carry trade unwind and as such, yields may not be that useful in the near future as a leading indicator. I'm still looking in to this, but bonds selling is one of the signs of the carry unwind and with USDX failing to make a higher high and moving to a lower low, it looks like the carry unwind is already in effect.

As for some other leading indicators...
 Our SPX:RUT Ratio going negative in to recent highs and failing to confirm, then confirming on the downside (white) and now failing to confirm, but moving a bit more neutral.

As to the big picture...

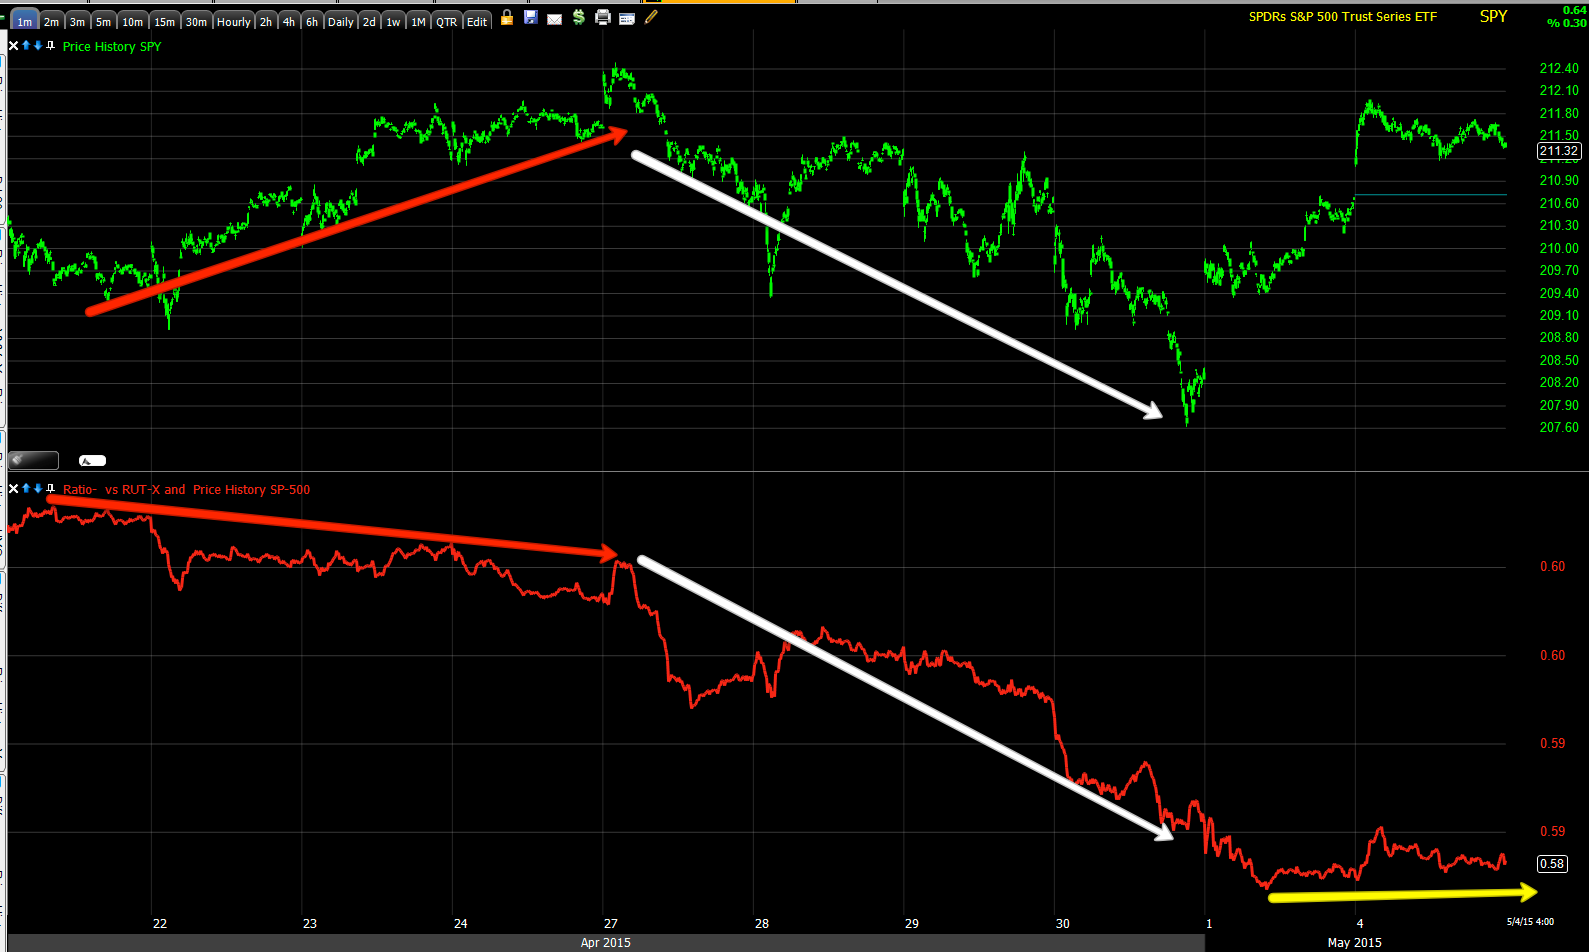
There were two "W" bases, the second is the April 2nd forecast with the positive (white) signal being part of the reason for the forecast, but in to the April trend, no confirmation and in the Yellow box, things have absolutely fallen apart. This is one of several reasons I believe we are on our way to make a lower low in the market relative to the October lows.

 High Yield Corporate Credit which has been in line is not following risk in the SPX at all, this is exactly what I expected last week and said that the SPX moving up with HYG continuing to lose ground would create a larger leading negative divergence...


And from a relative negative to what is now a leading negative, it was only 2 days and we have this much large leading indication (negative). "Credit leads, stocks follow."

As for internals today, there wasn't much of a Dominant Price/Volume Relationship so I don't think we are at an area in which this bounce is done. The closest thing was the SPX with 221 stocks and the  Dow with 13, both Close Up/Volume Down, which is not dominant enough to be a 1-day overbought condition, it's just reflecting the poor tone in the market.

As for S&P sectors, 7 of 9 closed green with Financials leading at +.99% and Materials lagging at -0.27%. Again not enough to create any next day movement.

Of the 238 Morningstar groups we track, 167 of 238 were green, again in line with a bounce, but not close to an overbought situation.

For now I'm sticking with the "bounce" theme early in to this week, I don't see a reason to abandon it yet, but I suspect some early weakness tomorrow morning based on the way the 3C charts closed intraday. From there we may get a helping hand higher from the $USD as suspected last week.

The 10 min ES chart I believe is telling (SPX E-mini futures)...

We see the distribution at last week's highs. Then the accumulation in to Thursday's stop run, BUT REMEMBER HOW I SAID THAT THERE WAS A RESPECTABLE DIVERGENCE ON RESPECTABLE TIMEFRAMES FOR A BOUNCE, BUT A VERY NARROW BASE THAT LIKELY WON'T OFFER GOOD SUPPORT FOR VERY LONG?

Well there it is and we already see some damage today (distribution) or rather since Friday, not enough to call a pivot to the downside, but this is part of the reason I suspect this bounce could fail quickly.

We still should see a $USD counter trend bounce and that may help to offer more support, but in the end it will make a lower low and the carry unwind will start to snowball in my opinion.

 Since our April 2nd forecast for the $USD (not the April 2nd market forecast-two different posts), I expected a bounce (green arrow)m followed by a much larger move down (red arrows). At the yellow base and arrow we have a counter trend bounce, nothing unusual and you saw the 10 min $USD positive divergence above, that should build the next "yellow" counter trend bounce and the market should be fairly well correlated to it, but all in all, it ends and makes a new lower low.

On the daily chart you really see why the $USD is getting to be so important right now beyond the F_E_D and rate hikes...
At #1 3C distribution at the high. At #2 our forecasted bounce and failure to make a higher high for the first time in the primary trend and at #3 a lower closing low. At #4 the $USD intraday lows and the area of support I thought would back up this/current bounce attempt. However after it is done, I expect a new lower intraday and closing low, the carry unwind should accelerate, the F_E_D won't be worried about raising rates because of the strong dollar and of course all of this will have a dramatic effect on risk assets.

I'll check Futures again before turning in and will likely update a few of the major pairs tomorrow as well as some requests I received today, but for now I don't see any change and expect a near term bounce to continue in to this week.


USO Update

USO has been one stubborn nut to crack. To be clear, I LOVE USO long on a primary trend basis, it has spent all of 2015 putting together a respectable base that should be able to hold a primary trend reversal.

However sitting right at the base's resistance area....
USO Daily chart/base with resistance (yellow) and sitting there on a divergence like this...

60 min (very strong timeframe of underlying money flow-3C) with only a small negative divergence to the far left and the rest of the trend in perfect 3C price/trend confirmation, the current leading negative divergence is vastly larger than the previous which was the push back down to the lower end of the range which created the large "W" base that's in place.

I can't see how USO could possibly have the gas in the tank needed to not only breakout to stage 2 mark up, but support that trend with such a divergent 60 min chart.

I believe one of the keys to USO breaking down this week is the $USDX. Hopefully you understand our near term and longer term $USD forecast. We are in the middle of the second trend forecast on April 2nd, the first was a bounce up which failed to make a higher high for the first time over the last year and the second trend was a "Larger" move to the downside" which is already in the books as well. We have had 1 counter trend bounce during this larger downside move and I believe near term we are on the edge of a second counter trend bounce before the $USD solidly puts in a lower low to go with that lower high to change the primary trend.

 30 min $USD with perfect 3C downtrend price/trend confirmation and a recent positive divergence from last week which was part of the reason for the $USD counter trend bounce forecast last week as well as the market bounce forecast mid-last week that started Friday.

If you look at the $USD (candlesticks) vs Crude Futures (purple line), you can see a typical, historical legacy arbitrage correlation...
 Because oil is a Dollar denominated asset, the historical legacy carb. correlation sys a lower $USD means the price of oil (and other $USD denominated assets) must rise to make up for it. In the same fashion a bounce in the $USD means lower prices in oil and $ denominated assets. The near term counter trend bounce just shown above in the $USD "should" add extra downside pressure on oil/USO to pullback, gather a head of steam and make a solid run at a breakout of the base to stage 2 mark-up.


This 30 min chart shows the inverse nature of the 2 assets because of the Dollar denominated correlation.

This 5 min chart gives you a closer view and perhaps explains why USO has been so stubborn about pulling back as the lower $USD has been supportive of oil (as well as inventory developments).

 10 min USO leading negative divergence.

 Crude Futures 7 min leading negative divergence.

 Crude futures 5 min leading negative

 USO 3 min negative

USO 2 min leading negative.

We should see USO break to the downside as the $USD breaks to the upside which I believe is likely to happen by the morning.

BABA Charts...

I've mentioned my gut feeling a couple of times today, that is that the bounce we started seeing signs of last week, I believe Wednesday and had made a clear forecast of a short term/near term bounce on Thursday (the same day VXX puts were opened), isn't likely to last beyond mid-week (typically we'd still have several days of reversal process after a high is put in or the bounce has lost all momentum), but in this case I have a gut feeling this will be a faster, more dramatic swing down.

One of the reasons I think this is because the divergence that formed indicating a bounce, did so on some fairly respectable timeframes, but did so in a very narrow slice of time. In other words the broad, wide base that can support an extended move just as if you were building a tower, the broader your base the higher and more stable you can build it. is just not there.

In addition to this being part of my gut feeling we get a faster, sharped than normal downside reversal off the bounce, it also looks to me like the market or the pro-side participants know that they don't have much time to get off any upside moves, which may preclude BABA from a head fake / stop run move being it's already lagging the start of the bounce.

However the final decision was based entirely on the charts, everything else above is after the fact opinion.

 Tje 1 min intraday chart is the one I would have expected to see an intraday divergence (negative) on if BABA was getting ready to make a stop run below the $80.10 (support) or $80 ()psychological magnet) level. Instead it has just improved all afternoon like the SPY/QQQ intraday charts I just posted in Holding VXX Puts for Now

You can see a very clear leading positive divergence (remember this is a 1 min chart and as impressive as the divergence looks, the timeframe is more important as to gauging its strength, this is the fastest moving, but weakest timeframe we use-typically good for intraday signals as mentioned above.

Upon closer inspection of the same chart, this morning's intraday lows showed a positive divergence (accumulation at its intraday low. The chart hasn't showed anything all day that would suggest we see an intraday stop-run/,head fake move. As I said above, I suspect it's a lack of time.

However the alerts from the earlier Trade Set-Up: BABA post still stand. With a half size/Spec. position size, this allows room to add to the position if the trade set up I'd prefer, actually takes place.

Trade Idea: Speculative (BABA) Long/Call

I've been watching BABA's chart, it seems to me it doesn't have time to pull off the head fake move below $80 as the market looks like it's getting a very short term toe-hold again here.

I will be opening the BABA May 15th $80 call in the options tracking portfolio , but at 1/2 size or speculative. If for any reason we do get the $80 stop run, as long as the move is confirmed with short term positive divergence (accumulation of stops), I'd add the second half of BABA May 15th $80 calls.

Holding VXX Puts for Now

The VXX puts opened Thursday, Trade Idea: Extremely Speculative (Options/Puts) VXX are regaining some value lost earlier today as they went green (from about +60% to +35%).

I see some intraday signals that suggests to me that holding them for a bit longer makes sense... This does not negative anything said in the last post and may in fact lead to closing the position earlier than would normally be expected based on where the market averages are in their distribution cycle.

 SPY intraday showing the earlier negative signal I showed which was almost a t a leading negative signal and some positive divergences formed up since suggesting higher prices as already expected from last week and Friday's "Week Ahead" post which should send VXX lower, even if not as low as the correlation would suggest, that still should increase the value of the puts near term.

QQQ showing the same recent positive intraday signal in to the afternoon.

And the NYSE intraday TICK chart's improvement as well in an uptrend and approaching the +100 area.

As for VXX itself...
Here's the early positive divergence which confirms the negative divergence in SPY and QQQ at the same time as VXX hit intraday lows and SPY/QQQ hit intraday highs. Like SPY and QQQ, the afternoon signal is the exact opposite as it should be intraday with a negative suggesting lower prices near term.

This is for trade management purposes only, otherwise everything in the previous post stands.

VIX, VIX Futures, VXX, UVXY, XIV

While all of these are typically closely linked via price, the volume or second half of demand can be very different. 3C works using volume and price, therefore if there's confirmation between the multiple assets which will move similarly in price, but not necessarily in volume, there's almost always something to it and the confirmation between multiple assets in multiple timeframes is very high here.

Remember, under normal circumstances, VIX which can be thought of as an asst bought for protection, usually moves almost mirror opposite the market, when there are divergences/differences in the way they move it may be reflecting short term manipulation like slamming the VIX to lift equity prices or the VIX related assets outperforming their normal inverse correlation hinting at a strong bid under VIX assets, a strong bid for protection against a downside move.

This is what has been very noticeable recently.

I had to pull up Leading Indicators to get some VIX/SPX charts I needed so I grabbed a few Leading Indicator charts while I was in the layout which also show an intensified move toward leading indicators with increased negative signals along the lines of VIX assets with increased positive signals.

Just to tell you why I think this is important, it's not just position management for VIX PUTS, which have already lost quite a bit of value today because they did not move down as their relationship vs the market would normally dictate, thus a bid for protection.

Leading Indicators
 Our SPX:RUT Ratio went positive twice at the white arrows and white trendiness at price, both bases (the second one from the left is the April base), but instead of confirming the upside move, the indicator diverged and since the yellow trendily, has picked up downside ROC to an extreme degree. There's no confirmation here whatsoever, in fact the worst leading signal you could have for this indicator suggesting BROAD market weakness.


 Friday I mentioned that if we saw price in the market /SPX (green) move up and HYG (High Yield Corp. Credit) move down, we'd have a bigger, stronger Leading Negative signal in HY Credit, that is exactly what has happened today and on looking at a bigger picture view...

 HYG first went negative by refusing to make higher highs with the SPX (green) at the red arrow, but now it is flat out leading the market lower, this is what I hoped to see when I said I thought we'd see a bounce which started Friday,

Still Leading Indicators, but now all VIX Assets...
 The easiest way for me to show you what the normal correlation between the SPX (green) and VXX (short term VIX futures) in blue is to invert one or the other as under normal circumstances they trade mirror opposite and it is more difficult to see differences in relative price performance so I inverted the SPX prices (green). To the far left you can see a more "normal" correlation where the two are moving together (in reality this would mean they are moving exactly opposite each other). Today however you can see that VXX is not only out-performing the SPX (has a strong bid under it), but it actually went green on the day while the SPX was green as well, it should have been red if the SPX was green.


This is what the chart would look like if I didn't invert the SPX prices, it's not as easy to see the differences in performance, but even here you can see VXX has moved above Friday's close (red arrow and small blue trend-line). And this while the SPX was still above its close Friday-remember the normal mirror opposite relationship.

Even Spot VIX is outperforming the SPX correlation.

As for actual VIX futures (not ETFs)...
 Again intraday today like last week, VIX futures have a positive divergence earlier as price moved down and 3C up to the left and a stronger leading positive divergence as VIX futures hit their intraday low for the new week.

 This is the VIX futures 30 min chart which has shown numerous positive divergence over the last 2 weeks in many timeframes and they are accruing in a leading positive divergence on a strong 30 min 3C chart which is highly unusual for VIX futures to show (divergences this far out).

This is multiple timeframe/Multiple asset confirmation. You'll see VXX (VIX short term futures), UVXY (2x leveraged VIX short term futures which should show the same or similar 3C signals for confirmation) and you'll see XIV which is the exact opposite of VXX, Inverse VIX short term futures or Inverse VXX, for confirmation, XIV should show the exact opposite signal compared to VXX or UVXY.


 VXX 1 min with a strong signal of accumulation today, likely the reason they did not move down as normal and even moved in to the green. We saw this last week too.

 1 min XIV showing distribution at it's highs this a.m. (same time as VXX's intraday lows). Confirmed.


VXX 3 min with a strong leading positive divergence with an exceptional move today showing strong accumulation.

 3 min XIV showing the exact opposite with a strong leading NEGATIVE divergence or distribution in to price highs.

VXX 5 min trend in 3C leading positive.

UVXY 5 min (2x long VXX) with an in line (trend confirmation) to the left and a leading positive divergence to the right . This is a longer chart which is why it looks a bit different.

This is 5 min XIV, the same length as UVXY above, showing the same confirmation of the trend previous to the most recent (up) and a leading negative divergence now...CONFIRMATION.

 10 min VXX confirming the price trend at the green arrow and leading positive / accumulation at the white.

UVXY showing the same chart/signal.

XIV showing the same timeframe with the opposite signal CONFIRMATION.

VXX on an extremely long 60 min chart with a negative divergence/distribution and downtrend that is confirmed until the positive divergence/accumulation to the right.

 UVXY 60 min showing the same exact thing.

And XIV 60 min with accumulation to the left (the mirror opposite of VXX/UVXY distribution on the left side of their charts) , then a relative negative DIVERGENCE and a stronger leading negative now, CONFIRMATION.

The recent movement has been so strong, my initial gut feeling is that this current market bounce we have forecasted for approx: until Wednesday, likely sees an unusual, but very fast, sharp "V" reversal to the downside. That's my take-away from the recent changes in character and the much more extreme accumulation/distribution signals. It looks like someone with deep pockets knows this most recent bounce is subterfuge, a facade and when it fails, it fails bad which I have already said I fully expect to see a new lower low in price made and with the $USD also turning to a new lower low. These are different assets, but have a high degree of influence on each other right now for reasons I have gone in to recently. The net result should be they create a self-reinforcing, cascading snow ball effect.