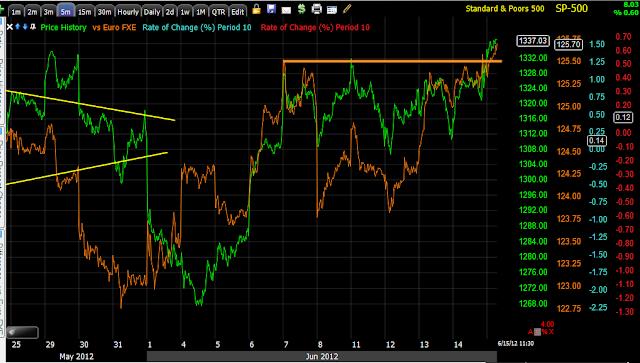
Friday, June 15, 2012

On China-FXI/FXP

I've been meaning to get to these charts for a member, so here they are. FXI is the China 25 ETF (long), FXP is the China 25 ETF short. Like the market with the primary trend (ugly) and the sub-intermediate trend (bullish), I'm going to try to cover both here.

 First FXI-basically long China. This is a daily chart, it is more of the primary trend or big picture, it has gone very negative around the Feb. highs and is leading negative, so the big picture doesn't look good, but even during the 1929 Crash and Depression, there were at least 5 counter trend rallies so nothing goes straight up or down.

 A weekly chart of FXI (basically long the China 25), it really hasn't done much compared to the SPX since 2009, but then again they didn't have QE1/QE2, recently it looks to be breaking down as their #1 trade partner (Europe) is on the ropes.

 This is FXI daily (still the long China 25) seeing a little change in character lately from a downtrend that has been in effect since Feb. 2012. This looks a lot like a sub-intermediate trend base, a place FXI can stage a counter trend rally from.

And here's the 60 min chart of that same area to the right where there's a 3C leading positive divergence (very similar to the market averages), suggesting FXI wants to break out of this base and move higher (again similar to the US averages).


 This is FXP, basically the short version of the ETF (short the China 25). You may recall many examples of wedge patterns we have been watching; to the left is a bullish descending wedge. According to technical analysis, once price reaches the apex of the wedge, it should break out to the upside and the general rule of thumb for the target is, "Wedges retrace their base", suggesting a target of  $50 or so. However as we have been documenting in both bullish descending wedges and bearish ascending wedges, this isn't what happens; often there's an initial false move in the direction traders expect, but more often than not (80+% of the time), we see price move in the opposite direction and move laterally in a base or in the case of a bearish ascending wedge, a top, then the move that was originally expected finally plays out as we see FXP finally did break out and move higher. Again, this is the primary trend, FXP higher (short China 25). However again, nothing moves in a straight line.

 Here's the daily chart or primary trend for the FXP (short China 25) as it went negative at the Sept. top and headed down in the wedge pattern, then 3C went positive, FXP broke out and we have a strong daily leading positive divergence. So if I'm investing in the primary trend, I want to be short the China 25 by buying FXP above. However in the near term (sub-intermediate trend) there's a different opportunity.

As FXP has gained ground, 3C has gone negative on the 60 min chart, this is more in line with the sub-intermediate trend and suggest FXP is going to lose some ground before heading higher in the primary trend.

So to sum it up as I know this may be a little confusing, the long term primary trend looks bad for China, thus we want to consider buying FXP or shorting China via other assets for the primary trend, but in the near term (sub-intermediate trend), FXP looks like it will pullback, which means FXI (China 25 long) should gain some ground as it breaks out of the base it is in.

 Even as FXP (China 25 short) has been pulling back, the short term 2 min intraday 3C chart shows a positive divergence, this may be our opportunity to get in on the sub-intermediate trend action and when the time comes, get back in the primary trend action at much better prices with much less risk. Should FXP bounce over the next several days as it looks set to do, FXI will pull back and FXI is what we would want to buy to play the near term move up.

The X-Over Screen to avoid false crossovers is just about perfect for the timing of a sub-intermediate move, so I'll use this to define possible entries long FXI.
 Here's the sub-intermediate trend base in FXI, we are looking for a break out here and all of the indicators are moving in that direction. In the price window is a yellow 10-day m.a. and a blue 22 day ma.a, a pullback toward those moving averages in to the small gap created today looks to be a decent entry in FXI long. The other way to play this is to wait for the breakout to the upside above the red trendline, it's not as good of an entry, but you have better probabilities. If we see the short squeeze in the Euro as we expect, China should rally with the US markets.

This is FXP, China 25 short (inverse ETF).
 We are seeing confirmation in the signals here, if I were looking to short FXP (which there is no need as you can just buy FXI), I'd be looking for a little bounce toward the moving averages.

If you are interested in the trade (I know several of you are), just email me any time and we'll see where things stand, however please remember that like the speculative long positions we have for a bounce in the market or short squeeze, this trade should also be considered speculative as it is the sub-intermediate trend which is basically a counter trend rally from the primary trend.


Quick Market Overview...

 First the intraday chart-the DIA 1 min never looked that bad to start with, pretty much in line all day

 The 3 min chart opened negative and kind of drifted around until 1 pm when more stories about rate cuts started coming out, you can see the improvement since 1 p.m, that's pretty much the central theme of today.

 The IWM 1 min looked the worst on the 1 min, it opened negative, it headed lower right in to 1 p.m. when it started improving.

 The QQQ 3 min opened negative, didn't do much, then at 1 pm again we see improvement.

 The same for the SPY, negative in the morning, the story about the ECB rate cut comes out around 1 p.m. and improvement.

Lets not forget the area we have been watching for a breakout above in the Euro, this is the level in which shorts are getting nervous and the level which a short squeeze becomes much more likely, it almost looks like we were seeing some of that in today's afternoon action in stocks.

 The area in the Euro that we've been watching since the start of June, finally broken and as of now, looking like a solid break.

 Intraday, can you guess what time that move above resistance at the green arrow occurred? If you said 1 p.m., around the time the ECB dovish comments came out, you'd be correct.

The SPY intraday vs the Euro, at 1 p.m. there's a little volume spike. The Euro had a bit more momentum than the SPY as it seems the SPY was trying to resist on an op-ex pin , which by the way we closed at $134.10, a few cents off the high end of the pin guestimate.

 And now it seems to be up to the voters of Greece, however, the charts that have had me interested and the reason I picked up leveraged longs, are these below, all suggesting we are going to see some upside/short squeeze on a counter trend move that could be quite impressive. When we see these develop we can only guess as to why, in retrospect, I'm guessing that there have been talks and plans between the Central banks with regard to the outcome of the Greek elections, this of course would be insider information Wall St. would be privy to (you may have seen the story today about the GS trader found guilty of insider trading-it's kind of a laugh as it happens everyday, but I suppose they need to look like they are doing their job every once in a while).

 SPY 60 min leading positive, especially in the consolidation of the last 7 days.

 The same in the DIA

 The same in the QQQ

And the IWM.

Lets not forget about these two charts...
 The Euro leading positive divergence and the $USD leading negative divergence. Back at the end of May there didn't seem to be any good reason for the Euro to rally, 3C was telling us something different, we may not have known why, but as I mention from time to time, when in doubt, check the longer term charts; they gave the signal while the Euro was still down and the Euro has thus far done what 3C has been telling us to expect.

We'll see what Greece brings...

Still looks like a struggle to pin options

I'd say today's action looks like a struggle to pin options, the SPY just below $134, even at $134 the $134's are virtually useless unless you exercised them and there doesn't seem to be much point.

It looks like there's been just about enough Carrot dangling to keep the market feeling "OK" about the Greek elections, if things go toward Syriza and a possible if not probable Greek exit, there have been enough "ambiguous" comments about Central banks action which is what bulls in the market want, but there hasn't been any firm commitment from the banks, although I suspect they'd do whatever they have to on a Syriza win which would likely take the entire EU financial sector down should they come to power and exit the Eurozone.

So there seems to be a struggle to keep a lid on Central Bank easing enthusiasm just enough to get today's pin off.

I still like the 30-60 min charts that are very positive for the sub-intermediate trend (what I'm trying to define with that is a trend longer than a few weeks, but probably not game changing) and have kept the leveraged long hedge positions in place. It looks very likely we'll see a Euro short squeeze and with that the market sees a short squeeze.

There's simply no way to predict how many different ways this (results from the Greek election) could go down. There's the overall trend that develops and then there's likely huge volatility with swings from one day to the next over the coming week.

However as mentioned, I still like the original game plan, holding the long term shorts that are in the green with the leveraged longs that could not only make a few extra bucks, but also hedge out some of the upside risk to core shorts. The EU is in a situation where a black swan could come just about any day, that's the reason I prefer to hold the core short positions rather than trade around them (as I would usually do).

Just having taken a quick look, the pesky High Yield Credit has stabilized today, it's not looking great, but better than earlier.

I'm going to try to get some charts on China up next.


As suspected... More Central Bank Chatter

Whether rumors, fact or a little of each, there's an obvious concerted effort to try to immunize the market from an "unfavorable" Greek election result as well as try to repair some of the damage done to Spain from last weekend's Spanish Banking Bailout dud.

Around 1:00 today the ECB which has been sitting on the sidelines, is said to be considering a rate cut.


  • ECB MAJORITY SAID TO OVERCOME CONCERN ON CUTTING DEPOSIT RATE.
  • ECB POLICY MAKERS HAVE OVERCOME A KEY CONCERN ABOUT TAKING THE BECHMARK RATE BELOW 1%
Additionally...

More from Bloomberg:
  • Likelihood that such a move would also involve cutting rate the ECB pays banks on overnight deposits from 0.25% is no longer an obstacle for a majority of Governing Council
  • NOTE: Deposit rate traditionally moves in tandem with benchmark; policy makers have been reluctant to take it to zero out of concern it would discourage interbank lending
  • A rate cut isn’t certain, the officials said
  • ECB spokeswoman declines to comment

If it isn't obvious already, the EU is scared to death of the Greek election results.


USO Update

 Going back through some history, at point "A" I was bearish on USO, there were numerous provocative actions taken by Iran during this time period and oil just couldn't gain on the event risk and 3C wasn't looking good at all, at point "B" we finally started to see some downtrending action. Just before  point "C", USO broke out above the channel, at the time the financial media said it was because of the Iranian situation, but the situation was much worse at point A than the breakout, this in my mind was a clear shakeout/head fake move as they tend to always occur before a major reversal in trend (major is relative to the timeframe) and as I expected and 3C was showing, it was a head fake move that  sucked in longs and created the downside momentum once the longs were trapped at a loss, you can think of that area before point "C" as a bear trap and you can see the momentum it created to the downside.


 Now there's a change in character in the price trend, as I have pointed out many times in the past, a bullish candlestick with a large volume spike often is a sign that the trend is about to change (as seen at the white arrow). Remember there are 3 trends, up, down and sideways.

 Looking at a 60 min chart, the price pattern is clear, it is a bearish descending triangle (consolidation/continuation pattern). Note the false break down at the yellow arrow that locked shorts in as they thought the downside trend was resuming. Technical traders will read this as a bearish price pattern and will short it, but as we so often see, technical price patterns that have a strong inherent bias such as a descending triangle (especially forming after a downtrend) often are manipulated or shaken out. I still think the bigger picture in USO is very bearish, but to help downside momentum in the primary trend, another upside head fake move like we saw on the daily chart above before point 'c' will help the primary trend's downside momentum. In the mean time, USO looks to be offering a speculative (because it is a counter trend move -potentially) long trade.

 The 60 min chart is leading positive, compare to the $USD below...

 The $USD is leading negative on the 60 min. and oil and the $USD have an inverse correlation, the $USD moves down and oil moves up or vice-versa. So the sub-intermediate trend (longer than a swing trade, but not a major move up) in 3C on both assets are in line with a move higher in oil, which is also in line with the manipulation of these common technical price patterns.

 The 5 min trend of USO, there are divergences, but I just wanted to focus on the overall trend, you can clearly see a change in character recently in 3C.

The strong had fake moves to the downside have all seen positive divergences. The point is, a strong move down creates selling on volume, which allows pros to pick up shares on the cheap and in size.


 Near term it looks like USO is getting ready, I wouldn't say it's a screaming long yet, but appears to be closer to a breakout above the bearish price pattern, it is likely waiting to see what will happen with the EUR/USD pair after the weekend. As we also commonly see, a downside move below the triangle with a 3C positive divergence (the head fake/momentum concept which applies to every timeframe), is quite likely, so if you see a move below the $31 area and are interested in the trade, you may want to email me to make sure there's accumulation in to the move, verifying it is a head fake move as this would offer the best entry. Otherwise, a break above the $31 area will be a shakeout move above the bearish triangle.

Here's the recent Trend Channel it shows $32.50 as a major change in character.

FB Update

 FB July $25 Calls up 28.57%


 FB 1 min intraday negative divergence.

 2 min intraday negative divergence

 5 min negative divergence. These suggest a consolidation at minimum and more likely a pullback like we saw earlier in the week. My guestimate for a pullback target based SOLEY on FB trade as I can't discount what happens with Greece or Central banks, would be somewhere around the $27.75-$28 area.

 The longer term FB charts remain very positive and suggest quite a bit more upside, this is the 15 min.

 The 30 min leading positive as well...

And the 60 min with a different zoom so you can see where 3C is now compared to when FB first started trading.

All in all I still like FB a lot, if the position was a long equity position I probably would have just held it, but with options I prefer to take profits at the first sight of a potential pullback.

Taking profits in FB July 25 Calls

I'll post the charts coming up next, there's a profit in the calls, an intraday negative divergence. I still think FB has quite a bit more upside, but I'd rather take the profit and hope to re-position on a pullback.

Full SPY Update and more evidence of de-risking

First, more evidence of what appears to be (makes perfect sense) an attempt to lower risk in front of the Greek elections. One way is to sell long positions or risk on positions, another way is hedging the long risk, we may be seeing this (it's too early to tell) as an alternative to out-right selling of risk in an attempt to keep the SPY pin (between $133-$134) as outright selling may lower prices which may mess up the options expiration max pain pin-but that's just a guess; it also could be a bit of both.

 Above is the SPY (green) vs TLT , the long term treasury ETF (white). As you can see treasuries historically are a risk off trade or a flight to safety.

 Interestingly this morning as the SPY inched higher in a triangle consolidation (more on that next chart), TLT moved up with the SPY which is against its normal inverse correlation demonstrated on th chart above. This would suggest there is a flight to safety, but as both were moving in the same direction (up) earlier, it looks more like a hedge. This could be a simple hedge in front of the Greek elections or it could be as to not effect the options expiration pin (the $133 to just below $134 is a best guess obviously based on yesterday's closing open interest in the SPY).

 As for the triangle that developed this morning, technical analysis would read this symmetrical triangle which on its own has no inherent bias, as a consolidation/continuation pattern as the triangle's bias is determined by the preceding trend which was up. In typical Wall Street abuse of technical traders (it is technical trader's fault for doing the same thing they've done for 100 years-Wall Street just takes advantage of their predictability), the triangle which would be expected by traders to break to the upside, is seeing a move to the downside. Watch the $133 level, it seems to be the level where an op-ex pin would be most likely. That being said, there isn't the same open interest that we saw last month so there's not as much profit in a pin and if the perceived down-side risks are greater than the profit potential of the pin, we certainly could see the market leak off in more volatile fashion.

 The SPY 1 min chart negative on the open, but leading negative in the triangle and price has already responded.

 The 2 min chart confirming the 1 min.

 The downside 3C momentum starts to fade at the 3 min chart.

 The 5 min chart is in line with price, no negative divergence, so it appears that as of now, the negative divergence isn't that strong, it may change, but for now my take is that there's some adjusting of risk, but overall it doesn't appear to be an important inflection point in the market.

 The hourly chart a shown yesterday has been leading positive since this consolidation (which is probably largely driven by the Greek elections). As I mentioned yesterday, this 60 min positive is now starting to move the 1 day chart.

The 1 day chart showing tops in the SPY and confirmation of the downside, remember we expected/expect a short squeeze bounce, but the primary trend or larger picture is very bearish. I would not call this a significant positive divergence, I wouldn't even really call it a positive divergence, but the fact the 60 min is strong enough to bleed through and effect the 1 day chart is worth noting.

More updates coming...

Quick Market update

All of the averages except for the DIA are showing negative divergences on the short term charts ranging from a normal negative to an extreme leading negative. The IWM looks the worst. The divergences seem to be contained at the 3 min chart.

I have to reset some systems to upload charts, so I'll be back with charts in about 10 mins.

Risk Asset Update

This is where my primary interest is this morning, to describe the update in one word, "de-leveraging", obviously in front of a wild card, the Greek elections. Wall St. likely has no inside information, remember the last Greek elections surprised Wall Street.

Taking one look at the indicators the first thought is deterioration in many, but you can't look at them out of context of events and in context of events, it looks like smart money is lowering risk in front of the wild card event or de-leveraging.

 The CONTEXT (for ES) and sector rotation charts alone I believe show this to be the case. CONTEXT is constructed by using multiple asset classes that have correlation to risk, you can see clearly the model is much lower than ES, which indicates to me a broad sell-off in risk assets in an attempt to lower risk exposure in front of the Greek elections.

 High Yield Corp. Credit is still looking good.

 Longer term it is hitting new local highs and leading the SPX, but it is also at the top of the daily downtrend channel, so it is in a sticky spot in which it could reverse if it is to stay in that downtrend channel that has been there most of the year.


 Commodities are up a bit and above the channel I mentioned yesterday, this looks like pure FX arbitrage trade.

 This is the one that I didn't want to see, High Yield credit deteriorating more-High Yield Corp. Credit above is contradicting HY, but HY is a true risk asset and it seems this is being sold off to lower risk exposure, there is still the question of the trend and whether this sell off is just de-leveraging risk on an uncertain event or if there's something more to it.

 Longer term, there's now a very clear negative divergence with the SPX, yet High Yield Corp. credit continues to contradict HY credit. Again, this may be because HYC credit is simply moving within the downtrend channel and now has reached the top of that channel so what happens there in the next few days will be telling, but I suspect other information that develops over th weekend will make any information on HYC credit look minuscule.

 Yields have also dropped off hard today, Yields tend to attract stock prices, but this series has been volatile lately and again this likely has a lot to do with broad de-leveraging in front of the weekend election.

 Longer term Yields are now also negatively divergence with the SPX.

 The $AUD looks good, this is the mixed bag part...

 Longer term $AUD as a leading indicator looks in line, maybe a bit better.

 The Euro intraday

 And longer term , we are near that short squeeze area, but again the uncertainty oer this weekend is the primary driver in trade today, apparently even more so than quadruple witching options expiration.


 This is the HYC credit daily downtrend channel I mentioned.

This sector rotation chart (shows relative momentum of sectors vs the SPX) alone shows the broad de-leveraging, note that not even the safe haven assets are in play, it seems any type of risk is being sold, at least to some extent to lower the risk profile, this shows how uncertain smart money is feeling right now and that is the theme of the day.