Thursday, October 20, 2011

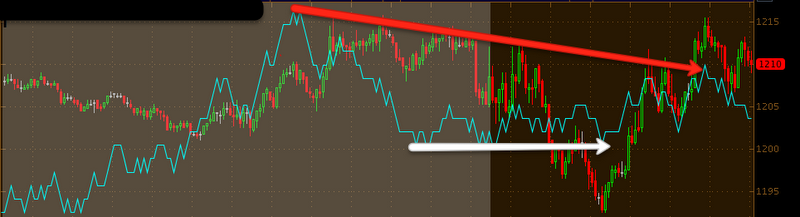
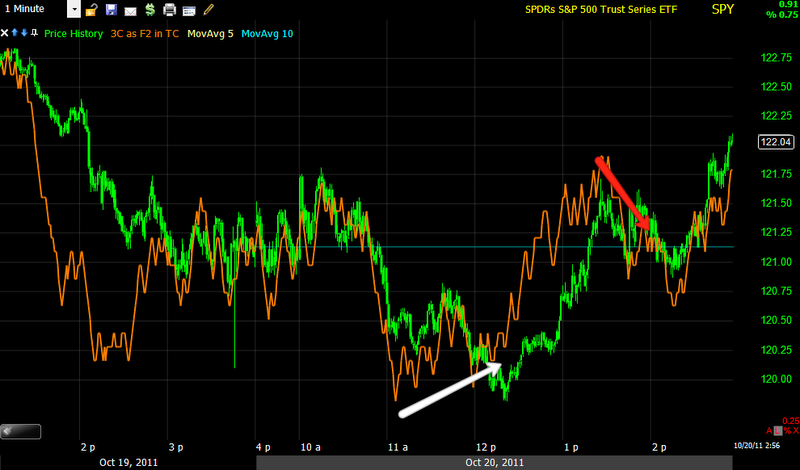
 ES EOD 1 min 3C did a good job of identifying the intraday bounce off the lows, as was posted in an SPY update there was the start of a negative divergence once the bounce got under way, that is reflected in this chart as well at the red square, which led to a slight pullback within the bounce and then a positive divergence (second white arrow) that finished the bounce up. There's a red arrow at the far right, but actually 3C is more in line there.

 This is the 5 min ES (I've noticed divergences in ES are more powerful, a 5 min divergence is probably more like a 10 min divergence in regular hours on something like the SPY.)  We have two relative price points that are the same, one from very early this morning, probably around 5 or 6 a.m. and the intraday high during regular hours. There's a negative divergence between the 2 points, so that's a relative negative divergence and it's probably somewhat meaningful being it went negative during regular hours when the ES volume is much higher, so that would be a stronger signal of distribution given the much heavier volume.

This is the 15 min ES (probably closer to a 30 min chart in the regular market on something like the SPY).Again there's a negative divergence in regular hours at the same 2 relative price points, so once again, distribution during regular hours when the volume is running much higher is a significant point to keep in mind. So what this shows us is a bounce during regular hours that was used for distribution, which as I pointed out last night can be selling or short selling as both actions register as a sale on the tape.

Market action during Op-Ex week (tomorrow) is usually choppy on it's own, we also have what I would call a top, which is almost always choppy and volatile. It can be helpful to use some technical tools to keep focused on the trend rather then the intraday or day to day chop.
Here's a simple moving average on a 60 min chart of the SPY, which reminds me of a saying, "The trend is your friend until it starts to bend at the end". Clearly the moving average depicted an uptrend which is easy enough, but now when the market is choppy, it is showing more of a lateral trend. If you remember my article about the SPY and the accumulation that it accrued during the 10+ week trading range, it made it very easy for the market to turn up in to this rally, very quickly in a "V" bottom. If you understood that article, then you probably understand that it was a lot of shares to be distributed and to start a short position, there would have been no accrual of shares short, meaning it would take more time and a lateral trending environment is often where this kind of underlying action takes place.

ADX can also be used to identify the end of a trend when it crosses above 40 and then turns back down below 40. The current reading of 18 shows a market that has no strong trend-lateral isn't considered a trend with ADX.

A Linear Regression channel is also helpful in a few ways, first it defines the break of a stable trend and secondly, there tends to be a "Kiss the channel goodbye" effect after a trend breaks and before it reverses, This is a steep channel, but the day  or hour rather, marked at the red arrow shows a move that was probably pretty close to the bottom of the channel, it also had a long upper wick on the candle (which is resistance-possibly from the LN channel) and heavy volume, which is indicative of churning-another spot distribution is often found. The opposite of churning in an accumulation area would be capitulation.

While we have several indications above that the 18th at 4 pm was a churning event, we can also look at  3C during that same period and as expected, there's a leading negative divergence in to that rally that created the churning on the chart above this one.

As far as some other indications, MoneyStream is a good money flow indicator, similar to 3C, however it rarely gives a signal so I don't use it often, but when it does give a signal, they are usually pretty solid. The more pieces that fit, the stronger your analysis.
As you can see, MS gave 2 signals at the top, but even the last 1 which 3C was very clear about, isn't that distinct if you are not use to looking for divergences. However the current MS signal is pretty clear. I drew a trendline as a point of reference and just like 3C, if there were accumulation or even flat confirmation, MS would mimic price, instead price makes a slight new high for the consolidation while MS trends down, making a new low as it goes.

I'll be back with more in a little bit.


SPXU Chart Request

SPXU is the UltraPro Short for the S&P-500
 Today's short term 1 min action-leading positive, this is the kind of day where I want to add to a position like this or start one.


 SPXU 5 min Leading positive, again almost any day this week in the lower white box, makes for a decent place to add on a high probability move, with minimal risk.

 15 min leading positive, it went negative earlier at the start of the rally around Oct. 4th

The 30 min chart is leading as well.


 I like to compare as much as I can, so here's the opposite of SPXU, UPRO which is the UltraPro Long S&P-500

If there's decent confirmation, it should look roughly the opposite of SPXU above.

 UPRO 1 min seeing distribution in to today's bounce.

 The 15 min is leading negative, whereas SPXU 15 min is leading positive.

And the 30 min UPRO is leading negative, the opposite of SPXU.

The QQQ/DIA

 DIA 1 min is also turning negative

 as is the 2 min-these look worse then the SPY

 DIA 5 min

 DIA 15 min is hitting new leading lows, this would imply that the short term bounce was distributed and thus the 15 min accumulates more distribution.


 QQQ 1 min-remember the Q's looked the best, they are slightly leading on the 1 min

 The 2 min is turning negative on the intraday bounce.

 The 5 min is still in a positive position

Looking at the Bollinger Bands as a target, it would appear that this is about right as far as an upside target goes.

Market/SPY update

In the last market update I mentioned the start of a negative divergence...
 Here was the negative divergence, which ended up being a consolidation/pullback within the bounce off the lows.

 2 min is starting a relative negative divergence

 The 5 min is trading in line so this is the fulcrum pint between the short term and longer term trend.

 15 min remains leading negative

 The 30 min longer term trend has added to the leading negative downside today

 as has the 60 min

Here's ES 5 min starting to go negative as well.

Let me take a look at the other averages.

USO/Crude Update

Remember the updates of the last few days I have said there seems to be something fundamental (perhaps a supply issue) that we don't know about yet, that seems to be effecting crude?

Well quite obviously that fundamental information was Gaddafi's death and Libyan light/sweet now apparently back or moving back toward normal production. Remember the Saudis pledge to take up the slack for Libya? Also Italy being the main consumer of Libyan Crude and how the fact that Saudi crude had such a high sulfur content that it would take 3 barrels of Saudi crude to equal 1 barrel of Libyan crude and the fact that the plants might not even be set up to remove that much sulfur from Saudi crude?

We talked a lot about it and apparently this is what has been giving USO that previously "undefinable" fundamental issue that was causing the charts to look a bit strange. Any way, now we know.

So here's USO now...
 1 min looks like there could be some further upside

 2 min looks the same

 5 min also looks like further upside is probable

 10 min is the fulcrum and trading in line.

 15 minutes is where it start to get negative

 Long term trend 60 min-this looks like a fairly good size downtrend and recently we have seen a sub-intermediate trend consolidation.

A close up of the 60 min shows the larger sub-intermediate trend at a turning point which should continue the downtrend, perhaps it will move to an intermediate downtrend.

However in the short term, it looks like a bounce is likely. The short term strength may be an opportunity to start a position or add to a position in something like SCO.

GLD Update

 The charts/updates over the last several days have been showing GLD pulling back to the 150 day moving average which is what it did today.


 GLD 2 min negative divergence

 GLD 10 min negative div.

 GLD 30, negative.

And thus far there's a small amount of accumulation on the 1 min chart. Now that we are back in the "historical buy range", we'll need to with and see what happens with 3C and GLD.

Market Update

It looks like resistance is starting to build on the intraday bounce.

 DIA 1 min

 ES 1 min

 IWM 2 min

 QQQ 2 min (the Q's may have a little more upside)

 SPY 1 min

NYSE TICK Chart.

There are longer timeframes then 1/2 min going negative, I just wanted to get this out quickly.

Dr. Lumber?

Here's the ETF (thank you everyone) CUT, for lumber/timber. Here's how it compares to the SPY/S&P (in red).

 Daily long term, it called the 2010 QE 2 bottom and started trending up while the market was still working on its low. In 2011 at the top, it started trending down while the S&P was still working its way sideways. Right now Cut is making lower lows/highs, implying a move down while the market went on to make a new high for the consolidation.

 60 min chart shows CUT trending lower while the market was making a new consolidation high.

The same can be seen on this 15 min chart.

We'll see shortly if Lumber is the new Copper.