Thursday, January 16, 2014

PCLN Charts

I don't know what it is about PCLN, I like to think there's some objectivity here, although there is a hint of gut feel as well in seeing the price action and underlying action on a day in which it is some diametrically opposite. In being 100% honest, I have to question whether it is impatience as we have been waiting on >$1200 for months, since we were under $1100 if I recall. I always look to question motivations which is why I'm such an ardent supporter of real trading journals, not journals of trades.

Questioning your intentions and emotions about why you do what you do in the market is never a bad thing, in fact it's one of the most useful things if you keep a journal and can identify patterns.

As far as why we have been waiting so long for PCLN +$1200, all you need to know can be found in these two links (you'll need some time)

#1

#2

As for PCLN itself, here are the charts...
 5-day chart, again note volume on a parabolic move up and the recent change in character in the red box, it may seem small, but each bar is a week. PCLN's ROC in price is definitely a red flag.

This is the $1200 level we have been waiting for since we were around $1100 or so, it was just such a magnetic, obvious level that would create all the opportunities discussed in thee 2 links above.

Today's higher volume with a longer upper wick on the candlestick is another change of character which is indicative of a rejection of higher prices, but adding the heavier volume makes it a probable churning event, the hand-off of shares from smart money to dumb money.

The Trend Version of 3C which loses a lot of detail, but cleans up the trend, note the change in 3C as price goes parabolic.

 The 4 hour chart has been interesting since the start, completely in line and then a clear move to distribution.

The hourly chart does the same thing, these are among my favorite 3C charts. Green represents in line, not a divergence.

The 15 min chart is full of confirmation and a few minor signals, but the distribution is the strongest.

If you follow this 5 min chart from left to right you'll see all of the divergences and how effective they have been. Note also the head fake move, I talk about them a lot so I want to point them out because often we look at a chart and don't see them unless they are happening in real time. Today's 3C action is leading negative with a relative negative preceding it as is often the case.

I believe this will move to the 15 min chart soon.

 A closer look at the 5 min chart (as far as the migration that fed the 5 min chart, see the 3 min below) which shows another head fake move under clear support, it is used for the same reasons many head fake moves are used for, last minute and significant accumulation or distribution and to create the momentum that jump starts a new move.

Again, a relative negative divegrence at #1 and a leading negative divegrence at #2, leading to a new low on the chart while price is elevated.

The 10 min chart viewed intraday does show a clear leading negative divegrence so it did see migration and this is coming from a local "in line" or confirmation trend.

 And likely where it all started as most new divergences do, the intraday 2 min chart that is marked as a relative divegrence, but it is leading. This however is a good way to understand divergences and comparing two relative points in time and price with 3C.

 The 2 min chart, if the divergence is strong enough, will migrate over to the next longest timeframe which is this 3 min chart. Again, the classic relative negative to leading negative and in an area that is a natural reversal process.

My Trend Channel set for 2013, first note the direction of the trend channel, from an uptrend to an increased ROC uptrend to a lateral/down move. There are 3 stop outs on this chart.

I NEVER have claimed the Trend Channel will take you out at the exact top or the exact timing, in fact there's usually additional volatility that increases and sometimes if you are lucky, you can sell at the exact top, HOWEVER, AFTER YEARS OF USING MY FIRST AWARD WINNING INDICATOR THAT WAS SUBSEQUENTLY COPIED BY PRICE HEADLY (in my opinion)  I HAVE LEARNED YOU ARE USUALLY FAR BETTER OFF TAKING THE STOP OUT SIGNAL AS YOU WILL HAVE COLLECTED 80% OF THE MEAT OF THE TREND, THE EXTRA 10% OR SO IN THE TOP AREA IS EXTREMELY VOLATILE, EXTREMELY DANGEROUS AND IS NOT WORTH THE RISK FOR THE POTENTIAL REWARD.  In other words, more often than not, I have found only pure luck would get you out at a better price and often there's a big gap down shortly after that takes out months of gains and it you hang around too long, you are likely to lose gains on that move. In addition, the time spent in the volatile chop is opportunity cost which could be better used in an asset that is ready to make a new move. There's also that open position risk of a gap down and for what? An extra 5 or 10%?

 A close up of the TC, the stops are always on a closing basis, not intraday and at the highest level of the lower channel (in the case of a long), we have 3 stop signals.

My X-Over Screen is not perfectly at a short or sell signal, but the price moving average is right there, the custom indicator and moving average in the middle window are moving closer to the second confirmation every day and the bottom window has given a signal.

This is where volatility picks up and chop.

So, I'll still be patient as far as filling out the put position and the core short which is in place, but was intentionally opened and added to with the ultimate goal of adding the last bit reserved for the position >$1200. Part of me just wonders if PCLN will even do it as it has been $1.25 away from that goal or a mere move of ONE TENTH OF A PERCENT!!!!!!!

GOOD LUCK TO ALL OF YOU HAVE PATIENTLY BEEN WAITING AS WELL, AREN'T YOU GLAD YOU DID THUS FAR?

Opening Half Size PCLN February $1200 Put Now

I'll add if I can above $1200 where I've been waiting for PCLN to go for months, that's where I'd fill out the core short as well, but for now, a half size put position with the intention of adding to it if it moves >$1200.

Closing Market Update

Is today Thursday or Friday? The way the market is acting, I could swear it was about noon time Friday on a monthly options expiration, perhaps there's a big, juicy reward for pinning January monthlies at Max Pain.

Almost all indications of intraday trade seem to have slight steering, some oversteer and then a divergence intraday in the other direction, some slight oversteer and another divergence in the other direction all with the aim of keeping the market right here in this tight range we have seen today as if today were options expiration.

The NYSE TICK is incredibly mellow again at +/- 750 (even several months ago when we were getting consistent +.10% tiny baby moves, but consistently, the TICK data was at least pressing through +/- 1000 and often spiking to 1250/1500.

The Yen divergence is still in place (1 min) and it has had the effect on AUD/JPY, USD/JPY, EUR/JPY that I'd expect, not any big moves, but in line with the Yen's move.

Leading Indicators are flat with some minor underperformance or outperformance here and there, the only one I found interesting and partly because it's such an effective leading indicator was Yields.


This is a larger view and many divergences are on this chart, but they look like reversion to the mean because they are so small because of the size of this one now which is negative, it's a lower high in Yields at the current SPX prices and this has been a very effective leading signal.

So that's where we are at. Almost every asset is nearly frozen or has been handled today to keep this range intact.

Magically, moments later, THERE GOES GS!

Apparently there isn't going to be as much gas in the tank as I initially thought or perhaps it is op-ex related, but the small base under construction today just popped.

A GS short amy be available a lot sooner than thought. My alerts are set.

GS Trade Set Up... It's all about perception

Anyone remember that Janet Jackson song, "What have you done for me lately"? I actually had a beautiful blonde girlfriend at the time it was a hit, she was, well lets just say she fit the stereo type of a beautiful blonde, even though I don't believe in stereo-types, it's just the nicest way I can say it. She actually asked me during a little spat, "What have you done for me lately" to which I did my very best not to roll on the floor.

The market is exactly the same; earnings may see knee jerk pops for a variety of reasons, but good or bad, the bottom line comes down to, "Is this as good as it gets or can they do better moving forward?" and price eventually responds according to the perception of that answer.

If you read through the post action report, first off Goldman beat on earnings and revenue, but EPS expectations were reduced before earnings to $4.24, GS came in at $4.60, but they would have missed had they not cut employee benefits/compensation.

Earnings for Q4 were -19% lower on a y.o.y. basis, which reflects a few different issues, but I think a big part of that is as a Primary Dealer taking part in POMO (essentially risk free, profit) which use to go straight in to the market, I think they are starting to do with it as was originally intended and shore up their standing as the F_E_D removes the Bernanke Put, essentially I'm saying the last 5 or so years have been one big stealth bank bailout as the actual 2008 bank bailout was VERY unpopular with the US tax payer, but this is so wrapped up in subterfuge, the average American has no idea it's even going on. Yes, I'm saying QE in large part was a stealth bank bailout.

They did $2.5 bn in Revenue for the quarter, $622 million of that came from the TWTR IPO. They did $1.46bn in equity trading profits for the quarter as well. Revenue was down -5% y.o.y at $8.7bn, but beating consensus.

If it weren't for the trimming of employee compensation, GS would have missed EPS by about $.50 and that's an already lowered EPS expectations going in to earnings.

Moving forward, I don't know how actual revenue and EPS creation gets better as a bevy of new trading regulations are coming online and the probability of future deals like the TWTR IPO this quarter, which was a big life saver are growing dim.

In addition (and if this doesn't tell you something about the market), the decline in Equity trading and Institutional clients (such as hedge funds) was down -27% and -15% respectively y.o.y. What is interesting to note is that Lehamn lost nearly 45% of their institutional client flow just before they blew up, the street is full of whispers and for you and I to find these things, you have to be an inspector to find hints of it on their earnings report. I'm not suggesting Goldman is about to become the next Lehman, but if a respected place like Goldman is seeing that kind of outflow of institutional clients, I wonder what some of the less respected investment banks are seeing?

As for the trade set up, this may be a little "Play it by ear" as the knee jerk reaction from earnings is in play and it's not always the best barometer, often it's a game designed to set the chess pieces up where they need them to be.

In any case, the charts...

 On a weekly chart of GS we have stage 1 base, stage 2 mark-up and note the volume is healthy as it rises with price, then at "a" we have the typical increased Rate of Change in upside price action that is a warning that a top is nearby and at #3 we have a top/distribution and #4 decline completes the cycle. The large triangle, I don't know what to make of that since there's no real preceding trend of proportionality, but it can't be helpful.
At the 2013 breakout which I consider 2013 as a large head fake on the 5 year trend in many cases, volume is not healthy, volume here is the hallmark of a trend that should fail.

I put down a few targets, I think <$100 is conservative.

Here's the breakout channel and note once there's a channel buster on the upside, price trades on the bottom of the channel.

RSI and MACD 26/52/9 both are negatively divergent as far as trend following goes, similar to the market which is good.

 My custom DeMark Inspired indicator for Buy/Sell areas shows a current sell, actually 3 in 2013 alone.

The daily 3C chart looks right on, note the distribution through 2013, we know there are hedge funds that have been liquidating all long assets for over 16 months now, so the distribution is not surprising.

The extreme in the signal is, but understandable as nearly $4trillion dollars have found their way in to the market one way or another via the F_E_D so that's a lot of extra slush that has to be distributed so the extreme and large signal make sense in that context.

 The 60 min chart going in to the recent highs is not a sign of a leak, it's more of a market wide trend.
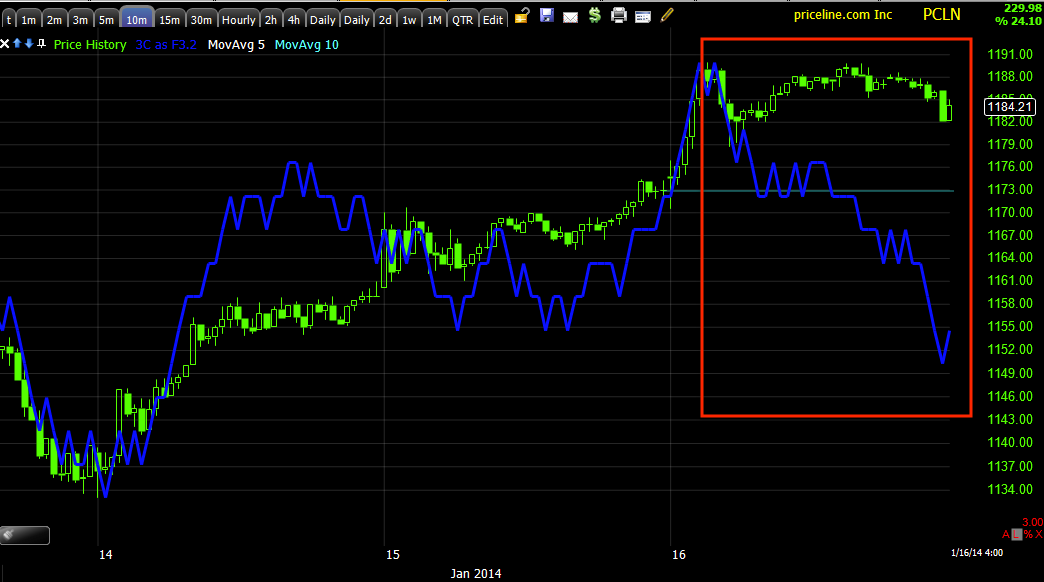
The 10 min chart

The 3 min chart in to the earnings run up, I suspect there was a whisper number and a lot of knowledge of GS's actions like employee compensation, I don't think Wall St. was surprised by earnings even though they were a headline beat, they are certainly falling apart y.o.y.

I see a run on at least two stop levels today and I also see a small accumulation zone so I think there will be a Crazy Ivan shakeout of any shorts entering today as support was broken. You can see that chart above. The size of that chase and divergence with it will dictate what we should expect moving forward, but I have included a range in yellow, I think any where in that range will be a worthwhile short entry or add to for GS.

"It's not what you did, it's what will you do moving forward", if this looks like "As good as it gets", then there's no reason for smart money to take the risk of holding a stock that is likely to do worse in coming quarters as more regulatory headwinds approach for banks and the market itself is another story entirely.

I'd set price alerts.


Market Update

It's still relatively quiet, typically this kind of range bound action sees strong underlying action, there's some, but it's not so strong that I'd take any action on it yet.

Tomorrow is the monthly options expiration rather than the weekly, so a part of me is wondering if there's a pin in effect, commonly Friday's open and subsequent Max Pain Options Expiration pin (which is stronger on monthly expirations than the weekly we see every Friday) is right around Thursday's close.

As far as intraday market movement, there's nothing going on with the SPY Arbitrage, the only thing going on is the Yen jiggle or pullback I mentioned earlier which is effectively noise, but it's about the only noise that has a reasonable chance of creating some movement, even if small, even if brief.

To show you what the major driver is and how it fits in to the big picture, here are the charts.

 1 min Yen single currency futures and the intraday negative divergence I mentioned earlier, it's more clear now.

 Here's how that divergence (above) fits in to the 15 min Yen leading positive chart which is really a base that looks to be creating some right side symmetry and that's about it. The area in orange is the chart above so it's very minor and the leading divergence is very strong comparatively, this won't create much of a fuss.

However, this is EXACTLY what we've been expecting since Tuesday when the Yen was still heading down, but multiple timeframes started showing accumulation, the base that formed at that point, was very high probability.

 ES (INTRADAY) has been following AUD/JPY, on a longer scale than 1 min, ES is WAY out of sync with the correlation and is kind of like a long narrow cliff with no support under it.

To put today in to context on the AUD/JPY 60 min chart which is clearly in a downtrend, that white arrow is about it, so a little jog to the upside would be completely normal and not a threat at all to the bearish tone emerging through the Yen, then the carry crosses, then the Index futures and then at the end of the line, the market itself.

This is what EUR/JPY (and USD/JPY) look like 1 min intraday, they also have a little base for a bounce based in the Yen's 1 min negative at the top of this post.

What I'm saying is this is what is likely to be controlling action the next hour or two, but other than that, it's completely insignificant.

As I often say,"Movement creates opportunities and information". We've been caught in this range and there have been moderate 3C signals, if we get a Yen based move, no matter how small or larger or brief, it should open up underlying movement in 3C giving us updated information and quite possible some trades worth taking. Right now in this flat environment, committing new money is insane without a darn good reason, it's opportunity cost at best and open market risk at worst.

USO Trade

USO recently put in a base and made some gains on the upside, last night I forgot to put in my report, "Watch for a USO pullback, it may be a SCBO" (Second Chance Buying Opportunity). If there's a worthwhile pullback, I'm guessing $33.25 is the area and if you are interested, that's where I'd set price alerts.


 The 60 min base, move up, deep pullback and reversal process (note head fake moves in the yellow boxes).

The most recent reversal process to the upside with a 30 min leading positive divegrence.

 This 5 min negative was obvious yesterday and a big part of the reason I suspected a pullback. This was another asset I was watching for a head fake on the base to enter and it took off.

This is the 1 min chart. As far as I can tell thus far, it probably has some more downside to go and then it should round in to a "U" shape, that's where it has the best risk:reward profile.

I'll be setting alerts as I think this one has a lot of potential.

Quick Market Update

I see a slight intraday 1 min negative in the Yen single currency futures and some consolidation areas in a few of the carry crosses, the most notable is USD/JPY from 9:30 to present with a little "W" so this could cause a intraday bounce which is not to say a normal bounce, just a jiggle or jog upward intraday in the averages.

I don't have any positive divergences on any 1 min timeframes for any of the Index futures or the averages so they themselves don't look to have a signal suggesting an intraday move, I'm just basing this on the Yen alone, it's nothing serious. 

I think NYSE intraday TICK data may be your best chance of seeing a change in character if one comes, but that will be pretty fast if it happens, otherwise, there's not much there beyond the Yen 1 min signal.

UNG / DGAZ EIA Nat. Gas Report/ Update

UNG and it's pullback (and subsequent DGAZ long or add to position) has a new twist this morning, but it's fine.

The 10:30 a.m. report came out...
EIA Natural Gas Report
Released On 1/16/2014 10:30:00 AM For wk1/10, 2014
PriorActual
Weekly Change-157 bcf-287 bcf
Highlights
Natural gas in storage fell 287 billion cubic feet in the January 10 week to 2,530 bcf for the largest draw on record, just ahead of the 285 bcf draw in the December 13 week. A draw of about 300 bcf was expected. The heavy recent draws reflect this winter's heavier than usual weather.

 UNG daily chart with the H&S shakeout. Today's candle so far is a bearish hanging man.

This is the intraday data, the red arrow when the EIA report came out, as I thought, the cold weather had been discounted earlier in the week.

This is the chart we've been looking at and thinking DGAZ is a new long (trading) or add to, just wanted to wait for the report this morning, so far though, so good.

3C distribution in to the report. I'd like to see the 2 and 3 min charts migrate negative as well.

This is DGAZ 5 min, I think by the time the UNG 2 and 3 min charts migrate negative, the rounding process will be mature, this morning represents the head fake move so I'd say DGAZ is pretty darn close to an excellent long entry/add to.

DGAZ 1 min confirming UNG.

I'll jeep an eye on this, but I wouldn't have too much trouble adding now, but I'd prefer to wait just to have all the ducks in a line, but I also already have significant exposure in DSGAZ, if I didn't have any, I may act faster.

MCP Follow Up / ADD TO TRADE

The partial trading position entered in MCP this week is still up over +5%, but we are getting a pullback which is what I HOPED to see, this is why I set price alerts because I can't possibly watch every opportunity I'm looking for in a timely manner, so if you have them, use them, they are a great tool.

Here's what we have and what we'll be looking for .
 The 30 min chart os strong so this means any pullback is likely corrective and healthy making it an ideal new position or add to at lower prices and lower risk, but what I wanted to show you was the "Fractal Nature of the market". Note the larger "W" base and then look at the smaller white box, the same thing, a small "W" base, this is the one I bought, actually I bought both, just closed the first trade before it turned down.

This is that second, smaller bottom. I closed the first MCP trading long (left the calls and core MCP long position in place) at the distribution of the red arrow and took nice profits and waited for the next set up.

I was hoping MCP would come back a bit, thus far it has, what we need to see is this move down start to turn sideways and put in a "U" or "W" pattern, pretty small, it could be accomplished in less than a day. We want to verify accumulation in to that pattern and then MCP becomes an add to for me as I only opened a half size position, but you can open a full size or whatever you are comfortable with. I think MCP will be fine and this is likely the opportunity I was hoping we'd see.

Set those alerts!

AM / FX Update

Good morning.

Notice anything about this morning? You probably woke up to a rampless market. While a rising Producer Price Index (yesterday) and rising CPI (today) which is now 1.7% inflation on a y.o.y. basis (just shy of the F_E_D's 2% comfort zone) doesn't help the case of those who would see QE stay at current levels, it wasn't that.

Initial Claims coming in this morning at a slight beat didn't have anything to do with it, nor did Continuing Claims at a whopping 3.03mn (this is before the 1.3 mn people on extended benefits start falling in to the or out of the labor force rather I should say, which should start showing up next week and lowering the unemployment rate again).

No, what it was is what we've been watching, the only thing that it REALLY important right now.

 This is the USD/JPY 15 min chart, all that is really important here is the trend, lower highs as it fell just short of the $105 level.

Here's 5 min USD/JPY reversing down last night around 10:30 as we expected because of the Yen divergences.

And the 1 min USD/JPY overnight.

As far as the AUD/JPY, we saw that nasty drop last night...
 That was some ugly Australian employment data, that's a huge move and important as well.

The EUR/JPY, again, all that is important is the trend, lower highs, now we see if we make a new lower low, that is the game changer of game changers.

overnight EUR/JPY...There's no carry ramp, thus there's no ES ramp!

ES has been following AUD/JPT yesterday and overnight so...
 This is AUD/JPY vs. ES (purple) overnight, pretty much in line right?

Well here's the trouble...
Just on a 5 min chart, ES is pretty darn disconnected from AUD/JPY, it has some catching down to do if that correlation sticks.


So here's the idea, the Yen moving up makes the carry trades more expensive to hold because of the huge leverage so they can turn in to big losses for smart money really fast as the Yen gains ground. We saw a pullback/correction in the Yen, but the trend seems to be up since the start of the year, 3C has warned us of this Tuesday and yesterday. This sends the carry crosses down which in turn sends Index Futures down which sends the market down and it all comes back to the Yen and the only way we know what is going on with the Yen is 3C, unless you want to wait two days to find out because 3C was telling us 2 days ago what would happen.

Take a look.

 30 min Yen/3C was always positive or in line, NEVER negative, even with the last 2 days, the draw down WAS A SIMPLE PULLBACK!!!!

Note 3C leading even more today than yesterday and the Yen's reversal process, just about done it appears.

Here's the 15 min chart I said was leading positive so not only did we have signals, but they got stronger every hour.

Here's the 5 min and the Yen is now pulling out of the correction's reversal process on significant 3C accumulation, that's the important part because the accumulation told us what the probabilities were while price was still pointing down.

 This is ES/SPX futures today 1 min in line

This is R2K Index futures 5 min, which is where it counts short term, at the white area on Monday night I said the market had some room to move up, but it didn't have accumulation, it didn't have a reversal process, thus DEAD CAT BOUNCE. Now we have a CLEAR negative leading divergence which is usually how I determine trading position direction.

This is all the market is really about right now, other indications help and are important, but this is the theme, this is HOW YOU TAKE THE MARKET'S TEMPERATURE.