Tuesday, February 12, 2013

Tonight....

Before the SOTU, BOFA came out with their sentiment indicator saying at a current bullish reading of 9.6/1, it is more bullish than 99% of all readings since 2002. They also said that it is a contrarian sell signal for risk assets and...

" Since 2002 a "sell" signal of 8.0+ was on average followed by a 12% peak-to-trough correction in global equities within three months."

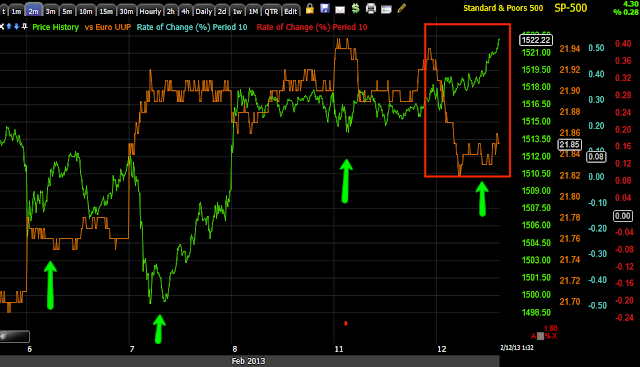
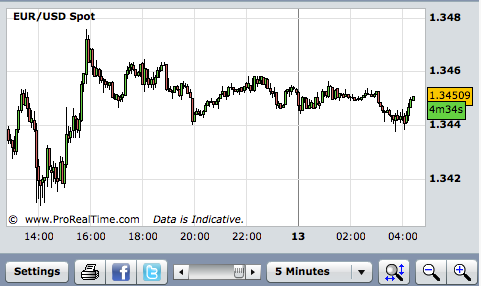
Now, what I noticed, as I watched the speech I saw no movement of any kind in ES, there's still little to no movement in futures, but in currencies, as the speech ended, boy, oh boy have things moved, for example...

As a barometer...
 As you can see, neither the Euro or Dollar has moved much...

 However the EUR/JPY is sinking, since the Euro hasn't moved much this means the JPY is flying high, not good for the carry trade.

The USD/JPY is sinking, since the USD has barely moved it means the JPY/Yen is flying.

A rising Yen is not good news for the market.

Take a look at the carry trade during the rally vs now...
The EUR/JPY chart above means the Japanese Yen has been falling like a rock, this enables the carry trade that finances equity transactions, at leverage of up to 200 to 1, a move like what we are seeing tonight, can be devastating to a carry position, this can be devastating to the stock market as money is pulled to close a carry trade. If this movement to the upside in the Yen keeps up, look for what may be some very fast, severe movement in the stock market.

Market Wrap

It would be really cool to tell you something really exciting about the market today, but the market was just slightly less dull today than yesterday thanks to the market being so dull that it created a huge Bollinger Band volatility squeeze, the biggest of the year and still the best we got was the SPX +0.17%, the NDX100 -0.43%, the Dow at +0.34% and the R2K as the big boy at 0.45%.

The dominant Price/Volume relationship for all 4 major averages was the bullish Price Up/volume Up, which often creates a 1-day oversold condition, but how in the world the dominant relationship has "Volume up" in this low volume environment almost beats me, it's compared to yesterday when the Far East was shut down, so anything would have produced more volume today and still be pathetically low.

The range was extremely low, the volatility and average trade size were all low. How volatility or ATR could actually be lower than the first month of the year is beyond me, especially after it started really climbing, but it did, which is why so many traders are using the word, "Bored", I prefer "Dangerous".

SP-500 through the VERY low ATR/Volatility of the first month of the year without a single real pullback, followed by a high volatility/high ATR, choppy market than went no where, but rather churned and followed by the lowest volatility/ATR of the year over the last 2 days.

The NASDAQ 100 saw the lowest volume of the year, in fact it was only a few percent away from the low volume of Dec. 31st, New Year's Eve. when most every human trader on Wall Street is still in the Hamptons.

The Dow-30 was even lower than December 31st and the only day that had lower volume this year so far was, you guessed it, yesterday with the Chinese Lunar New Year and Japan closed yesterday.


Perhaps even worse as the SPY with volume just a hair above the December 24th half day!
SPY with the lowest volume of the year, just a hair above a half day on December 24th-Christmas Eve.

Usually these low volume markets are easy to ramp, however we saw some big name stocks take it on the chin today, among them: FB -3.15%; AAPL -2.51%; QCOM -1.92% KO seeing a big gap down and nasty day at -2.72%, CSCO -1.41%; AIG -2.08%; BBY -1.78%.

As I have been warning about, High Yield corp. Credit which has been severely dislocated from the risk appetite in the major averages has seen a positive divergence for at least a couple of weeks on a 15 min chart, unless there's some sort of pairs trade going which I kind of doubt with Junk credit acting the same, it looks a lot to me like a short squeeze, but as noted earlier, HYG was up right off the open with no market correlation and saw distribution right on the open, again leaning my opinion toward a short squeeze.

This is a 2 min chart of HYG Credit in green, the SP-500 in red and 3C on HYG in orange. The point being the SPX is higher generally because HYG is so dislocated from the normal risk 1.0 correlation the two assets have during a healthy rally as you have seen in any of the Leading Indicator updates such as today's.  The white arrows show that HYG rallied right off the open, while the SPX didn't make any real move until about 12:30 while the 3C indicator shows HYG seeing distribution right off the open. HYG still has a decent amount accumulated on the 15 min chart so I expect it will run higher and will need to run higher to run out any shorts, but it doesn't seem to have any positive correlation with the market.

At the same time, the less volatile (recently) High Yield Credit has no correlation with the market today as it dropped vs. the SPX.


The difference between High Yield corporate and High Yield doesn't bother me as HY Corp. is far, far more dislocated with the SPX and in short squeeze area as everything we have seen so far today has suggested and as expected before the move even started.

Commodities behaved very strangely today...

 Commodities (brown) where the mirror opposite of the SPX, this is not the normal risk on correlation that would see the two move together, instead stocks followed the legacy arbitrage correlation with the $USD while commodities moved 100% against it, almost as if they were afraid of inflation from the currency destruction wars being played out across the globe, a situation that the educated G7 apparently doesn't have a realistic enough grasp to release an intelligent, understandable press statement without moving the entire FX market against what they intended this morning.

Commodities in brown usually move 180 degrees opposite the $USD, today they moved exactly with it while the SPX moved as it should have.

Still, as I started the "Week Ahead" post with on Sunday night, Currencies, as expected, are the pivot for equities, perhaps the G7 confusion is why we saw such timid stock performance and low volume today as no one understood what to expect from the G7 as their initial statement pre-market this morning sent FX pairs rocketing up, like the EUR/USD up 100 pips after the statement that sounded as if there was no currency war, while two members, Japan and the U.S. openly declared Japan was waging such a war with the US Secretary of the Treasury fully supporting it this morning. So the G7 revised their statement and said that the market "Misunderstood what they said", it was simple, plain language, the entire FX market misunderstood? The revised statement took a tougher stance specifically against Japan, so did the G5 craft that statement as Japan is unapologetic and the US as recently as this morning supported Japan's currency devaluation measures?

This may sound boring, it may seem irrelevant to the market, it is not.
 As the Euro climbed earlier today the market followed it, in the afternoon as the Euro maxed out and headed lower the market followed it, although a few hours behind-there's more than 1 currency the market is keyed in on.

 As the orange $USD headed lower in a minor pullback, it gave the market some breathing room, but as it became clear the $USD was moving higher in the afternoon, the market which has one of the strongest FX correlations with the $USD, started heading down.


What I found interesting was the $USD recently put in a 5-day gain that's the largest in something like 7 months, during this time the market went in to a high volatility, lateral trading range, as the $USD pulled back just a little today, the market moved up just a little.

Before the close, I had been watching the QQQ and the NASDAQ futures, I put out a QQQ call trade idea in the weekly options, a long NASDAQ trade I expect to be closed tomorrow, which says something about the market as well.

Here's what I saw...


In yesterday's Market Wrap I even said that I thought I might have missed the Put trade in the NASDAQ which was down -.43% today, which would have been a decent weekly options put trade with these words...

"The 5 min negative divergences in the Futures today have been the recent signal to buy puts for tomorrow" 

I was exactly right, had I bought the weekly options put on the NASDAQ 100/QQQ, I'd likely have a double digit gain today. Seeing the positive divergence today in the 5 min NASDAQ futures, I decided to go for the weekly options QQQ call, another reason and the reason I expect to close them early is the QQQ daily chart itself.

The 3-day pattern in the QQQ closing daily candles shows resistance on day1, a loss of momentum at yesterday's reversal Doji star and downside confirmation with resistance today, although not very strong. My hope and expectation is a gap up in the QQQ like what I drew in under the red arrow, in which the calls would be sold, with a close lower confirming the 3-day reversal pattern in the Q's right above resistance- it's a pretty bold call based on market behavior, but one I think is at least worth a shot here.

Since the SPX/ES gained today and the 5 min chart had a negative divergence, I didn't see the same opportunity as probable in the SPX, however with the negative 5 min divergence, if the QQQ plays like I expect and the SPX is weak on the close as the 5 min negative shows today, we'll have an interesting day tomorrow.

5 min ES/S&P futures with a negative divergence vs the positive in the NASDAQ futures (keeping in mind the SPX closed up a bit today and the Q's were the biggest loser today, closing down), this is similar to the rotation seen during the volatility stage of the previous week.

Right now, CONTEXT is negative vs the SPX, I want to see what it looks like during the State of the Union Address tonight at 9.

Finally I will remind you of what is happening in the big market momentum stocks, posted earlier today under "Market Breadth".


In green, Stocks trading 2 standard deviations above their 40-day price moving average, these are the NFLX's, the PCLN's the former AAPL type stocks, momentum stocks and since the 4th of January when over 44% of all stocks were trading 2 SD's above their 40-day price moving average, the SPX (red) has climbed almost 4% while the number of these momentum stocks performing well has fallen by 70% to a  mere 12.89%, that's a massive breadth problem.


I'm going to catch the State of the Union Address by Obama and see how currencies and the futures react, anyone remember the day Clinton would give a press conference and the market would rally 200+ points? What happened? I thought Obama was the great orator of our time? 

If there's anything interesting, I'll follow up... The question I think most analysts of the market are asking is why is the market so dull when it's so easy to ramp right now? I can't help but think the chart above partially holds the key to the answer.
For Your Temporary Amusement

My wife is still in Hungary, she was 6 hours from boarding the plane and slipped on some ice and really bruised her face bad, so bad they (Doctors) think it needs to be opened to let it.. well never mind, that's kind of gross.

In any case, she wakes up at 11 p.m., 5 pm for me, so we can talk every day on Skype and while we do, I update all my charting programs with the daily data.

I know some of have met our Hungarian Vizsla (Vee-zsh-lah), Emma (Dog). I really thought there was something REALLY wrong with this dog because my last Vizsla, Tilla, was amazing, like my son, just the smartest creature I've ever seen; in a room of 10 people I could introduce you and ask Tilla, "Where's George" and he'd go straight to George after 1 introduction. He would come out to the car and carry groceries in to the kitchen, just amazing.

Emma is too, she sings and talks, says I love you, but she's a lot more clingy, especially since my wife has been away. I was starting to think something was wrong with her as far as self confidence goes until I saw the hilarious video. The dog here (A Vizsla) not only looks exactly the same, but if you couldn't see the person's face, you'd never know it wasn't Emma, every single behavior, EVERY ONE including some odd ones at the end.

So I hope you enjoy, I of course will be back shortly with some insights that I've already gathered and we'll see what Obama does later.

Here's a picture of Emma on point...


Or HERE


QQQ Weekly $67 Calls -expire Friday

I like the Idea of QQQ weekly Call-very speculative size though

I'd try to get them as close to in the money as possible, I suspect they'd be sold early tomorrow a.m., keep it speculative and small, it's not worth taking big risks here on the long side.

YES-Still Keeping AMZN As IS

That means the equity short still in place with March $255 Calls that are just in the money today as well as the equity short. The idea is the calls work as a hedge as well as make money, when it's time to sell them the AMZN short works again and maybe we'll even look at some Puts to kick things up for the initial move to the downside, again this is not much different than the UA concept of initial short positions almost always see a volatility shakeout.

 Daily chart, the larger picture and reason for the equity short-at least part of the reason.

 The 30 min chart shows why the position was added to at the recent top with a negative divergence and why the call position/hedge was taken out with a recent positive divergence, this looks to be a volatility shakeout of the shorts.

Near term the 1 min chart is leading positive, this is good for the calls, but doesn't endanger the equity short at all.

ZNGA Should be a great pullback long

The Trend Channel stop is $2.78 and the pullback area is around $2.96, really missed this one yesterday.

Here's the current situation...
 The daily chart is exactly what we were hoping for, a large base capable of supporting a big move so I think there will be more to come in the near future in ZNGA.

 10 min chart's relative negative divergence and where I wish I had seen this.

 However the 1 min chart has a large positive divergence and it looks like ZNGA will make up some lost ground, the other half will likely go at that point.

The 5 min chart shows the same positive for a bounce from here.

For a new trade though I'd wait at least for a pullback under $3, this could be a huge winner.

Closing Half of ZNGA Long

I probably should close the entire thing, but there are some signs of at least an intraday move, perhaps near today's highs.

It's been a good long position...

43% gain

Market Update

AS the Leading indicator update showed as well as the earlier comments about the range being so tight the Bollinger Bands are bound to provide a squeeze, I can't really find any positive divergences in the averages at all and I'm talking about the shortest timeframes, even the most insignificant divergences as far as today goes.

As mentioned earlier, the IWM held up the best of al the averages, HY Corporate Credit must have more upside, but there were immediate divergences/distribution in to the move in HYG and that started right off the open, it didn't wait until the afternoon. What does that mean, so far it means I'd expect HYG to move up more, but it doesn't seem to have a strong, if any correlation with the market moving up.

 Bollinger Band Squeeze at the tightest of the year, not much of a directional move coming out though.

 Plus we had this ascending bullish triangle.

I'm not going to do any weekly option trades on this, there just wasn't enough of a move up to take risk off the table and I don't see anything to justify taking a weekly call position

I was going to post the updated charts, but they are moving so fast I'll wait until the close.


Closing FB Short for now

For the exact same reasons given last night in the UA trade concept of the initial shorts being run out.

 A small gain...

Tech

We've looked at Energy in depth, Financials we skimmed, but will come back, the third leg is Tech, here's a quick look, I want to get to futures and really see if this is enough of a move for the trade I was talking about yesterday (puts on one of the averages).


 XLK, Technology Sector is nearly as bad af the Financial chart posted last.

 2 min intraday(this is what typically goes on during these flat areas, people get lazy, of guard and things happen fast).

 AAPL didn't help much , actually really not at all, I'm still reserving judgement on AAPL for the time, but I'm starting to develop an opinion, I need to se more data to back it up and make it a solid opinion.

 The A's themselves during the same flat area and also not looking good on the exact same timeframe as Financials.

 This is the longer term view of the Q's on a 60 min chart, from the accumulation that started the move, "Trend #1" to the upside and what has happened through that move.

 TESC, the leveraged bear Tech ETF in the flat area of the last couple of days and this afternoon with a strong leading positive, the exact opposite of the bull financial FAS on the same timeframe.

The long 3x Tech on a longer 15 min chart.

Financials

I'll get to a more in depth look at these, but as I was telling you in the market update that the intraday signals are turning negative, I came across a monster in Financials...
 XLF 1 min is bad enough...

 As is the 2 min and these should continue to migrate from the divergences that are above, but this one was shocking...

FAS intraday 1 min
Pretty nasty, I'll update financials more throughly, but I want to keep going through averages and sectors.


Leading Indications

Without going in to the actual currency pairs because I think how they work can be confusing to some people, we'll just look at the singular currencies. During any kind of move, determining the health and strength of the move is essential, leading indicators are one of several of our ways.

A couple of interesting things have happened, last week and Sunday night I said I thought the market would be dominated not by the VIX which has been the lever of choice this year, not by AAPL which was the lever of choice for many years, but currencies would be the pivot everything revolves around.

Second I showed you High Yield Corporate Credit's 3C positive divergence over the last week I've shown it almost every day and said I thought it was a shakeout move getting ready, the initial information coming in right now is that is correct which is not good for the market.

*Remember the comparison symbol is always the SP-500 in green except when otherwise noted)*

 Commodities vs the SPX for whatever reason decided not to play along on the attempted risk ramp, a quick look shows the precious metals are pulling back here, but the larger commodity move has lasted all day.
 Commodities vs the $USD in green (not the SPX), in white to the left we have the normal $US Dollar/commodity relationship, today even with a $USD slightly down, commodities are risk off whe the normal correlation would not only to move opposite the $USD, but with a risk on move if it is strong and real like the SPX/market, they didn't follow.

 FCT as a smaller, but still notable indication showed no movement to the upside at all with the ramp, which isn't much of a ramp at +0.25%, but it's more than the last 2.5 days.

 FCT's larger negative divergence with the SPX on a 5 min chart.

 Junk credit moves like HY Corp (HYG), so it's up with the SPX.

 Longer term though as I said, it would have a lot of work to repair this big of a leading negative divergence.

 High Yield Corporate (HYG) doing the same thing, it has been down so hard for so many days, I have suspected a shakeout attempt of the shorts.

 HYG's longer view, leading negative divergence,

 This 3C chart of HYG (15 min) is the one I've been talking about for more than a week, it' also what I believe is a stop run or short shakeout move,

 As the move started the 1 min chart in HYG went south, which means that distribution of the position which must be decent size by now, started immediately at the first sign of higher prices, this again suggests a shakeout move.

 That chart so far migrated to the 2 min chart, it's now negative on the 3 and 5 min charts as well so there's good migration.


 High Yield Credit actually sold off and went the opposite direction rather than running with the SPX.

 The Euro lent support, but I don't think this is the key.

 Euro on a longer basis as the $USD has shown strong upward momentum recently (that pressures stocks and risk assets).

 The $AUD is still leading negative below the November 16th cycle lows, but was in line intraday.

 The $USD helped the market by showing some intraday weakness, all of the green arrows show the normal $USD/SPX or market correlation, they trade opposite of each other.

However, from timing, from the look of the move, I think the key is really the key currency, the Japanese Yen, it saw weakness and the market lifted at the same time. This is the one.

All in all, there's not much strength here in leading indicators, just currency correlations.