Monday, May 13, 2013

Futures

We already saw the destruction this morning in Japanese JGBs, now looking at the futures, this is the most notable thing I see, it's across every timeframe and it's something I've been expecting...

Japanese Yen...
 1 min

5 min

15 min

60 min

4 hour.

The Yen rising is bad for the carry pairs like EUR/JPY, AUD/JPY and generally as of the last 8 months or so, bad for the market and it has positive divergences all the way through.

The Euro and AUD look pretty good otherwise so I'm not sure how this plays out in the pairs, but it can't be good overall for them, this is by far the biggest news in currency probably since the Yen fell on the BOJ statement.

As for Index futures, ES 1 min is in line, 5 min and 15 min are negative. TF 1 min, 5 min and 15 min are all negative and NQ's 1 min is the worst, also 5 and 15 are negative...

NQ...
NASDAQ 100 futures
 NQ 1min


 NQ 5 min

NQ 15 min

The Yen movement is one of the things I wrote about that I thought would have a disproportionate effect on the market when it rises, it looks like it's there, we'll see what it does, but this is by far the most interesting of the futures, even though its not an Index future, it is tied in in so many ways, ways that carry up to 200:1 leverage for long market positions.

Book mark this post, I think we might be surprised how much a currency across the world can effect the market.

Daily Wrap

This is going to be shorter than normal as it my mother's Birthday today.

Basically we have a very extreme market, we get these when there are big market events upon us most often, some times other reasons, I keep using AAPL as an example and that's probably because this market reminds me most of AAPL, the first time I had really good divergences and tried to trade around them to see the market just overrun by sellers. That's what I recognized last Thursday when I said the market didn't look right, there were positive divergences in risk assets, but something didn't look right, they took off following the divergence and shortly after were sent to lows of the day, lows of multi-days or the week, it happened again Friday and it happened last night, it's a lot like AAPL and these aren't failed divergences because the market moves to the divergence, but it just fails and never to the downside, always upside moves are sold-I said last week I have been using 3C long enough I can just feel when something isn't right, it wasn't right, but I just recently defined what those red flags were, selling of any price strength.

A few examples, note when some strength appears, not even that much, maybe just green on the day, the sellers are there-also note the difference between last week and this week when possible.
 DIA-the light blue trendline is Friday's (the previous close)

 IWM

QQQ

SPY

Financials

AAPL

Today even lever correlations couldn't help the market.
 The deep lows in TLT should (look at the correlation to the left-even though it is skewed on TLT's side) have sent the market to a vertical new high.

 VXX wasn't holding the market back, in fact as VXX made a lower low in the afternoon, the SPX couldn't even make a higher high as strength was being sold.

It's hard to tell from the scale, but yields were higher, still didn't help the SPX.

HYG intraday- a possible head fake move at the EOD? We'll see...

HYG's correlation, this is what I was talking about needing to see go negative, I didn't think it woul;d be this obvious or strong.

The AUD's dislocation from the SPX...

The Euros-they are all there

HY Credit even selling off in to the close

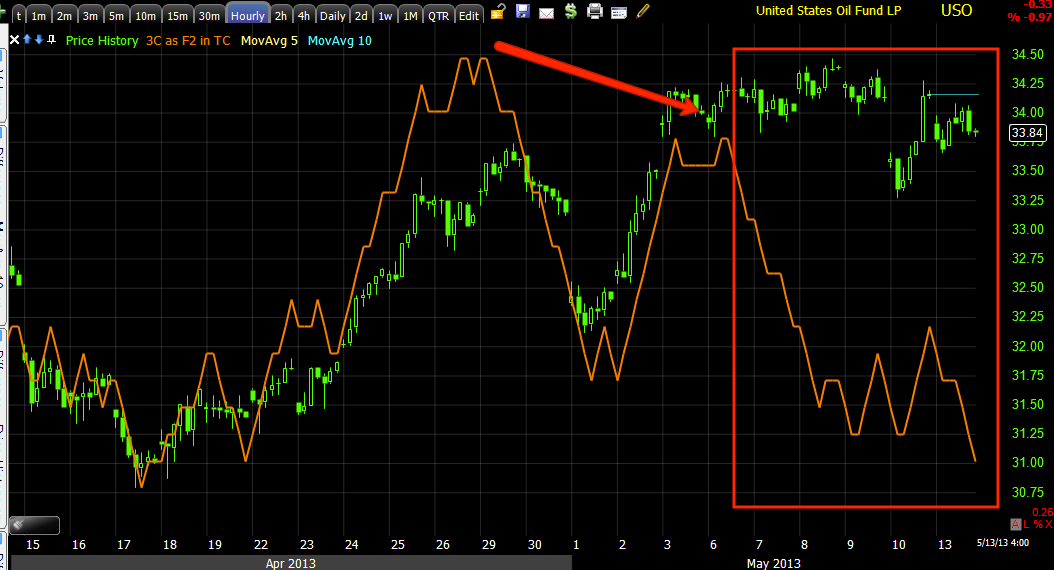
and commodities that performed much better than they should have.

As for the 3 levers and Context...
 Even with TLT and VXX down, the SPY Arb (even with HYG down from the open) just got worse all day. That's the SPY being 83 cents too rich to the model.

 CONTEXT surprised a bit last night on the open at +20 ES points, now down to 4.39 points.

HYG, the EOD move may have been a head fake, I just see the EOD accumulation fell off, I wonder if it was offset by sellers.

TLT's accumulation on the other hand was solid all day, maybe that's why Yields didn't help the SPX, perhaps they knew what the tone was in treasuries-remember last night's signals for Treasuries (Futures)? Accumulation even opening down.

VXX seeing accumulation as well today.

I'm going to look at futures when I get back from dinner, but what I see above is a copy of what I saw first in futures last Wednesday night when I said,

"looking at the charts, something doesn't look right, it's not consistent yet through single currency futures and the pairs, but for example, the Euro which moved up, has a worsening negative 3C tone, the Dollar should look worse, but almost looks as if it's about to transition to a more positive stance. R2K Futures have a negative divergence and couldn't make a new high."

That was the first hint of what I now know was the selling of any strength, now apparent in the market once we got past op-ex Friday.

Futures to come...

UNG Update

UNG is still one of my favorite long term long positions, its an ideal hedge for shorts and an ideal position for those looking for a position that they can just put in the portfolio and put it away without much maintenance. UNG also happens to have a very high profit potential, in fact so high that UNG may start its own bull market or in fact be one of the leaders of the next bull market whenever (or if) that comes along.

UNG reamins in an excellent add-to position or a new long position as it is still in a large stage 1 base, stage 2 is mark-up or what most call the bull market trend so I'd support adding to or initiating a new position in UNG at these levels. Today's action was a gap fill within the reversal process, which is now large enough that I feel fairly confident that this is the accumulation stage that is specifically in place to make the breakout from stage 1 to stage 2-the long term accumulation has been done for some time now.

 In yellow was a 5+% day that we took profits on, at least 25% in my case-who takes profits on a 5% move that breaks out above resistance?

Someone with an edge that can see what the underlying smart money trade looks like. We took profits in UBG on a strong price move, but weak underlying institutional move that was followed the next day by a pullback, so not only did we keep profits, but entered UNG at lower prices because we can see something more than just price action.

Technical Analysis would tell you to buy on a day like this.

 The reversal process, the more accumulation, the stronger the upside move and the only upside move we have left is a breakout to stage 2 mark up.

 Intraday today gapped up and then filled the gap-nothing bad, just more accumulation.

60 min 3C chart shows the distribution on the 5+% day we took profits on and we re-entered at the lows where accumulation took hold.

 The more detailed, but still exceptionally important 15 min chart with two head fake moves to the upside, both with distribution and a current leading positive divergence. Ironically price is about as quiet as can be right now, but the underlying trade is about as busy and bullish as can be, but you could never tell that form price or even price and volume alone.

 3 min chart is obviously backing up the charts above.

As is the 1 min and 2 min (not pictured)

Silver / SLV / AGQ

The only silver related open position is AGQ (UltraSilver 2x leverage long) and I think I'll keep it open. To be clear, I would not be opening new positions in silver or gold. I don't feel either one, despite what the divergences may look like, are in a high probability / low risk area.

For whatever reason, gold more than silver (and I can speculate that this is because gold is much more sensitive to anything QE/FED related as it blew far away from the normal value correlation with silver) looks to be in a much touchier spot.

Specifically gold is in at least an intermediate, if not primary bear market, it is also in a bear market rally that seems to have more gas in the tank, but the shorter or faster 3C timeframes are migrating negative and it may just be a matter of time before those longer term GLD counter trend rally divergences disappear.

SLV/silver futures...

The idea here is that with AGQ offering 2x leverage, it has a decent return potential, but at the same time the divergences in SLV are of a longer nature for the most part, they aren't very specific in terms of minutes, hours of even days, so if there's any draw down, there's not so much leverage that it causes a problem for the position and the drawdown must be limited because of the strength of the longer term divergences.

I can understand why gold would face significant challenges ahead, but I don't know why silver as a precious metal that typically moves together with gold to some degree, is not reflecting those same challenges, again the only thing I can guess is that silver was never turned in to a bubble by the F_E_D inflation fears and silver still has many practical uses in manufacturing; I suppose we will find out the answer sooner then later.

 SLV 30 min, but note the leading negative divergence to the left and then the leading positive to the right-this pattern plays out over and over through every time frame, so it must have been a very strong move of underlying action.

*Head fake move in yellow just about a week before a major decline. There was also a shakeout of the shorts too just before the decline-this is what I think happens in the overall market, just as they didn't want the shorts pre-boarding the train in SLV, they don't want them in the market either, they make their money by retail chasing which is something retail is already happy to do and call it confirmation-I'd say "Confirmation that they have no edge"

 15 min SLV chart, note the exact same signals

SLV 10 min chart, exact same signals. Whether AGQ fires in a day or a week, I have no problem holding it, I think it will make a strong move based on the positive divergences.

SI Silver Futures...
 SI 5 min chart shows a head fake move to the downside, we confirm this at the time by the accumulation of the break down and price confirms it later, but that is our edge, being able to enter on the head fake move at a far better price with far less risk while most retail would have to wait until the next day if they even entered at all.

The 5 min chart is interesting not only because of the current positive divergence, but because of the confirmed head fake move, these are typically the last event before the move so futures suggest the move in SLV/AGQ is close at hand.

SI 15 min also strongly confirms the head fake move and is in leading positive position which is a much stronger signal on the futures 15 min chart than on an equities 15 min chart.

Even the daily SI chart has an enormous positive divergence, why so different from Gold? I don't know, but there's something there and I intend to try to profit from it.

I do not see this as a great entry right now, I can see maybe an equity long on a somewhat speculative basis, the head fake move is the best place to get in on anything with more than 3x leverage.

Financials: XLF (Short), SKF (long), FAZ (long)

Unlike GOOG, I can't find anything standing out in Financials suggesting they pop higher, except the range of the last 4 days creates a bit of an attention zone as it is seen as resistance and breaks through resistance are bought.

The only other thing would be the SPY itself with a 1 and 2 min intraday positive divergence, not as far as 3 min though, the SPY has a fair amount of Financial representation. In any case, the outcome is the same as GOOG, for an equity short or even buying SKF or FAZ long, I don't have a problem with some draw down on a head fake move, for an options position (put), I'd want some upside momentum to enter anyway so I'd want to see some kind of move higher which would likely run through the resistance zone as we are right there.

I also checked FAS and UYG in addition to XLF, SKF and FAZ to see whether there was something on one of the other charts I was missing, I didn't find anything.

 XLF 60 min is representative of the major underlying trend/flow.

The 15 min chart has a clear negative divergence at what would be a test of resistance (it's really too small to call a double top).

 The 10 min chart has the same

The 3 min chart is faster of course so there's more detail, it's pretty clear distribution didn't just start, but it is clear that at the test of resistance today we have a deeper leading negative divergence than we have at any other price point.

GOOG

If it were a matter of starting or adding to a GOOG equity short, I'd probably consider this a decent area. If you really have time to pay attention or are more interested in a put, then I'll show you the area I'd be watching for, I'm just a bit concerned things could happen so fast we don't have time to get in position, but that's really no reason to take a trade that is not optimal, I'll be waiting patiently and hoping this comes to me and I have time to act. With an equity short, the potential drawdown isn't that significant and in my view losing the larger trending trade is more of a risk than a few percent temporary drawdown, but options are much different.


 GOOG 60 min shows the longer term flow/ trend- GOOG looks to be in a lot of trouble here.


 Close up of the 30 min shows that the more recent trade has had more urgency to it.

 The 10 min chart's greater detail backs up my thoughts on the 30 min chart above this one.

This 3 min chart is an intraday move, this is the AAPL scenario, the 3 dangers are 1) the move comes and the sellers just overwhelm the positive divergence and there's not much of a move at all, that happened 3 times in a big way throughout the entire market Thursday night, Friday regular hours and last night, the second danger is that it moves so quick that I don't have a chance to establish a position and lastly, that it doesn't move at all, this is only a 3 min divergence and while that would be more than enough to wait with no hesitation for the head fake move above resistance/new high, in this market, much of that is out the window.

I still think for options you have to wait for the best set up or move on.

Taking URRE Profits for Now

I'd like to look at re-entering on a pullback a bit deeper, but for now I feel taking the profits and looking for a better area to add the position back is best for me.

URRE still has huge long term potential so if you like it and want a hedge to short positions, this is a great one.

USO short / SCO Long

If you have need of an energy position in crude specifically which should suffer as a result of a stronger $USD, then I like either short USO of long SCO (2x short Crude).

I don't have a problem adding them here or adding to them, I wish I could. I think SCO may move to the $37 area, but the thing is once the herd is broken up and they start selling any and all strength, the market is going to crack-we are at the VERY UnPREDICTABLE part of the market. 

I thought I had a great signal on AAPL and let go of my short to add at higher levels, then the hedgies sold any and all strength in AAPL and it cracked and 45% lower, I had perfect position and good signals, but all bets are off once everyone is acting, not just in their own self-interest-but acting on their own fear-more importantly.

That is why I'm not opposed to SCO long or USO short right here as a new or add to position. Adding a partial position is an idea I like too, if price moves lower (for SCO long) you can add to-you are not dollar cost averaging because you planned this in your risk management before you ever entered. If price takes off to the upside, you have a wide stop and can add on a pullback later,


 5 min looks really bad with price action so fractured, I believe that's more a sign of smart money's fear than anything.

USO 15 min is in a horrible negative divergence.

USO 60 min tells the story.