Thursday, August 8, 2013

Daily Wrap: Bounce Still On

Overnight we had some data out of China, Export/Imports that came in at a +10.9% y.o.y rise vs. consensus of 1%, so a total blow-away of consensus by 5.5 standard deviations, this got ES and US Index futures in risk on mode and that's basically what gave us our overnight levitation/gap up open, even though China itself closed red as did the Nikkei (Down another 200 points). Also ramping risk was Chinese copper demand which is up 52% over the last two months, although GS says it has nothing to do with demand and more to do with tight liquidity issues, but it gave the world the impression that the global economy was on a healthier footing. The Chinese trade balance however, missed at $17.82bn vs consensus at $26.9bn, the most in 4 months and the second month in a row. Again, despite the seemingly blow-away print, the GDP contribution was only $17.8bn, a far miss of consensus of $27.1 bn which has led pretty much everyone other than the headline scanning algos thinking that China's data is "less than reliable" or one firm threw around the term, "Cooking the books", which isn't a concept anyone has trouble believing when it comes to China's state released data.


The Bank of Japan kept policy as is which will continue to add $60-$70 trillion JPY to the monetary base annually in their QE-Zilla. 

In the US Initial Claims came in at 333k vs consensus of 335k, 5k more than last week's upwardly revised print of 328k (from 326k). The 4 week  average fell to the lowest since November of 2007. Continuing Claims missed as they were up 3018k from 2951k and vs consensus of 2950k. There wasn't much of a reaction from initial claims other than a pop in gold, a small pop in the USD and Treasuries gained.

Today we saw some green closes snapping the worst multi-day decline of the entire year, amazing that bit and right on cue with our bounce speculation as well as candlestick analysis and just about everything else. The only thing was yesterday's closing intraday 3C suggested weakness in the a.m. to be followed by strength which is the same pattern as the last 2 previous days, if not for the gap up, it would have been a perfect call as we did close the gap to a.m. weakness, hit an a.m. intraday low and bounced off of that.

Just so you know, we have the same 3C pattern as of today's close, which might be good because I see some signs that we will continue with a bounce so that pullback will allow us to set up new or re-set positions that may have been closed today out of an abundance of caution. The actual 3C afternoon negative divergence (that should run right in to tomorrow's trade) is actually worse than the previous two days so we may get a real nice pullback, which is a "mini-gift" for all of you hitch-hikers.

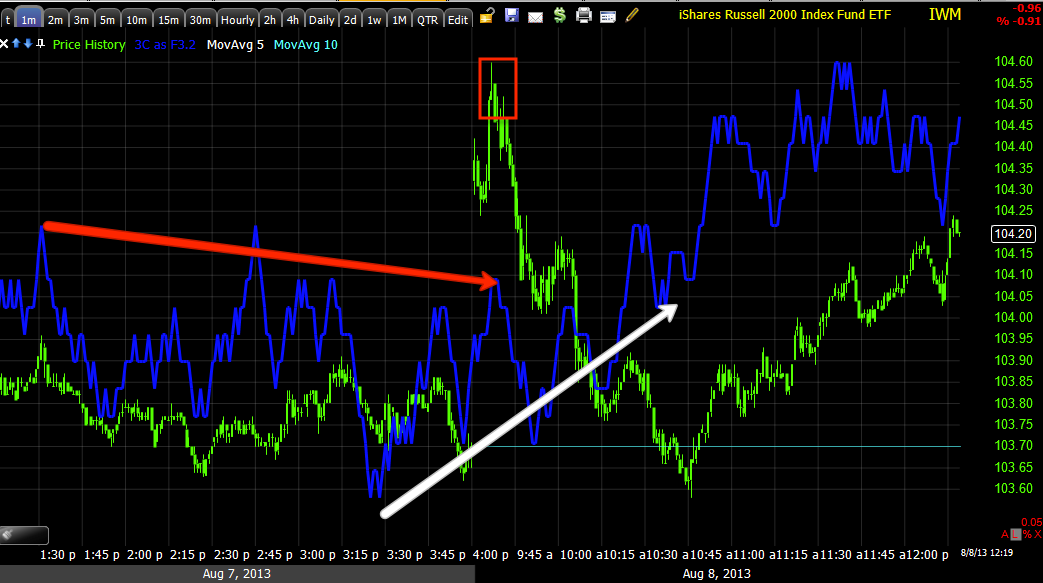
This is the SPY showing how bad it is, but all of the averages look similar.

To the left you see yesterday's afternoon negative intraday divergence sending the SPY lower off the gap up open and today the divergence is deeper/leading negative so I'm thinking this may set up some decent positions as I have uncovered some things that look like we will definitely be bouncing.

As far as what's driving the market, can you guess? It's the carry trade and the reason I still think USD/JPY long is a good trade or FXY short.

 This is FXY, the Yen ETF and I inverted the scale of the SPX, you can see the Yen's strength or weakness drove the market all day long.

As far as that strength/weakness and what to expect in the day/s ahead...

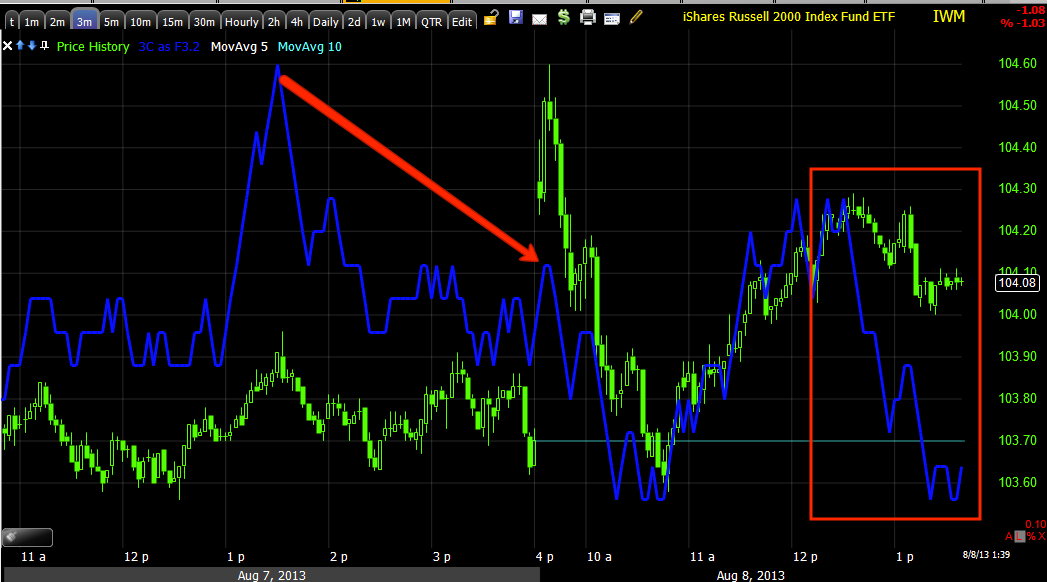
 This is the 15 min Yen chart with the carry trade being seriously covered, but there's a clear 3C divergence as there was yesterday suggesting the Yen turns down which it did today, allowing the market to bounce.

This is the $USDX, it would have to do the opposite for the USD/JPY to rise and support the market and as you can see, it has a positive divegrence that has already helped turn it, so this is 1 factor that argues strongly for the bounce I expected initially late Tuesday as the data started to come in suggesting one.

Don't forget tomorrow is a typical options expiration peg, so trade may be a little pinned for most of the day.

As to other assets and information...
 HYG/Credit looked to follow the SPX fairly closely, there was that bout of strength in to the close that is somewhat telling, it was obvious in Junk Credit and far more obvious in the thin, High Yield Credit so I think that argues for credit or at least HYG/arbitrage supporting a market bounce.

If you back off HYG a bit you can see it is not overly excited, I have a feeling they are doing as little as possible as they don't want to get caught holding a risk asset as things come apart.

 You can see clearly that the SPY Arbitrage WAS not in effect today at all really other than a little lift off the intraday low.

CONTEXT is negative, but it has a lot more room, I'm sure it will look worse on any market price strength.

VXX was basically tight on the correlation intraday with the SPX, TLT was still stronger which makes ,me happy to see even though I expect it to pullback and support the SPY arbitrage, but as far as holding the longer term core position (long), I like to see that relative strength.

Commodities are still acting better as they have been the last couple of days, Gold and silver both had good days today and they look to continue that move for at least a bit longer, although I suspect from 3C signals on the futures that each will pullback and Gold will likely lead silver this time.

Finally on the "Bounce" side of the ledger, professional sentiment, in our leading indicators, both were up vs the SPX, here's FCT...
That's unambiguous strength in sentiment and HIO was the same, I think a bounce is inevitable even though today things started looking very fragmented.

If 3C is correct as it has been on the intraday signals at the close, we should look for a.m. weakness again, I have no idea if we get a gap or not, the Yen is not as strong so it's hard to say, but I do think we pullback/

So long as signals are good, we'll do the same thing as yesterday and add longs and calls, equities or options, whatever you like or you can wait it out as these are speculative, we should get a deep discount and a nice move out of these, but again it's just hitch-hiking.

One night I'm going to do nothing but the big picture and how much trouble this market is really in, I don't want you to forget that because in my view, we need to really be thinking about and trying to get our shorts in place at the most advantageous area, that's where the real trade is.


New Website- Democratic Vote

Believe it or not, we are making progress on the new site, I thought it would go much faster than it has, but a lot of it is my fault in trying to decide what we can do and what we can't.

For instance, I checked in to sending Text alerts for trade ideas/positions, but at our current membership which is as large as it can be using the Blogger platform (I'm literally refunding money every week for people trying to sign up and have a waiting list for open slots), over the course of a normal week with several trade ideas (not like yesterday), I would be going through their highest tier of $375 a month and additional texts at some rate which is fairly inexpensive, but you count all of the members, all of the trade alerts (at least 2 for every position), I not only run in to an unreal amount of money, but I far surpass their maximum texts per month and that's at a conservative level.

So, when the new site is up, you'll be sent a coupon code (as any current members will be grandfathered in at the current subscription, but new members will be higher) and a link that will allow you to create your own username/password and profile which will include what types of emails you want to receive, right now every one goes out, but I came up with about 6 categories like "Trade Ideas", "Market Update", Position Follow Up", "Analysis", etc so you'll be able to select which categories you want sent to you and for many of you, you might chose "Trade alerts" only and get the rest from the site which will automatically refresh. Posts will also be color coded, there will be a window off to the side showing any position changes/new positions made that day so you don't have to dig through all of the posts, there's a lot of other stuff you can do in your own personal profile and I sent the basic parameters of a risk calculator, he sent me a mock-up of part of the calculator, it has many more fields than this and it looks like this...

This is not what the site looks like, this is essentially a blank page that the calculator was created on.
I don't know if you can see it and like I said there are many more fields, but I entered $10,000 for portfolio size, $10 for the price of the stock and the intended stop of $9.00 and based on the 2% rule for risk management, after I hit calculate, the green bar came up and says "You can buy 200 shares as each share=$1.00 risk and 2% of your $10,000 portfolio is $200."

There are other fields that will go in to cover other aspects, but it should be a nice tool to quickly get an idea of what the 2% rule would say about the risk and position size.

In any case, there's so much stuff on the site that I'm not even that familiar with it, but it's nice and clean.

What I'd like to ask you is, "If you had to label maybe 6 categories for purposes of what kind of emails you'd like to receive, what would the categories be?". It can be more or less, just what you think would be helpful to you as far as what you want immediate email alerts on and what you can read on the site (or you can get all posts sent to you like now).

TIA and I'm really looking forward to migrating to the new site, I think it will be much more efficient and add value for members.


P/L's for MCP, IWM and SPY

I didn't have a chance to get these out earlier, there were definitely better times to close these, but in this case I was holding on and waiting to see what the day was going to look like and if we were to continue with our short term move. These were closed because I didn't like some of the things I saw, because there were a lot of positions opened yesterday and a lot of short term "long" exposure.

Here's MCP which has been a good trading stock for us, either equity or options, they reported AH and I don't know what the results were or if they put out "Guidance" yet or not. MCP was brought up as a long on June 21st, we had a July +14% equity long trade and then expected MCP to pullback to the lower part of its base, but took this quick trade because the signals were there, but I still expect it to pullback to the lower part of its base where it will probably make for a great long candidate again.

 You can see why June 21st MCP was brought out as a long, June 21st also happened to be the day we called for an upside move in the market, the next day was the low for the market and the move started there.

We have accumulation at the far left and you can only see a portion of the overall base and you can see why we closed the equity position as it went negative, but as I said, the expectation is for a pullback to the lower range in the $5.50 area and it will likely be a long candidate. The blue arrow is the current after-hours bid/ask as you can see they are down after earnings tonight.

 Below is the last trade that was entered yesterday and closed today


Quotes today were on the fritz, but you have: Symbol /  Description / Qty / Price Paid / Last Price / Change (in $) / Market Value / Profit/Loss (in $) / Profit/Loss (in %)


The P/L came out to a +47% or $4400 gain for 1 day, actually I believe yesterday was an add to and it was opened initially Tuesday.


This was opened yesterday and closed on some caution for a 2.7% gain which could have been much more if it was closed earlier, but I was expecting a longer run.


And this was opened yesterday as well for a +12% gain, another that could have been quite a bit more if closed on the open as initially contemplated, but I decided to wait and see if we get another leg up which we had good evidence for until I saw those charts that concerned me.


The Options Tracking Portfolio did well overall with some positions still open, benefitting from moves this week and ranking us at #7 of 704 for a nearly 24% gain on the week.


I'm less interested in ranking in the top 10 and more interested to see how big days like yesterday when a lot of positions were opened, actually faired because if they did well (and all of the positions were in the same direction), that tells me there were a lot of people looking for something very different because we are pretty far from aggressive option players.

I Would Want to Look at PCLN Short > $940 That's the range

QUICK PCLN

I was asked about them, they report AH, they look ugly.

Important Market Update

I can't get all of the averages out for you in time to be useful, but just like yesterday's end of day 3C signals told us (not about the overnight gap, that came from something unexpected out of China we'll talk about later) that early trade in the morning would see weakness and we did, the longer signals told us that the morning lows would likely be accumulated and they were, now what has happened since then is something brand new for short term trade, but it's giving us a hint and warning.

SPY Example...
 This is the 1 min chart, yesterday at "A" we saw accumulation of the lows, we were starting call positions in this area and cashed some in today, at "B" yesterday afternoon it was telling us this morning would see weakness and at "C", despite the gap up, the market did see that early weakness and I suspected accumulation of the a.m. lows, but "D" is essentially uglier than yesterday's late afternoon signal that played out today in the a.m.,

"A" tells us on this 2 min chart, "Down" and the next day, down. "B" tells us weakness in the morning today and a gap up and weakness, and look at that ugly signal this afternoon.


It's on the 3 min chart too so this is starting to feel a bit more than just "Tomorrow's early trade".

The 5 min chart is still in line so I don't want to short against this chart until it starts to peel back.

However, I know that if I do short, I'll be fine...

This 4 hour chart shows the EXTREME weakness of this run up so this is about putting on the right trade at the right time.

Right now, I think it's time for patience and let the next trade set up.

Quiet Time

When I'm quiet (not posting frequently) that usually means I'm actually doing the opposite of what you might think (sitting and watching the market and waiting for something to write about). I'm actually busier than ever, hoping back and forth between charts, indicators, currencies, interest rates, commodities, and every other thing I can look at because typically there's ALWAYS something out there that the crowd just missed, the JPY (Yen) Carry trade being covered this week and part of last week plus it not being able to levitate the market overnight more than 1 day, are all signs that a VERY IMPORTANT event is occurring.

Why is this so important? Imagine you had a way to see whether Hedge Funds and Private Equity Funds were in essence, borrowing money to invest in stocks, gold or bonds, but the key is knowing that they were so confident that they were borrowing money or whether they were so afraid that they were selling everything they had and repaying any outstanding debt while they still could before their source of funds to repay that debt ran out and the debt all of the sudden hit a penalty rate of say 40% interest per day.

THAT'S WHAT A CARRY TRADE IS. A Hedge Fund may have clients with $2.5 billion in assets invested with the fund, that would be $2.5 AUM (Assets Under Management), but they can't get leverage from Scottrade or TD... They can't get a loan from a bank to invest in speculative assets, the CARRY TRADE is how they leverage up their investments.

When they close it out, and most have been closed for some time, I was actually surprised to see there was still some out there, but they Yen is so darn cheap. That's what we saw and found out, that means something, it means a lot. It's not as good as a stock being above or below its 50-day moving average (SARC.), but it is information the crowd missed.

That tells me what I already suspected, "We're not talking about a 10 or 20% correction" and there's even more data out today from pros talking (for what it's worth.)

In any case, a quiet market for me is a scary market, their up to something.

I've wondered if I was going to see an extreme signal I've never seen before, what I am seeing is a lot of assets that all just broke apart, they have clear signals but instead of the normal herd movement, they are almost acting as individuals.

So I'm putting together watchlists and alerts for what trades in what area I think will be worthwhile.

Take AAPL for example.

 This is the 1 min chart so AAPL looks like it wants to bounce, but I think that the bounce would be fairly small so I'm thinking, "If AAPL sets up a little better with a little less risk and clean signals, I'll use calls". I want to see AAPL below $460 with clean signals for that trade.

The 3 min chart of AAPL shows 2 accumulation areas, but the most recent hasn't seen 3C turn down to complete a divergence or up to make a leading positive, two very different things and this will define whether I go for calls.

The AAPL 5 min chart though has NO STRENGTH at all, so I would take what I can get on a call, maybe even a weekly call and then consider whether I want to open a put or an equity short.

I have seen this "W" base develop and it's in the right place at the right time for where AAPL is for a bear market (AAPL is in a bear market) counter-trend rally, but I'm not so sure AAPL can fight the market tide.

This 15 min chart is one of the longer charts in AAPL that is starting to fall apart, if the 60 min falls apart, AAPL is done and down it goes.

So I'm looking at assets, figuring out where the trade is and under what conditions and setting alerts while watching the market for clues.

This market is taking on more and more character and personality than ever before as it use to be very stale with the Bernie Put.


Market Update

Feels like the Summer Doldrums.

Nothing much has changed except the IWM 1 min chart went leading positive and it looks like price is chasing it or trying to, the problem is that no other IWM charts have improved, no other market average charts have improved.

If the IWM or any of these run on charts that are falling apart, well let me put it this way, as well as grabbing the tickers for call positions I "might" want to re-open, I'm adding Put positions next to them.

If this did happen, it would be an exponential escalation of my earlier concerns. 

Market Update

Here's what was bothering me and still is, but I think it's fine. We went from no pullback signal at all, to a pullback signal that is getting a little too strong without any downside action and it feels like a spring coiling up to pop to the downside.

These signals are almost exclusively confined to the 1 and 2 min charts so that's intraday and I am looking for an intraday pullback, the other charts are fine, HYG is fine, I just opened a lot of positions yesterday, it's a lot of exposure and they all have profits, I might as well take those profits in the areas I'm concerned about and if/when we get a pullback with good signals, I have my tickers ready to re-enter at a moments notice and maybe I'll get lucky and make the same gain again.

There's really nothing wrong beyond this and this is probably being overcautious, but in taking those actions I had nothing to lose, I had profits, I reduced heavy short term long exposure and left lots of room to add positions at better prices, if the market takes off to the upside, I still have exposure and this is just hitch-hiking for some extra gains any way.

 DIA 1 min is leading negative pretty extreme with little downside price movement.

The IWM negative stretches out to the 3 min chart, there's no reason to leave those gains exposed with even a little uncertainty.

QQQ 2 min, before we didn't even have a hint of a negative divergence/pullback on even the fastest 1 min charts, now...

 The SPY 1 min is pretty clear.

ES as well so the SPX futures are seeing the same

NASDAQ 100 futures (1 min) .... the same

R2K 1 min futures the same.

The 15 min HYG chart is looking  VERY good and most of the above charts in their 3-5 min timeframes still look great so I'm sure it's nothing, but tactically or even strategically, I had nothing to lose.

Closing SPY 165 Calls as Well

Closing IWM $103 Calls as Well

I see a few things that I am a little distrustful of and basically lowering my exposure, the HYG chart is still VERY strong so there should be a chance to replace these at better prices as long as that little thing bugging me goes away.

Closing Out MCP $7 Calls

I'll look at adding them again if we get lower prices.

Finally, a Signal

We are getting intraday 1 min chart signals that have gone negative so a pullback is underway in most averages, like I said in the last post, the TICK was invaluable in determining where.

The question now is, "How far does it pullback?"

This could be a nice pullback that we can really take our time with, but I would not count on that.

I'll be getting together all of the tickers for any options positions I'm considering and have my list all together ASAP because we don't know how long or deep this will go but we do know that it is VERY likely that the market will shoot up on the next run.

Trade Ideas Update

This is not an easy decision, we're getting the same pattern as yesterday and the day before, in fact I'll just copy and paste what I said this morning, it's most accurate...

"the pattern has been losses in the morning to the intraday low and a rally off that low. If that pattern holds, it would make sense to take gains on the gap up and look to re-enter the same longs as the market pulls back to a.m. lows"

The main issue is the market is and has, as suggested above, been strengthening off the a.m. lows, it's to the point in which it's not giving any strong signals that it will pullback once more intraday as that would be the best entry, but on the other hand we don't want to buy at elevated prices, especially if you are thinking of using options AND THE ONLY REASON I MENTION OR USE THEM IS BECAUSE I DON'T THINK THE PROFIT POTENTIAL IS WORTH ALL OF THE WORK AND MARKET RISK. If I saw this as a strong area that would last for a 2-week swing, then I'd feel differently, but the market is stronger than yesterday.

My only solution at this point unless we get a clear pullback signal, would be to use leveraged long ETFs of the major averages, whether 2 or 3 x leveraged, that way the timing issue that options have is not as big of a deal and the draw down if we do get the pullback is not that big of a deal vs. options.

There could be a hybrid trade in which part of it is long equity/ETFs and if the pullback comes, juice the profit potential with some options. By the time I get through this post I may have a signal, but I have to show you all the charts to give you the picture and outlook. The TICK chart is invaluable here.

SPY
 The 5 min chart of the SPY may be the most important chart of all of these because it shows the weakness of that last run up last week, VERY WEAK and this is the overall tone of the market, this is the prize that is most important.

It also shows the "Bounce" and puts that in perspective next to the weakness so you should be able to see, whatever price does, however strong it may appear, there's an insane amount of weakness in the market and that must not be forgotten for a moment.


A closer look at the 5 min just to give you an idea of the divergence and where accumulation is taking place.

 The 2 min chart  is here because it's showing you EXACTLY what I said yesterday and this morning, EARLY TRADE WILL BE WEAKNESS, after that it's the lows of the day that will see the stronger accumulation and there it is as plain as day.

3 min chart, again, look where the accumulation is occurring, smart money does not chase, they are buying the lows.

 The 1 min chart is showing strength after the a.m. lows,  the point here is there's no sign of an intraday pullback, although I highly suspect it, it's not there yet.

QQQ
 2 min shows weakness on the open and early today, strength at the lows,  no real sign of a pullback.

 3 min clearly shows where the weakness is and strength, no sign of a PB

5 min chart is positive then in line, Q's are showing the worst relative strength, but still respectable for a trade.

IWM
 This 15 min chart which is zoomed in tight, showed no hint of anything other than weakness yesterday, today it is closer to in line, it's not a positive divergence, but stronger.

If you are looking at the big picture here, you'll notice again how weak the last run last week was and even for a decent bounce moving forward, there's very little strength compared to that weakness. If you don't know how to interpret that, I'm not sure I can add much to it. Put bluntly, any market strength in price is almost laughable, yes we can trade it, but if you don't know what to do with that price strength, you shouldn't be trading. I don't say that to insult anyone, I say it because you have an area of distribution right next to an area of accumulation and the difference is STRIKING.

10 min basically the same

This is what I said to look for yesterday, this is what I said to look for pre-market
, I include it only so you can see what the 3C signals said, what happened and what happened with underlying flows from smart money.
 DIA
 Again that strength, little sign of a pullback

1 min chart the same.

This is where the NYSE 1 min TICK chart is invaluable, look for a break of the channel.