In my mind, there was no question, the US was lagging and not decoupling, but the decoupling argument was reinforced during the first couple of months of 2012 by arbitrary seasonal adjustments. I looked over the US economic reports, not just the headline, but the sub-indicies, and details and it was pretty clear that the BLS and various other agencies were using seasonal adjustments that were often completely arbitrary to make the economy look better than it was and as such, the argument that the US could and would decouple from the European and global economy gained some traction. The sub-indicies of these reports painted a different story. It's sort of like the Initial Claims reports we have been seeing lately in which we may get a number that misses consensus, but because the previous week's claims were revised higher, the media has been calling these misses, positive results. If the current week's IC misses consensus, but is lower than the previous week because the previous week has been adjusted higher, how can you call that good news or a beat, especially when the trend has been to revise the previous week higher? I suppose you can if that's what people want to hear, but it's not reality and it's not sound analysis.
Although at the time I did my best to show you what was really inside these economic reports other than the headline beat (which is all the headline scanning algos care about as well as lazy traders), I think the best proof of this manipulation of the data using seasonal adjustments that were arbitrary ca be found in the trend of Citigroup's Economic Surprise Index(as I have mentioned before, no matter what Initial Claims or Non-Farm Payrolls say, TrimTabs is tracking IRS receipts in real time and you can't argue with the hard facts that receipts/revenue have been declining).

Members who have been around know that I've been building the case through evidence (not opinion) such as market breadth as a singular example, that this market is a house of cards built on the printing press at the F_E_D. Just look at the market during QE1/QE2 and absent QE, nearly all of the gains were a result of printing, giving the Primary Dealers Billions in profits to flip bonds that they held in some cases only a week and the PD's taking the profit and ramping up risk assets with the free and nearly risk free cash. Bernie himself testified before Congress defending QE as having created "The wealth effect" as defined by the Russell 2000's gains!
Look how the character of the market changed with the change in trend of the chart above.

However the proof something was wrong in the market had been established long before via 3C, Credit Markets, Risk Assets such as commodities, the unwinding of carry trades and more importantly, through the market breadth indicators; there's no fiction, opinion or bias in the hard numbers.
As for the lagging vs. decoupling argument, take a look at the following charts and see what you think.


Beyond the charts, this may be a point I've touched on too often, but the truth of the matter is we've never been in a global economic depression (or whatever you'd like to call it) of this magnitude under any similar set of circumstances historically. Globalism and Free Trade, the Internet, the interconnectivity of financial markets, the immense changes in the market structure (this is a whole topic unto itself as High Frequency Trading has pretty effectively marginalized the only true providers of liquidity that are required to make a market by law-if the market crashes, the HFTs are under no obligation to provide liquidity like a Market Maker or Specialist ) etc. There's no precedent for the immense intervention by the World's Central Banks. I find it ironic that Bernie argued in a paper he wrote before he became the chairman against the effectiveness of the very policies he's put in place. The point is, as mentioned last night, the US's housing bubble gave Europe a pretty bad cold, from there the structural problems within the framework of the EU only made things worse; that cold we sent their way will makes its way back to the US (and just about every other nation) in spades. We have NO historical model or precedent and just as the collapse of Lehman almost put GE and AIG under, no one can predict the far reaching the consequences of a EU collapse or even a Greek default!
Last night I mentioned the point of no return, I said, "Remember last Sunday" (May 6th), as that will likely be looked back as the beginning of the end as the Greek elections shocked the financial markets with the anti-Troika/anti-bailout parties gathering about 60% of the vote. For more on the Greek political drama unfolding, I addressed it briefly this morning in this post.
Tomorrow will be one of the first major tests in Greece (actually overnight) as something as small as a $435 mn Euro international law bond payout comes due. In the scheme of things, over the billion that have gone to Greece, to think $435mn Euro payment could not only bankrupt Greece, but alter the entire European Union is just unbelievable. I truly believe Europe has reached the point of no return and the point in which events start to snowball out of control, as I have called Greece, "The EU's Lehman x 1000". In some news today out of Greece, there's been talk of delaying the $435 mn Euro payment to the holders of the Greek international law bonds who where the PSI holdouts as they seek to recover full par on the debt rather than take the PSI 50% haircut that most Greek law bond holders had to take, so there's another possibility in what "could" happen with that payment being due tomorrow. We could see Greece being sued in international court as early as Wednesday-great time to have no government in place!
Alternatively, if the payment is made, that could be a "Dodged a major bullet" catalyst for one more bounce. I would think someone on Wall Street has an inside line of how this is going to go down, I also think that 3C would have looked really bad today if that bond payment was going to turn in to a major issue, but this is just the first of many challenges the Greek government (whoever that will be-you know I believe it will be Syriza in a second round of elections) face as there's no legislative body in place as parliament was disolved before the elections.
Tomorrow the EU also has an Eco-Fin meeting and Hollande will be sworn in around 9 a.m. London time, I wonder what Hollande will stir up in his first prime time spotlight moment as he choses his cabinet? There are numerous debt issuances tomorrow as well in the EU, o there are a lot of potential market catalysts.
No European wrap could ever be complete... (honestly, it's never-ending, whether the sewing circle rumors or real news/data) without addressing the post market downgrades (at least they didn't try to bury them after hours on Friday. You may recall after a spate of Sovereign Downgrades as the S&P revamped their analytical structure, I reminded you they'll soo be getting to the banks. Well Moody's beat the S&P to it this afternoon as Moody's downgraded 26 Italian banks between 1 and FOUR notches! If you want the specifics, you can get the Excel Spreadsheet directly from Moody's .
If you are interested in Moody's rationale, you can read it here, but I really don't think this is a surprise or anything that need be poured over unless you are interested and able to short some Italian bans, but for that matter, you can just about pick any EU bank (especially those that took LTRO 1/2 money) and eventually the trade will more than likely pay off.
In any case, the Euro didn't like that news, but is surprisingly resilient given a few hours.

The red arrow is the 4p.m. New York close, the red box is the reaction to the Italian bank downgrades.
In a mini-wrap of tomorrow's other economic events (I posted the US weekly schedule last night):
GDP for the Eurozone, Germany, Hungary and the Czech Republic; US CPI, Empire Manufacturing, Retail Sales, and Long-Term TIC Data; and CPI for Poland and Israel.
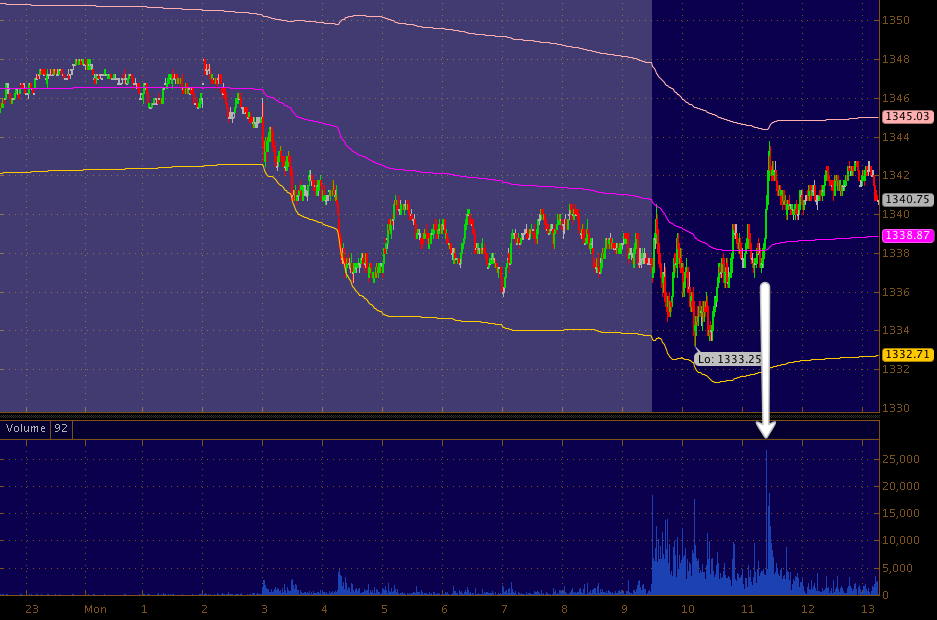
As for trade today, ES broke the 50 day moving average for the first time since last November, this was about the same time the F_E_D expanded their dollar swap lines, The ECB eased and whether part of a global action or coincidental, the PBoC cut their RRR for banks for the first time in 3 years. So, do we get a repeat of November with a round of globally coordinated easing? I addressed the ECB last night and Germany's recent 180 degree turn toward a more accommodative policy stance, I can't imagine things would be as easy for the F_E_D for a multitude of reasons, not the least of which is this being an election year.
As for the close today...


The head fake moves before reversals have been a behavioral market trend, should this move below the flag fail to get a bounce rolling, we have a significant change of character in the market and those of you who have been building short positions on strength the last month or so will be glad you did. A you know, in the equities model portfolio I have 6 shorts in place, all in the green, but I'd like to fill a couple of them out and add a few in different sectors on any market strength. I received a couple of emails asking whether I had changed any positions, the answer is no, there are the shorts that are the bulk of the model portfolio position and some AAPL Calls that were a small speculative position looking for one last market bounce. I will always post any changes to the model portfolio trades BEFORE I make them.
So we have a decent area for a head fake move, does the market have enough breathing room to pull it off? With today's move below the bear flag and bears everywhere, it would be a perfect time for a short squeeze, the mitigating factors are obviously the fundamental news primarily out of Greece from the anti-Troika (which is almost the same as saying "anti-Goldman Sachs) parties, as far as I know none of them are former GS alumni.
In the Risk Asset update I wondered how accurate Credit is right now with the JPM debacle (Hedge turned risk on turned mark to market loss in IG Credit) in full swing. I'm not sure how I feel about High Yield, but the more I thin about it, the more I believe that High Yield Corporate Credit represented by HYG, is almost certainly effected and therefore not as accurate a leading indicator as usual, HYG is cheap, liquid and an easy hedge, it must be feeling the effects of the JPM situation.
As far as the flight to safety trade in Treasuries (TLT as a proxy), the intraday 1 min chart was right on...


Here's today's 15 min move in the SPY...

Before I go further, there's one thing I wanted to mention, last night after looking at the 5/15 min charts to reduce noise and see the trends in the averages, I said,
"All in all, I spent a lot of time this weekend to find my views haven't changed. To be clear, my views are not my personal opinion of the market, my personal opinion is I'm quite leery of some news coming out and Wall Street reacting rather than their usual planning in advance, but from an evidence based view, I have to say I still think the probabilities are with a market bounce."
The bold part is what I wanted to address earlier today. For those of you who are keeping a trade journal, this may be especially helpful to you as I encourage you to write down everything including emotions about how you felt about the market, your performance, etc when entering and exiting a trade. What I realized I did in this post last night was this, I expressed my FEAR of the fundamental data coming out of Europe and its effect on our near term analysis which is for one last market bounce. What I think is important about this, as we know the market is an emotional meat grinder, is in admitting to all of you, "This is my fear", it took some of the power of that fear away simply by acknowledging "This is what I fear" and allowed me to concentrate more on the charts which are much less subjective than my "Fear". I just wanted to mention it for those of you who are keeping trade journals; I think by acknowledging the emotion, you diminish its power over you and are able to engage in more objective analysis of the market. I could also say I have a far of being wrong, but that isn't going to do anything to help me look at the market objectively. We can't always be right, but we have to look at the market as objectively as we can and make the best decision with what we know.
As for the rest of the market, you saw throughout the day the positive divergences migrating through the longer timeframes, we have a possible head fake situation, we know the market uses these head fakes almost all of the time before any significant reversal and on every timeframe. There's not really much more I can add to what we already know and witnessed today, I think overnight sentiment in Europe is pretty much going to determine the rest.
Before we wrap it up (and if I see anything tonight develop I will send out an update), we'll take a look at ES.

This chart looks a little confusing, lets just follow it left to right (the dark blue shaded background is regular market hours). As far as this chart reaches back in to pre-market trade, there was a negative divergence around 8 a.m. at the small red arrow, sending ES lower which was confirmed by 3C moving lower at the green arrow, around the 12:30-1 p.m. area in the white box 3C started to lad positive, this is the exact spot in which ES successfully tested its VWAP. The long red arrow coming from pre-market to the new intraday ES high is a relative negative divergence and ES moved lower through the rest of the afternoon. As ES was moving lower a relative positive divergence picked up around 3 p.m. to just after the NY close (the long white arrow), that was the lows for ES thus far and ES in evening trade has moved higher off that relative positive divergence at its lows, the green arrow in afterhours trade is confirmation of the move higher and right now we have a small leading negative divergence that should pull ES down a bit. Overall, I don't see anything yet that would suggest an outcome for tomorrow's open, but I will check ES before I turn in tonight and see if anything is developing and sticking.
ES seems to be following the EUR/USD pair lower. I haven't seen any additional news out of Europe, it may just be a technical move in the EUR/USD, but that seems to be what is behind the ES (current) negative divergence. If you were to look at ES and the EUR/USD minute by minute, I'm fairly certain you'd find the FX pair starting to move down as the 3C divergence formed and just before ES moved down.
As I said, if anything breaks tonight while my eyes are open, I'll update you.