Thursday, April 4, 2013

Daily Wrap On the Way

I'm just finishing up capturing charts, etc. This is an interesting update covering the near term to the slightly bigger picture, if you have time, don't miss this update.

Precious Metals

I think I'd prefer to buy these (the stocks) in a leveraged ETF like UGL or DGP(gold leveraged 2x) and silver AGQ- 2x leveraged.

I do believe these both could pullback intraday and a natural stop (I prefer a little below recent lows) is right there.

I think a partial position here, leaving room to add makes sense. Perhaps 50% of a normal position, but you may want to consider combining gold and silver and treating them like 1 position for the purposes of risk management as they have a decent correlation. I prefer leveraged ETFs because I think this is more along the lines of a swing trade, but because timing is a little questionable (possible pullback) I prefer not to use options.

Charts are coming, but I wanted to get this out.

Leading Indicators-Levers Quick Update

I'll post the charts later, but I'm satisfied with the moves in HYG (a typical lever for the SPY), High Yield Credit, in non-market correlated risk assets (for sentiment) such as HIO and FCT, also all of the FX/ currencies I looked at were in line with a move higher, the Euro, the $USD, the Yen and the $AUD. Additionally I like the sector relative performance of Financials, the momentum laden Basic Materials sector, Industrials and Discretionary. Also the underlying trade of TLT and VXX (also the price movement) as well as the underlying trade of UVXY and XIV (TLT and VXX are also typical SPY levers used to move the index up in short term manipulation).

I'll post these later.


AAPL April (20th) monthly expiration $425 Calls Fill

The fill was $11.25

Going to open AAPL monthly (April Call)

Just because the calls right now are expiring this week and I don't want to miss this move.

I feel this move is worthwhile as an AAPL equity long as well, I just prefer the added leverage as I don't expect a trend.

Some quick charts, this isn't my normal 3C template, but good enough.

 AAPL 1 min

 5 min

 15 min with BOP positive (not my favorite indicator) and the long term TSV 55 also positive at the bottom.

 30 min 3C leading positive, BOP and TSV also positive

Even 60 min has a positive divergence showing up, which means it must have some decent strength.

Looking at April monthly $425 calls.

Here's the VIX Post

The VIX analysis is part of a much larger post, "Daily Wrap" from Tuesday April 2nd (click the post name for the link) that may be worthwhile reading later to see some of the other assets that were backing up the VIX expectations.

As for the VIX specifically, as there are a lot of subjects covered in the post, I'll show you the specific charts and comments re: the VIX which is not the only analysis by far that suggests this move, but it's in a tidy little package. The following charts and commentary are from Tuesday's post which is linked above (bold text is from the original post, underlined text is added for emphasis in this post).


 "The VIX (green) daily chart vs the SPX (red) shows a squeeze in volatility, this suggests a highly directional move, if past experience is a guide, we should see a head fake move first with the VIX breaking under the triangle and the SPX making a new short term high and then a reversal sending VIX up and SPX down longer term."


"With my DeMark inspired buy/sell indicator, we had a recent buy, then a Bollinger band volatility squeeze of the VIX, a head fake move to the down side and a pop higher that pulled the SPX back and also broke the Trend Channel (stopped out the trend). Now we have the same volatility squeeze building in the VIX again, this time I think we see a much bigger move, which probably means the head fake move down in the VIX and up in the SPX is also much more convincing/stronger."

Back to current analysis, most of you are familiar with the "Crazy Ivan" shakeout concept. Also the manipulation of Technical Analysis and sentiment the last couple of days would certainly draw in shorts, this makes any subsequent move to the upside (even if it is short term and structurally weak) very strong as the "Head Fake" concept is used to full effect, if you are not familiar with the concepts, please check out the articles which are linked at the top right of the member's site and here, Part 1 "How Technical Analysis Went From an Asset to a Trap" and Part 2 "Motivation".

If we simply follow the concepts laid out in these posts, then the move in the VIX the last couple of days really cements the head fake move and creates the effect that moves the market to extremes.
This covers the head fake, the Crazy Ivan Shake out which also catches a lot of traders right now with very strong bearish sentiment, which is part of the "Head Fake" Concept in providing momentum to the reversal. The first BB squeeze led to a directional move, this also would be the same move that I talked about last night as the area which when we look back on a year from now, we'll recognize that area as the place where the back of the trend was truly broken.  The next volatility squeeze produced a big VIX move Wednesday, so far today's follow through is very weak, this appears to be the first half of a "Crazy Ivan shake out, another head fake-momentum producing concept. A move lower in the VIX below the triangle would likely send the SPX to new highs which is part of what is needed in these head fake moves, THEY NEED TO BE CONVINCING TO WORK.

 The 60 min long term VXX shows accumulation before the first run higher and more accumulation now, this ultimately is the direction, volatility up, market down, but before that and because the Head Fake concept creates the extra momentum when it comes to the real downside move...

 The 1 min intraday is already negative and turning the market to the upside, that's failed confirmation for yesterday's VIX move.

The 15 min chart is right in the timeframe that can produce the momentum needed and about the timeframe expected for a move down in the VIX (VXX is the asset here) and up in the market.

This is my theory, it has been my theory for a while. I'm going to check other information to see if it is confirmed or negated.


HYG being used as a short term bullish lever

I'll get a leading divergence update out because I think it's important to qualify what I think will be a near term move and really give it the credibility I think it deserves as a more surprising upside move, it's all there from Tuesday night and my VIX coverage, I laid out exactly what I thought would happen, now the charts are backing that up.

Futures are indicating a bigger move to the upside

Here are the futures charts, I think the market is going to surprise a lot of people with a move to the upside catching them off guard, I think the R2K will lead the move as the R2K should lead a risk on move.

I think stocks like AAPL are going to see a bigger move than I first expected.

If you read my analysis of the VIX and what it means for the market  Tuesday night, I think that is going to be right on track, I'll try to fid that post and get it up for you.

Essentially even if you don't want to or can't trade options (calls), I think the move will be worthwhile even on an equity long position, whether AAPL or one of the averages or a number of other stocks, (I'd prefer something with higher Beta for equity longs) .

Even though I didn't cover them in this post, ES, NQ and TF all have 30 min positive divergences, that suggests a pretty impressive move to the upside, even though I think it's going to be a Facade or "Ginger Bread House".

 ES 5 min positive, 1 min is in line, but recall positive 5 min charts have produced good, tradable moves to the upside.

 NQ 1 min looking very strong for a move VERY soon.

 NQ 15 min is leading positive in a big way.

 TF 1 min also very positive near term and...

Very positive on a 15 min chart as well as 30 min.

GOOG Charts

As we closed out the $800 Calls on Tuesday April 2nd, there was an intention to re-open these for 1 more move higher so long as the charts confirm what we were seeing back then...

(Click the link for the full post)


 This morning there were several stop outs as a range developed and the stop outs created some supply at better levels while there was a positive 3C signal, so it all looks like the work of professional accumulation. The first stop run was on the open and the volume on this 1 min chart shows it could have been either one of yesterday's late afternoon intraday support levels or both, the candle took out both in the same minute.

It seems as if the old day trading "A.m. Range" was in effect as support that generally develops around 10-10:30 is typically the range, that was a stop run and then the intraday lows. Right after the last stop out we moved higher, so again this is the same head fake effect we see on daily charts (the articles explaining the concept and why, are linked on the right, upper side of the member's site as "Understanding the Head-Fake Move: part 1 and 2).

 This longer 60 min chart is part of what kept me open to a new short term call position.

 The positive on the 30 min was more influential.

 As well as the 15 min, at this point I just needed to see the shorter term charts straighten out on a pullback.

 The 10 min leading positive

 5 min leading positive

 The 1 min leading positive

 and migration of the divergence to the 3 min leading positive.

 The momentum chart is showing a change in character in momentum, RSI, MACD and hopefully soon Stochastics will embed above 75.

Intraday stops, with the 5 min I prefer that the stop is accompanied by the moving average shifting direction (down for a long stop) and the Trend Channel can be used as well. I think this is better for equity positions as options need to be a little more ahead of the curve.


GOOG Equity Long

I don't see as much profit potential obviously, but I think $835 and maybe even $845 are likely targets for a short term trade so that could be up to a 7% profit for a short term trade.

Charts are coming.

Going With Speculative Size GOOG April 12 (weekly) $790 Call

GOOG $810 Puts Fill - P/L


With 1 filling at $32.23 and 2 filling at $31.70 the average fill is $31.876 with an entry of $30.10 makes that a +5.9% gain on the position, not much, but I'm thinking I can set up a better Put position most likely later today, maybe tomorrow.

Closing GOOG $810 April Monthly Put

I fully intend on re-opening it, hopefully higher.

I'll be looking at a short term weekly (next week) call in GOOG

Correction on trading the Yen Equity

I said in the last post you could trade the Yen SHORT, I was looking at the pair and expecting a downside reversal, but that means an upside reversal in the Yen itself as it is the second part of the pair meaning it moves opposite the chart, so you would actually go LONG FXY to take advantage of the signal.

Yen based Carries/FX may be changing soon

The BOJ came out last night with their version of the "Bazooka" or as some described the balance sheet expansion as , "Shock and awe". The initial knee jerk was seen last night when I was posting virtually in real time as the Yen was crushed lower, but as with all Central Bank knee jerk reactions, we have to remember they often are just that, knee jerk and now that the Yen has priced in the policy expansion, the market will start to discount the South Korean race to debase and how it will pressure the Yen higher, in fact it already looks like we are seeing signs of that now.

Keep in mind, in the single currency futures, there's very little 3C movement in either the EUR or $USD so there's not much underlying movement in the EUR/USD, but more importantly on the subject of the carry pairs, the movement in EUR/JPY and USD/JPY is ALL YEN BASED. For FX traders, I think we are going to see some downside reversal in both pairs.

 EUR/JPY 1 min last night, this is the 8 hours of accumulation BEFORE the BOJ policy announcement, you can tell when that was by price action.

 This is the EUT/JPY now, a 3C negative divergence already sent the pair consolidating sideways, now the divergence is worse, I think the pair reverses to the downside.

For Equity traders you can short FXY to take advantage of this signal.

 USD/JPY currently with a negative divergence also sending the pair sideways and an even worse leading negative divergence that should send the pair lower.

 As proof the movement is in the Yen and not the EUR or $USD, here's the single currency Yen futures, there's an obvious positive divergence that should send the Yen higher, thus the EUR/JPY and USD/JPY lower.

Here's the 5 min Yen chart, it is going to a relative positive divergence just as the Yen made a new low for the week.

Opening Indications

Since the first hour or two tends to be a lot of noise as stops are run and limit orders are placed or hit and then often faded in the a.m., I try to wait until a bit of the a.m. trade (a time when a lot of professional traders won't even look at the market as it can be that far off in manipulation) has passed to look at opening indications.

Here's what we have short term and what some of the slightly longer term charts hold as a short term probability, again this is VERY much in line with the short term expectations of some gains and slightly longer term expectations of a real market problem as the structure of the market is really just rot- as in no structural support at all; 
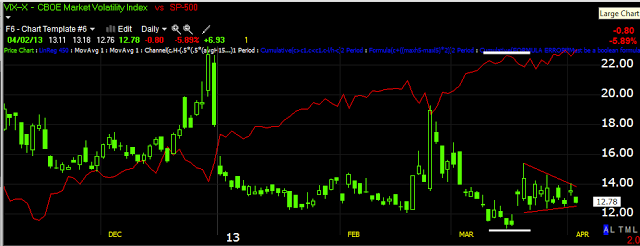
as seen in last night's posts as well, especially the breadth post where some of the breadth indicators got worse and actually doubled their readings in 1 day!

Here's what we have so far this morning in the averages.

 CONTEXT'S SPY Arbitrage model- keep in mind these are delayed about 30-45 mins.

 The CONTEXT (ES) Model which is showing the model at lower levels than ES, which isn't surprising really, the correlation factor is VERY high, it's been running close to 1.0 and is just backing off a bit with a differential of negative 8+ ES points as of 10:15 a.m.

 The SPY Momentum Screen shows the break down yesterday and everything going positive today.

 This is the 1 min SPY opening indications, an initial pullback off the morning highs, but the longer term (still short term) is favorable for more upside.

 SPY 5 min positive

 DIA 1 min opening indications, also negative off the a.m. highs, but...

 DIA 5 min is positive and supportive of near term upside.

 IWM 1 min intraday

 IWM's 5 min is positive and...

 The 10 min is as well, this is one of the stronger averages for underlying trade.

 QQQ 1 min negative off the a.m. highs and now positive intraday

Also supportive on the 5 min chart for near term trade.

The longer term charts are still very much negative as I expect some nasty downside not being too far off, I do expect near term upside first, but as mentioned, the charts look progressively worse and in my view like we see near term upside, but the next break could be a deep one.

Here's an example...
This is a SEVERE change in character on the 60 min QQQ chart and this is why I want to ride any short term higher, but keep positions pretty speculative in size and be prepared to sell short in to any price strength, GOOG being a perfect example.

Futures

As I said late last night , "If Something is Going To Ramp the Market- Look to the Yen"

"A huge move down in the Yen, that kind of move is news and the news is right above, the BOJ's time for talk is over, now it's action. The Yen carry with the USD ramped the market overnight a couple of days ago so it's possible."

"I'm not going to post anymore because the Yen is changing everything. I see the EUR/USD starting to move up, I'm pretty sure this will change a lot, give it some time."
2:11 a.m. Thursday April 4th

And...
 The EUR/JPY carry shot up right as I was posting and continued to move higher overnight after the BOJ action

 The USD/JPY carry also shot up, reducing the cost of carry.


 Even the EUR/USD moved, but this has to do with a lot of things from the BOE to the ECB, in any case, higher is supportive and we are seeing a move higher.

 ES 1 min ramped overnight and right around the open.

 ES 5 min has shaped up and looks a lot better than last night.

 NQ 1 min also has a positive divergence after ramping most of the night.

TF/R2K futures also have a nice positive divergence.

Also as suspected, yesterday's Dominant Price/Volume relationship is also supportive of higher market prices as explained last night.

So far, the market looks a lot different than it did at the close yesterday. The SPY positive Arbitrage is also active.