Wednesday, April 18, 2012

Wednesday nutshell

What a difference 1 day makes if you really believe the market rallies Tuesday because of some short duration Spanish debt auctions went well. Today as we received more information on the gaping hole that is capital shortfalls and non-perfoming loans in Spain and Italy, 10% of GDP for Spain and accelerating as the housing market is quickly falling apart.

EU banks have had liquidity problems for at least a year now and despite LTRO 1 and 2, they are still underfunded by up to 60% of their market capitalization. What to do? Issue nearly double the shares? Sell assets that have already been sold? Pledge assets to the ECB that have already been pledged? This is an exponential problem that is not getting any better and as we saw in the US starting with Bear Stearns, 1 bank's failure can have ripple effects that no one can predict. By the time Lehman was on the coals, GE, not the finance division, the entire light-bulb making (and more) corporation was having trouble accessing funds to finance day to day operations and in the US, corporations only count on 30% of their funding from banks, in the EU, the average is closer to 70%.  You might call it the ripple effect, but it is more akin to a tsunami.


ES is a bit interesting tonight,

 We saw a 3C premarket positive divergence that ran ES to intraday highs where a negative divergence took over, tranaslation-any bit of price strength they can create is being sold in to. We see an after hour positive divergence in ES tonight, apparently it seems they are trying to dump assets again before the Spanish auction.

Look at ES's VWAP, positive divergences at a standard deviation below VWAP and selling a standard deviation above. The volatility and chaos in my view is caused by funds desperately trying to shed assets and/or get short the market and doing it on extreme volatility, forget tracking VWAP, they are moving ES a full 2 standard deviations top to bottom.

Commodities were the odd man out today, lots of weakness relative to the SPX. High Yield Corp. Credit STILL looks somewhat supportive of higher prices, maybe the Friday SPY $140 pin isn't that far off the mark?

If you take a look at the market and overlay AAPL, as I suspected, AAPL is the market-this is the end game we expected as this bounce got started.

You should see what was done to the NASDAQ Futures, they ran with AAPL in the afternoon and then dumped the entire day.

In after hours tech did well on earnings, this may give some weight to the $140 Friday SPY pin on opt. exp. MLNX, EBAY and FFIV all are up big after earnings tonight.

Internals were nothing special today, lower than average volume, decliners outpacing advancers, new highs outpacing new lows.

The bottom line is the underlying risk asset indicators, 3C, Credit, etc are all falling apart. I was worried about the 15 min charts not giving a clear signal, but if in fact we do see a SPY $140 pin, then at the rate the 15 min charts are deteriorating, we should have a very clear signal which is a relief. All other asset classes are diverging just like I expected them to except HY Corp Credit which is leaving enough room for that possible SPY $140 pin and I have to say, if we get that $140 pin, then the entire reason for the bounce will have been well justified as we originally defined the reason on April 10th. I feel pretty good that even through all of this volatility, nearly everything we have expected to see has materialized, it feels like we are dialed in to the market very well at this point and from what I've seen on some other retail trading sites, the crowd is at an absolute loss, not knowing which way to go, while the macro theme we presented has unfolded almost tick for tick. We've even had probably a dozen quick options trades making 7-200% during all of this craziness.

Spain will most likely define ES overnight and then we have the US economic data. We clearly have enough volatility to have a big day down if it comes to that tomorrow and still be able to see a $140 SPY pin on Friday.

Take a look at the VIX, it has a beautiful rounding area and a little bull flag, it looks perfect for our macro theme regarding what comes next after the bounce concludes.

So tomorrow we'll continue to look at ideas, but I'm not going to get too caught up in the market action with expiration on Friday.

All in all, I have to say I'm happy with our analysis from the 10th and the way things have unfolded thus far, as I said above, it feels like we are dialed in to the market at a time when I would think we'd be most lost.

Keep your eye on the big picture, it's not hard to mis as all of the underlying assets and indications are unravelling before out eyes.


Throwing a Hypothetical Out There

Months ago I went on one of my rants; the issue? The European Central Bank creating a 2-3 tiered bond market.

When Greece needed to swap its debt for shiny new debt that would see Greek bondholders lose 50+% on the transaction (after all getting paid 50% is better than a default and getting zip-unfortuantely Greece probably won't be able to service the new debt either and that is why at last check it was trading at 20% of par) the ECB quickly and as quietly as possible exchanged their Greek debt for new Greek debt without the 50% haircut. Now I understand that the ECB by its own charter cannot finance sovereign deficits, and therefore if they got the same deal as everyone else they would have broken the rules of their charter, but that may have been a better solution. Why?

The ECB, much like the F_E_D, cannot participate in primary auctions, meaning they can't go to Spain's auction tomorrow and scoop up al the debt being auctioned, they can however buy the debt in the secondary market to try to support the yields and keep them from rising to 6+%, a level of interest that no country can afford to pay. In doing so, the ECB can acquire a majority or near majority position in any one EU country's sovereign debt. Greece could not afford to repay the debt they had outstanding so they negotiated (or strong armed is more appropriate) a write-down on their debt. Being the ECB didn't participate in those losses, they did enormous damage to the bond market and killed the decades old concept of equal and fair treatment of bondholders, thereby creating a senior and subordinated class of debt, senior if you are the ECB, subordinated if you are anyone else.

Knowing that  Italy, Ireland and Portugal will likely seek fair and equal treatment-the same deal the Greeks got, it created a situation that I said back during my rant would comeback to bite the ECB in the rear end.

Now bondholders or potential bond buyers know that the more debt the ECB holds of any one country, when it comes time to restructure to get their debt loads down to 120% of GDP, the only debt that will be written down will be the subordinated debt and not the ECB. So if for instance the debt load needs to be reduced by half and the ECB owns half of the outstanding debt, the losses the bondholders will take will be proportionately bigger according to how much debt the ECB holds as only the subordinated debt will be written down, not the ECB's. Would you want to be a buyer of debt knowing there are no more protections, knowing that when that particular country goes for a debt restructuring, you will lose more money and only your debt will take the losses needed to get that country to 120% debt to GDP?

Probably not.

There fore the French/Germans and ECB thought they could fix the situation by giving banks a 3 year 1% loan and fully expected the banks to take these LTRO loans and buy debt with them, the problem is, the banks in the EU are already undercapitalized, this 1% money is exactly what they needed to shoe up their balance sheets and they knew they'd ultimately get screwed when the next country approached a default and had to restructure debt. As a result, the ECB saw record inflows of deposits from banks that would rather pay the ECB to keep the money safe than to try to go out and make some money buying sovereign debt. The plan backfired, but several shorter dated debt auctions like yesterday's in Spain have gone through ok as some banks know that they have a 3 year loan and if the debt matures before the 3 year loan, they "should be safe". Anything longer than the 3 year loan and they are on their own, this is why tomorrow's Spanish 10 year debt auction is such a big deal, it could fail miserably sending Spanish yields way past 6% and putting Spain in the position of needing a bailout, one that the EU cannot afford. Spain literally could be the last domino standing.

So here's what could happen and while we'll never know for sure, the results of tomorrow's auction should give us a pretty good idea. When Italian yields were moving to 6 and even 7%, somehow mysteriously they conducted a primary debt auction that had a yield lower than that of what was seen in the secondary market. Manipulation was suspected, being the ECB can't directly participate in the auction, it has been thought that the ECB may have transferred money to several banks and had the banks buy the Italian debt on the ECB's behalf, of course without telling anyone as that certainly is at best a very grey area and would defeat the purpose of a successful auction if everyone knew the ECB was behind it.

The Spanish auction tomorrow may arguably be one of the most important auctions the ECB has seen, should it fail, yields will rise, Spain will not be able to repay their debt, they will not be able to go to market to issue new debt and they may be in danger of a default, one the Euro-zone can't afford to pay for, unlike their smaller neighbors in Greece, Ireland and Portugal.

So the pressure is on, should the ECB do what I laid out above (what many already suspect they did with Italy), then the auction should come in fairly strong. Should they leave it to the market alone, the auction will likely fail. In fact, not that I have heard this, but it wouldn't surprise me if the auction was cancelled at the last minute as the results could be catastrophic for the entire Euro-zone.

It never seems to fail, every EU fix creates a bigger problem. This is the one problem they can't afford. You can see how this could have consequences for the US markets as many of our financial institutions have branches in Europe, not to mention the chaos it would create in the world economy.

I almost want to stay up late and see how this goes down, I probably won't bother though because since I said the EU will be back in the spotlight about a month ago, the trends there have deteriorated rapidly. Yes, they will kick the can for as long as possible, but it doesn't take a genius to see how this will ultimately end.


Market Update

No charts to save time.

The DIA 1 min has remained ugly today. The 2 min has a relative positive divergence, not big, not something I would bet on. The 5 and 15 min charts have grown worse today in the DIA, it looks like a train wreck.

The QQQ, the 1 min sold in to that last bout of intraday strength, the 2 min is fairly in line, the 5 min is not so nasty, although it has a negative bias. The 15 min is falling apart as I hoped to see.

The SPY, 1 min is in line, the 2 min remains leading negative. There is a little slightly positive surprise on the 15 min, maybe financials rotate in tomorrow? The 15 min is deteriorating, not as bad as the others quite yet.

All in all, we are seeing exactly what I hoped to see.

Tomorrow's events...

Today was exceptionally light on the economic calendar, tomorrow won't be the same.

In Europe we have 10 year French and Spanish Auctions, they fall outside of the 3 year LTRO window and they are not expected to go well, however it wouldn't be the first time the ECB has found a way to manipulate the auctions and right now the ECB really needs Spain to come in half way decent.

Here's the economic Calendar for the US.

Today was VERY light, tomorrow we have Jobless Claims, Existing Home Sales, the Philly F_E_D Survey and Leading Indicators. The trend in US economic data has been bad, sticking with the trend, I would have to guess the data comes in poorly, I would also guess the Spanish Auction comes in poorly, which could very well set up a volatile and nasty open.

We can't completely ignore what the SPY April options expiration data is telling us, it suggests SPY $140 for a close Friday. So is it possible we see a horrible day tomorrow and a huge day Friday?

I think this will answer that question...

I'm not putting odds on it, but yes, from the recent volatility it is absolutely possible. I still don't want to be long the market, but I just want to give you an idea of what is possible based on what we know right now.

I'm going to try to get 1 more market update out before the close.


Trade Idea-CBOE (Short)

When I throw out a bunch of trade ideas it doesn't mean you should be trying to take them al. I usually have a set of circumstances I'm looking for to happen that would make the trade worthwhile. This is the difference between chasing trades and letting the trade come to you on your terms. Thus it is best to have a watchlist of the ideas and set price alerts for the key areas in which we are looking for something to happen that would set up a low risk/high probability trade.

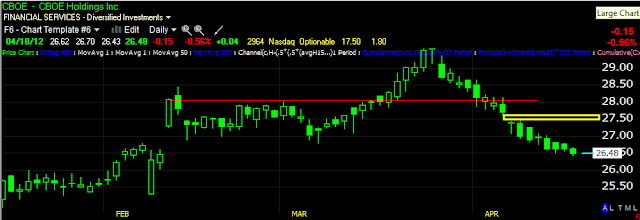
CBOE at first looks like a long shot, looking a bit deeper, it may not be as much of a long shot as it appears.

 CBOE has a strange, undefined top formation, but there seems to be a clear resistance level that was broken. There is a gap right around $27.50, the concept here is simple, CBOE looks oversold compared to the market and the market rarely leaves gaps open, so the target area is the gap at $27.50.

 The daily 3C chart with distribution in to a somewhat parabolic rally and the typical end of a parabolic rally, the decline.

 The 60 min chart is negative, but within that leading negative divergence there's a smaller positive divergence, this is what gives the trade a chance of making it to the gap.

 The  30 min chart showing selling in to the parabolic run up and a positive divergence here.


The 15 min is the same, look for CBOE to rally in to that gap, we can take a closer look at it if it gets there, should there be distribution in to the gap, we have ourselves a likely trade.

GS Trade Idea (short)

This is one I wanted to get to, but first let me say, be careful not to have too much exposure to any 1 industry group or related groups, for instance, you don't want to have a large position in GLD , SLV and GDX as they all tend to move together-if you want exposure to all 3 you are better off treating them as 1 trade for risk management purposes. That means if your risk management rules allow you to invest 8% of your portfolio per position (I typically like to have about 6 positions, over diversification can hurt portfolio performance) then you should divide the 8% between the 3 positions rather than have 24% in all 3 positions as they tend to have a high correlation.

OK, on to GS...

 GS in a small top-like formation, really GS hasn't done much of anything for the last 6 weeks.

 To the right of that formation is a very obvious resistance level, I personally would like to sell GS short in to price strength, so a break above this level would be the head fake move I would be looking to enter to reduce risk and get better positioning. A break back below that level is what traps bulls and creates the snowball effect.

 Even using a VERY wide 3 day trend Channel, GS broke the uptrend at the red arrow.

 The daily 3C chart has been in a relative negative divergence through February and has been leading since March.

 Here's the accumulation or cycle to run GS up, note the leading negative divergence as GS was most likely sold and shorted in to that price strength.

 The last run in GS had a leading negative divergence on this 5 min chart and fell fast, right now we have an intraday 5 min positive, this makes me think GS may be planning a head fake move above that resistance level mentioned.

The 2 min chart shows the same.

I'd set price alerts if you are interested, I will do the same. What I want to see is a break above the resistance level with a strong negative divergence in to the breakout, that's where I'd want to short GS.

AAPL Update

As we expected last week, Tech would be the last to rotate in and AAPL would need to get off its butt do allow that to happen, guess who is leading the move in the market right now?

As soon as I'm finished with this post, I'll be opening an AAPL short position, leaving room to add on further upside gains, at this point $614 or $640 doesn't make a whole lot of difference to me when looking at the long term charts of AAPL.

 Volume volatility is not at all consistent with a breather or a consolidation in AAPL as many of the AAPL bulls are hoping for. We are above both targets that we were looking for, even as they seemed unlikely last week with AAPL's poor relative performance, eventually we got out guy here.


 AAPL 1 min with an intraday positive divergence, this probably explains why the market is not seeing the same positive divergences and instead just drafting off AAPLs weighting.

 AAPL 2 min is still leading negative here.

 The 5 min chart shows the distribution in to the bounce, there' an intraday positive divergence, other than that, AAPL 5 mi is in line only.

 The 15 min chart has finally started to fall apart, AAPL moving up as the 15 min moves down is exactly what I was afraid we wouldn't see, but it appears now that we will see that 15 min chart divergence in AAPL

As far as entries in AAPL, I don't have much time to place trades, sometimes I have no time, but whether AAPL is at $612 or $640, this chart makes me say, "it's pretty much short term, somewhat myopic semantics". Selling/Shorting in to strength is what I want to do, AAPL is offering up that chance, hopefully it will offer up more in to Friday, but for the time being, I'm at least going to get a position started using equities short.

Update of the risk layout...

I'm not going to waste time with charts, you have an idea of what they look like.

High Yield Corp. Credit is selling roughly in line with the market, it isn't diverging badly locally, although on a longer term basis it has a large negative divergence vs the SPX.

The Dollar is broadly supportive this afternoon of risk trade, we'll have to see if the SPX takes advantage of this bit of weakness in the dollar to move higher on a legacy arbitrage basis, even if the market does take advantage of this disconnect (weaker dollar offering the market some upside potential), judging by the market update and the 3C charts, nothing is going to get better and I would continue to look to sell in to strength or rather short in to strength.

Actually just as I wrote that paragraph, I see the SPX is moving up and taking advantage of the dollar weakness, this is NOT on any 3C support.

The $AUD is leading the SPX lower, it is a good leading indicator and it has diverged negatively from the SPX, these are the signs we have been looking for to call the end of the bounce.

Yields are also leading negatively vs the SPX, another decent leading indicator and another divergence we expected to see to help call the end of the bounce.

The move up intraday in the SPX that is happening a I write this is being led by Tech, financials are not showing the same momentum that tech is on a relative basis, financials continue to be out, tech continues to be in. GS is a short play I was meaning to look in to closer, but for quick leveraged ETF coverage, FAZ or SKF would give you short exposure to financials.

High Yield Credit is flat on the day, slightly down, however since yesterday's bounce it has a very large negative divergence, again what we want to see.

Commodities thus far are not moving with the SPX even though the dollar is weaker, we'll see if they take advantage of the weakness.

All in all, we are now seeing the clearer signals that suggest the bounce is in its last stages.

The options expiration pin at $140 would be an absolute gift, I hope we can get there. All of the underlying indicators are now pointing to the negative divergences that we look for to identify the end of the bounce.

Here is context for ES, I warned it would flip from being supportive to going negative, it is getting much worse.


Market Update

The market is looking HORRIBLE, I hope you've been able to use recent strength to get in to some short positions and if we get anymore strength, I would use that as well.

 The Dow looks the worst, which fits with the large cap weakness I mentioned, if you need quick coverage on a short term basis, the leveraged large cap bear ETF, BGZ would be a good choice, although I would prefer to only use that until you can enter some real equity shorts, it's just east in a pinch.

The 1 min chart is leading negative today, this appears to suggest even as the market has held in a range, smart money is desperate to get out of this market.

 Look how they used the bounce to sell / short in to on the 32 min chart, this is about as ugly as it gets and today continues to lead negative.

 DIA 5 min chart, leading negative and using yesterday's strength to dump

 The DIA 15 min chart is by far the worst looking, it is relatively divergence in a huge way and leading negative divergence. You may even want to consider a leveraged short on the Dow like SDOW (you buy it long for short exposure).

 QQQ 1 min, same story, leading negative after Tech rotated in for a single day.

 The 2 min chart continues to lead negative even as the market holds in a relative range


 The 5 min doesn't look as bad here, maybe there's some more upside in Tech before the week is over, but I would certainly be looking at getting my short positions started or adding to them as should have been done in to yesterday's strength.


 The 15 min QQQ is leading negative, any movement up in the Q's will make this divergence even worse.

 SPY 1 min is leading negative intraday

 The 2 min chart shows how they used the strength yesterday to sell/short in to.

 5 min is leading negative.

15 min is leading negative.

If we are lucky enough to get a SPY $140 options expiration pin, I would be selling that short all day long.

Big Blue-IBM Trade Idea (short)

I have some signals showing large caps moving out of rotation, I'll look closer at large, mid and small caps, I suspect midcaps may be moving out as well.

Take  look at IBM, this may not be everyone's cup of tea, but the size of IBM can give you large cap coverage and there' certainly a lot better liquidity if you are looking for an options play.

 IBM is a great example of not only the volatility bounce, but a head fake play. In the white area it is obvious that there was a resistance/support area around $206, the gap down and subsequent break of $206 kept IBM right below resistance, this is where shorts would have seen multiple failures of the test of resistance. Yesterday's move up to fill in most of the gap was a very strong move for IBM considering it Beta, shorts are knocked out, maybe some longs jumped in and IBM took them all out yesterday and today.


 We do have today's gap, the market has been pretty reliable about filling gaps, that is where the ideal trade would be, but looking t the bigger picture, IBM is still in good shorting position even here.

 MoneyStream on a daily chart is severely leading negative.

 The 15 min 3C chart of IBM telegraphs all of the moves very well from strong distribution to accumulation for yesterday's bounce, right now it is in line, not leading negative, not positive, but in line, which could afford IBM some upside breathing room. It appears very obvious to me that smart money used yesterday to sell/short IBM when looking at the depth of the negative divergence.


 Here's where IBM may offer a bounce in to the gap, which would be a better place to phase in to shorts, the downside momentum seems to be falling off as some intraday 3C support on the short term charts comes in to play.

 Again, look at the depth of that negative divergence on yesterday's strength, smart money is apparently moving out. We also see a positive divergence developing in IBM on an intraday basis.


The daily Trend Channel has held IBM's trend very well, it would suggest a stop some where around $206.50, that would also seem to be an ideal area to look at phasing in to some short in IBM.


USO showing positive divergences again

Wednesday's EIA reports are a strange experience, we have often had many good counter trend or counter assumption plays, as well as being one of the seemingly most leaked reports.

Since I added some new calls to USO before the EIA report at 10:30, USO has taken a pretty nasty intraday dip, this wouldn't be the first time I have gone through this with USO and still managed a profitable trade.

Here are the most current charts.

 1 min leading positive

2 min leading positive.

I can't say I see a catalyst in the $USD at this point, but I'm still hanging in there with the May calls.

BEAV Trade Idea (short)

I have a lot of charts I have picked up through a quick scans that I'll be reviewing so I may be a little late on email responses, if you have an urgent email, please put 'Urgent" in the subject line.

I've been looking at BEAV and like this as a potential short sale candidate, here's why...
 BAV has already topped, as you know I never like to short a stock on the first break of support as the market trend has been pretty consistently coming down on the side of volatility shakeouts, it doesn't mean that the top pattern isn't reliable, it is just tactical positioning and shorts who follow the dogma of technical analysis that tells them to short a break of support or a failed test of what is now resistance, has been not working for some time. The volatility shakeout after a break of important support knocks a lot of shorts out of their positions, but since we are aware of it, we can use it to our advantage in getting better tactical positioning (the higher we can short, the less risk there is, although it is emotionally difficult to short in to strength, it is often the correct course of action). Furthermore longs typically will come back in to the mix after having been throughly brainwashed to "Buy the dip", which adds extra downside momentum when the stock breaks again below support. The GLD had fake trade is one of the best recent examples of this.


 Note the small triangle with volume confirming just below resistance, this is taken by technical traders as a continuation consolidation, they will typically short this pattern, a break above the triangle will stop a lot of those shorts out, but give us a better entry.

 The 60 min chart is ugly, I have little doubt BEAV is in trouble here, that doesn't mean a volatility bounce can't be executed in the near term and with that triangle so mature, it looks like it will come sooner rather then later. Note the gap area, this is right in and around the resistance area, a move in to or above the gap would certainly be worth investigating further for a short entry.


 The 15 min chart has a slight leading positive divergence suggesting that BEAV will indeed break to the upside, the opposite of what TA traders would expect.

The 2 day trend channel has held BEAV well, it has already broken the uptrend last Friday, the current stop would be in the $46 area, although depending on how it plays out, I would be willing to give it more room if an entry can be had in the area.

I would suggest setting some price alerts for a breakout of the triangle and above resistance. I'll have this on my watchlist as well.


TEVA Analysis

TEVA looks like one to keep on the radar with some price alerts...

 On a weekly chart you can see clearly a top in TEVA that has been broken.

 Looking closer with a 1 day chart, TEVA has entered a lateral consolidation just below what would be considered the neckline of the top or resistance. With the market's penchant for trying to shakeout positions, this is an attractive target to for the market to try to break through, it is similar to the head fake move we played in GLD for a 215% return in several days, except this lateral zone is much bigger than GLD's , much more apparent and a juicier target.

 Here's a closer look at the area I'm talking about. TEVA would only have to move to the $46.50 area to start a head fake move that may very well be worth playing. TEVA is less than 1.25 away from that area.


The daily Money Stream chart shows TEVA's decline, it is also negatively divergent right here at the lateral consolidation zone, which is just under resistance.

I would certainly set some alerts for a move above $46.30-$46.50, should we get such a move, we can quickly check it for distribution which I'm nearly certain we would see. These false breakout moves tend to be some of my favorite set ups as they are lower in risk and they tend to move very fast and very far. GLD was only a very small head fake breakout, yet it returned 212% in 3-4 days. TEVA could certainly have a more volatile failure.