Friday, November 5, 2010

Going into the weekend....

Today can't really be considered a follow through day from yesterday's move, so the possibility of the "Fed Effect" reversal is still a possibility.

As I said earlier this morning, "Should the XLF fall, then the correlation between the dollar and the market should come back into play and be the primary driver of the market."


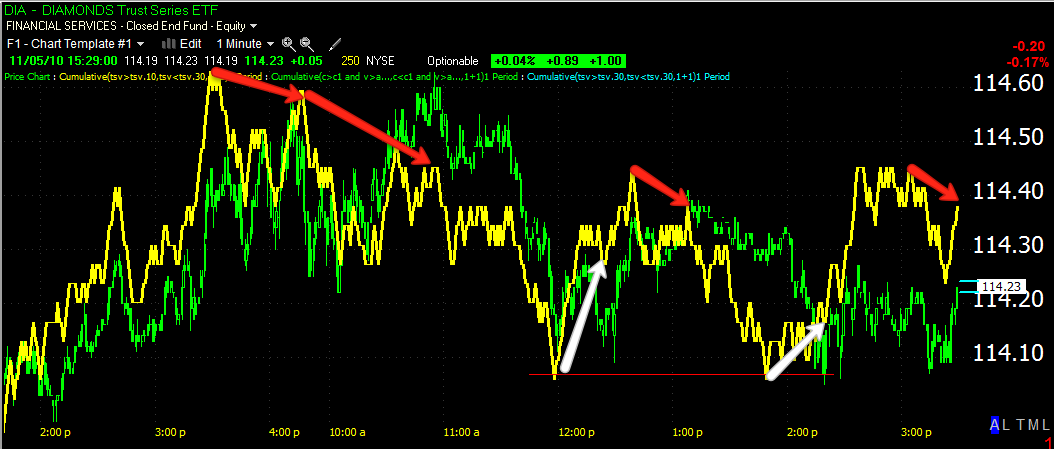
Because there's such strong correlation with the dollar, the market is not in a great position at this moment with the dollar having gained strength, but the XLF didn't give up much ground today, even though many banks did in intraday trade-still XLF refused to budge.


XLF needs to break below the bottom arrow around $15.45 (support)


 BAC 1 min today

 GS 1 min today

JPM 1 min today.


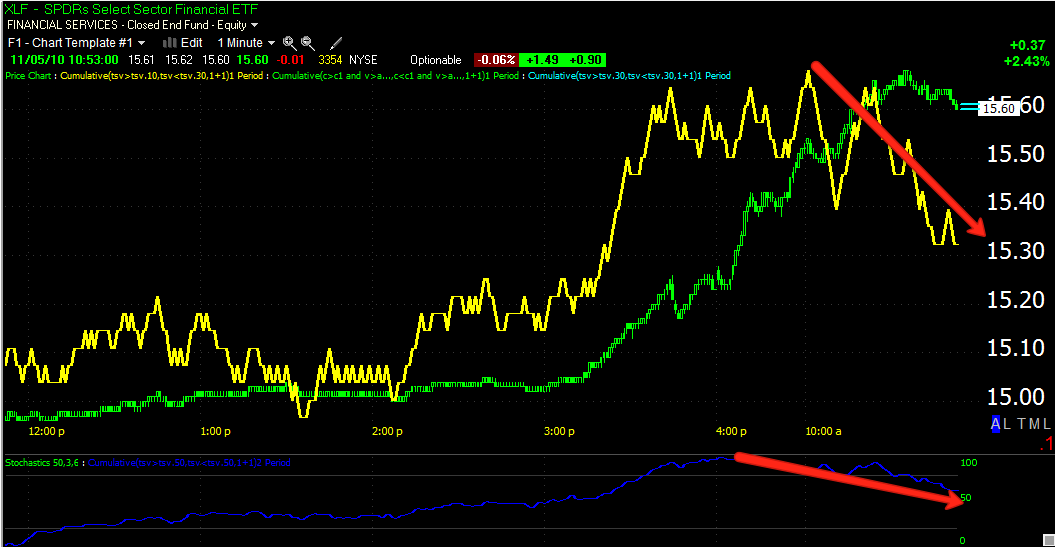
It looks like the banks were seeing distribution today.


Here's what the currency chart-EUR/USD looks like as the Euro gave up substantial ground today.


Correlation between the Dollar and the market has been around 85%-90% so if this trend in the Euro holds, it doesn't bode well for the market.


Here are the 3C charts going into the weekend.


 The DIA 1 min sitting at support

 DIA 5 min shows distribution

 QQQQ 1 min shows a large leading negative divergence

 As does the 10 min chart-again, it appears to be distribution throughout the day.

 SPY 1 min weakened significantly from the open on a negative divergence.

The SPY 5 min is also showing a negative leading divergence in the red box. 


All in all, it looks like there was distribution throughout today's lateral price trend.


I'd expect we will see POMO front running into the close as Monday is the last POMO of QE1.


The key will be the submitted to accepted ratio at 11 a.m. 


UUP on the 60 min is showing positive divergences, while GDX is showing negative.


MELI

Here' another short trade that is shaping up-MELI


Since I'm of the opinion that conventional indicators are used against technicians, when I use them, I tend to use them in unconventional ways. For example, this MACD is set at 52/104/9 which better shows the trend without the noise and it's something that probably few if any other technicians are looking at. You can see it went up in confirmation of the trend and then went down in the H&S top pattern with a negative divergence. I think intraday it has some room to bounce a little, but when the trend line is broken to the downside, I would consider phasing into this short position. As it moves further away from the neckline and completes it's first lower low, lower high and starts down again, i would fill out the position as you then have confirmation that is pretty far out of reach of any black box manipulation. The first target is around $45, but the measured move implications often exceed the target more often then not. At that point you can re-evaluate whether you want to keep the short or use something like the stop channel to give you an objective stop out price. 

3C shows white arrow positive divergence or accumulation on this daily chart, then confirmation of the trend right up until September. Right now, I'd just be looking for the break of the neckline although some people prefer to try to get in at higher prices, I just don't think the extra few percentage points are worth the risk:reward equation.

A Few More Trades.


 PFCB is in a bear flag after a hefty decline. These are obvious black box patterns to manipulate so I would only consider this as a short when it breaks down below the bear flag, and even then I may still phase into the position in case of more head fake volatility, but ultimately it looks to me like after any black box volatility, this trade wants to go lower. MACD is negative on a very long scale-52/104/9 and the volume is correct for the price consolidation. The initial target would be around $40 at this time.

 SHZ, despite today's gains on rising volume, looks like it's pulling away from the pullback. Especially if today closes near the high, I'd think there's a very good chance of seeing a similar follow through move Monday or early next week. 3c/MACD and volume all look good on this one.

TBT is a less leveraged (2x) version of the TMV trade which is up over 4% since being featured yesterday. There are breakouts in both from their bases and look like they are bracing for a move higher. Stops depend on you risk tolerance and risk management, but under the recent pullback low would be a decent stop with room, under the breakout level at the red horizontal line is a bit tighter. Again, MACD, Volume and 3C look good on these trades and TBT's initial target would be around $38-$39.

Back into MSPD?

Or add to if you already were short?

After that 18% drop in MSPD we saw a little bounce, right now it's in a negative divergence and threatening to break a support level (red trendline). It may be a trade you want to consider as I think it stands a very good chance of a continued downtrend

Euro/Dollar

Here's the Euro/Dollar chart

The first red arrow is where we were before the Euro gained, which is a large part of the reason we gapped up yesterday. As you can see presently, nearly the entire rally has been retraced. If the correlations that held yesterday, hold today, and the euro keeps declining, we should see the market move down fairly significantly.

The Q's did not react as strong late yesterday or this morning as did the SPY and I believe that is because of limit order buying being filled this morning on the XLF. Should the XLF fall, then the correlation between the dollar and the market should come back into play and be the primary driver of the market.

Update

Here are the current morning charts.

 DIA

 QQQQ

 SPY

XLF

Trade Alert

I have mentioned that I like the idea of starting a position short in JPM and either starting or adding to the BAC downtrend already intact. With this morning's XLF action , which I think is limit orders placed after retail saw the rally there, that are being filled, this may be a good opportunity for a low risk short entry.

 Here's the Stop Channel on a 3 day chart for BAC-the upper channel line's lowest point is the stop, so it's near $13 while BAC is near $12.48-a little more then $.50 risk for a trend that has been in effect for more then 2 quarters. I showed this trade about a week ago and said if we got close to the upper channel, it may be a trade on the short side you may want to consider, the closer to the channel, the less risk as that is your stop.

I also showed JPM's trading range and said I'd like to look at initiating a position there near the top of the range, but I would not fill it out until it broke below the bottom of the range (confirmation), well here we are. A stop can be placed above the top trendline which lowers your risk on the trade so long as you observe risk management/position sizing.

I don't know if XLF will carry a much higher as I do believe it's limit orders being filled so if you like the trade, you may want to take a look at it.