Thursday, March 21, 2013

A Quick Peak

Taking a look at futures and FX, all is relatively calm as it seems the market awaits the next plan out of Cyprus, "Good Bank/Bad Bank" and their Solidarity Fund to be voted on, I suppose by tomorrow morning we'll have some idea or more likely the vote will have been pushed off. Tomorrow is also the typical op-ex (even the weeklies now?!?)

There is zip, zero, zilch on the US economic calendar, so it looks like it's going to be all about Cyprus and op-ex pins.

As usual, if I do see anything sticking out, I'll let you know. These markets that are full of fundamental surprises are always interesting because it's one of the few times you can see real, true market trepidation and fear.


Flight to Safety Evident

While the market uses any lever it can to get the SPX up new nominal all time highs, where as I mentioned earlier, transaction costs alone should make it worthwhile, assuming there is still some interest and volume.

However, the flight to safety is evident everywhere. Credit may be being used to try to pump the markets and they seem to be trying really hard and not getting too far, but the distribution in them is already done, furthermore, the credit markets have a very itchy trigger finger a the slightest appearance of SPX/ES/VWAP failure has seen them make some big sell moves.

TLT has seen a lot of 3C accumulation and even price appreciation, volatility has as well as you have seen over the last several weeks. The fear is evident in the way stocks like ORCL are being sold off, sell first and best and ask questions later. Swiss 2 year rates hit a new low with a negative yield, that means people are willing to take a small loss to park money in a safe place.

The Cyprus situation is no where near resolved and getting worse by the day with today's ECB deadline of Monday to accept a deal or lose all funding, likely sending Cyprus in to default, Russians sweep in and pick up everything on the cheap including a new naval port and more than just EU currency dynamics have changed. Then we have our own uncertainties in the Us as a number of economic reports are showing, consumers are afraid of what Congress might or might not do.

Today's EU PMIs were a much bigger deal than most would think, especially the German one, German attitudes are going to change very quickly about these bailouts and Merkel knows it (not that they haven't already), Germans will soon be feeling the same pains as the rest of the EU.

I have to take my wife to a Dr. appointment, but I'll be back to try to make some sense of what's going on in Cyprus as is changes by the hour.


Market Update

There are still a lot of risk assets holding together here so it's little wonder the CONTEXT model is above ES.

Here are some charts.

 SPY 2 min is coming along, it just needed it bit of a range, really no different than yesterday's close except the opposite.

 VXX 1 min isn't doing anything spectacular at all

 VXX 2 min continues to move to a worse position, although this isn't a big deal for anything beyond the immediate future.

 QQQ 1 min is moving to a new leading high

 And the 2 min is leading

 TLT, the flight to safety is seeing some mild movement out, longer term though it' still not a problem, just more immediate.

60 min TLT.

Here's an example of risk assets moving Context like yields...
Notice the difference vs the SPX between yesterday's close and today's lows of the day?

Quite a few risk assets are like that, again short term.

More on the SPY

I'm sure you'd like to know what tipped my decision on the SPY, it was partly volatility too which has been spot o this week.

 SPY 1 min is positive now on the entire day

 The 2 min doesn't look good, but that right side might pick up.

 The 5 min hasn't broken down yet, so there's still support in there despite the intraday volatility.

 At 10 mins, here's the rot, each average has it in different places, but all have it and a lot.

 VXX 1 min looked good, but as I said, it couldn't confirm on the 2 min

 2 min VXX

The 10 min looks great, so for me it looks like a quick pop up and a bigger move down, the same though as AMZN or GOOG.

Risk assets support this in the short term any way. The CONTEXT model supports it short term and the SPY arb. model looks like it's about to flip to the model leading the SPY.

The Fill

March 28 weekly SPY $155 Cal @ $.98

Opening Very Spec SPY Weekly Call

This is for next week, the 28th, strike probably 155

Leading Positive-I'd almost trade the weeklies here

If there were confirmation in at least the 2 min charts, which for most averages there isn't, I'd consider trading weekly calls, next week's expiration for the SPY.

 SPY 1 min leading positive now, all the risk assets were leading the market at 2 pm lows.

 SPY 2 min doesn't have any support though, this is what I mentioned earlier.

 DIA 1 min, leading positive, the 2 min has a little support

 QQQ 1 min leading positive

QQQ 2 min no support.

I'll see how they develop, maybe it will be worth a trade with a few more signals confirming, but it's like a nice shiny 1 min chart developing and rot under that.

CONTEXT Speaks

Just like the SPY Arb, CONTEXT for SPX futures is showing the model above ES, my opinion is still this is about new nominal highs for the SPX as it is so close, there's a lot of transactional money alone to be made there.

Model in green, ES in red.

I won't post all of the charts in the Risk Asset Layout, but give you a feel.

HYG is holding up much better intraday, it didn't make a new low at 2 pm like the market and as such is probably part of the support system, we know it is for the SPY arbitrage. Junk Credit is holding relatively the same, it always seems to trade with HYG.

The Euro is holding up better and was already making a higher high at the 2 pm lows for the SPX, so intraday its leading and the correlation between the two assets this week has been VERY close. The $USD on the other hand is making lower lows and highs as it trends down, again supporting the SPX/market. Yields are off their lows of the day and at 2 p.m. were making a higher low. HY credit hasn't moved down at all, it's been straight across with support all day.

Even commodities are playing along and leading the SPX.


Another Short Term Signal

I've been watching this one closely; the VXX looks good on the 1 min chart ad the longer charts, but is having a really tough time confirming on the next level, a 2 min chart.

There's good accumulation there, but I don't think this is the move it's meant for.

Market Update

Here are the charts, the short term / intraday looks to be feeling around for a bottom like I said, but some of these longer term intraday and even 5 or 10 min charts are really starting to get scary. If I can get a good pop out of AMZN, I may take it in a hurry, but I still think they must take a shot at the new SPX high, this seems to be what this is all about.
 DIA 1 min

 QQQ 1 min

 IWM 1 min

 SPY 1 min

 ES 1 min

TF 1 min

Quick Market Update

Both the averages and the futures are going positive intraday, they look to be feeling around for a bottom

Going Ahead w/ AMZN Spec long

First I'm going to close half of the equity short...
It's at a decent little profit, the idea would be to ride AMZN higher and then fill out the equity short as it looks ready to reverse. I don't close all of the position because there are so many potential black swan events.

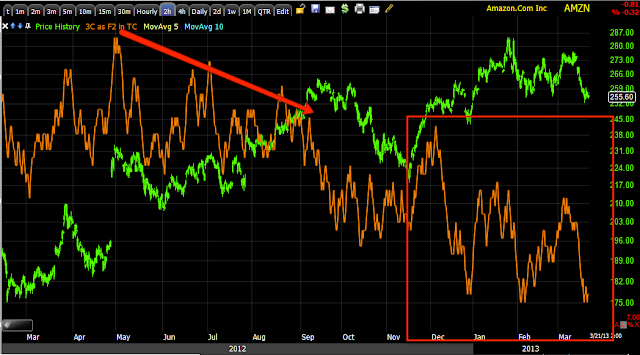
Then I like AMZN April 20th $255 Calls, spec position size.

AMZN Charts

 This would be my upside target on a daily chart.

 1 min is positive

 3 min is positive

 5 min is positive

 15 min is positive

Longer term, the big picture is still to the downside.

I'd have to Close part of the equity short, but I would want to close the whole thing just in case and use monthly options, probably April.

I'm going to consider this a little more.

Thinking about a short term long AMZN Trade

I'll bring you the charts, I'm thinking maybe gap fill.

I'm not opening anything yet, just seriously considering it.

AAPL is seeing some action

It just got started, but I think this move might have some small legs and be worth a quick trade, maybe even intraday, especially if yo can get a small pullback.

Quick Futures Update

ES and NQ futures are starting to go south on the 3C chart, other than that, there's really a lack of movement.

GOOG Update

Although the case for a GOOG bounce  (which is only the minor part of the story as I'm looking for a bounce to short in to or add to shorts) is not as strong as it was several days ago as it has suffered some damage to its charts, there are still enough to suggest it's the highest near term probability.

I'm not changing anything with the GOOG April Put position as I don't see that as being in any trouble from a bounce, in fact it would likely help the Put situation with a bigger, faster move to the downside and the GOOG equity short stays in place, although I'd like to add to that at higher prices if possible.

 The trendlines in the immediate vicinity that matter, the up trend is already broken so is the minor head fake level, it's the $775 level where things get ugly. I'm hoping to see GOOG somewhere in the $825+ area, however I would NOT trade GOOG long, while probabilities are one thing, high probabilities are the only trades I want to take.

 GOOG 5 min positive

 10 min with a relative positive moving to a stronger slightly leading positive

 Basically the same on the 15 min as the 10-min above.

 However this is the trade I'm looking at, the hourly chart deeply leading negative so any chance to sell / short in to price strength in my view, is an absolute gift and this is where the high probability trade is.

The 4 hour chart just confirms how bas the situation is, this could drop like ORCL, the point is fear is picking up, I doubt it's a slow reversal and rend down, when fear hits, it hits hard. Fear is by far the most powerful emotion in the market.

Futures Update

This is not large, but enough to cause an intraday reversal to the upside; there's a small relative positive divergence in ES and one in NQ, R2K futures don't have one.

We should see some upside shortly as intraday trade.
Example in ES...

Opening Indications

Remember yesterday I said that seeing HYG (High Yield Corporate Credit) pumping in to the close to try to lift the SPY (which we had seen earlier in the week as well) was proof positive to me that the high liquidity asset was being used to try to lift the SPX?

Well here's how CapitalContext describes their SPY Arbitrage indicator and what is used to determine the model's value vs the VIX.


 the ‘SPY Arb’ model which identifies a tradable relationship between the stock market (SPY) and its value implied from interest rates (TLT), credit risk (HYG), and volatility (VXX).

Earlier in the week this was my hunch, after seeing market action yesterday I was sure of it, now that I have seen how the SPY arbitrage model is constructed,  have the proof.


 I just mentioned the strangeness in the Volatility (VIX) futures vs the market, the SPY Arbitrage shows the model at a +$.89 differential, this is indicating that according to the value of TLT, VXX and HYG (or any one of those or combination of them)  the SPY should be trading nearly a dollar higher, so my hunch that the VIX (Futures) were likely being used to try to mitigate some of the damage to the market seems to have proof right above.


CONTEXT for ES has a positive 3 point differential. There are many more assets that go in to this model, but it dos contain at least the 3 above in the SPY Arb.

Opening indications-remember this isn't even showing the longer term or more important charts with heavier money flow, these are short term, but the trend can be useful.


 VXX 1 min and the signals it has given for the market a day in advance, but it is still leading positive, protection is bid in a big way.

 Here's a negative divergence within the larger leading positive that sent the VXX lower this morning, sound familiar? In any case, it's better to fill the gap now.

 A close up of the same chart above looking at this morning's open.

SPY
 The SPY 1 min was leading negative yesterday afternoon, the EOD accumulation to try to push the SPY/SPX higher didn't amount to much, however strangely in the intraday timeframe it landed the SPY almost exactly in confirmation, at the trend view level the SPY has more downside to go with the divergence still leading negative.

 And the leading negative divergence in the trend of the 2 min chart, note all the highs that went negative, but worse is yesterday's move leading negative as well as today's price position.

Sometimes people get so caught up in intraday trade, they feel like or write, "Why is this market so bullish", when all you have to do is step back a little bit and it's clearly not bullish/


 This is a series of lower highs and lows in the SPY, how can that possibly be called bullish, especially when taken in context of all of the analysis, flights to safety, manipulation failing, selling at extreme levels...

This upside channel buster tends to end with a volatile, fast move down through the bottom of the channel.

 IWM 2 min trend, there are many charts that are much more important that look a lot worse, but I'm trying to stick to intraday trade.

 The negative divergences at every high and leading negative yesterday and today.

 IWM 2 min close-up looks as if it's possible for an intraday positive divergence, by the time I get this posted it will have changed. **A Quick updated look shows 3C still moving down toward price.

 QQQ 2 min trend with a brief, but strong leading positive divergence that as sold in to pretty quickly, another one on Tuesday at the lows and yesterday is in leading negative position as is today.


The close up of the same chart intraday failing at yesterday's closing trade and again at this morning's 10 a.m. highs if you can call them that.

I think the most fascinating thing though was how I was correct (sorry there's not a good way to say that without sounding arrogant, believe me I am humble before the market) in seeing that HYG which already has shown massive distribution and HY Credit which also has already shown massive distribution and flight, were used to try to goose the market higher, this was from observation day after day and I've just had it confirmed.