Monday, February 27, 2012

A Few Things You Don't See Often

Another mixed basket today with the SPX gaining +.14%, the NASDAQ at +.10%, the Dow at -.01% and the R2K at -.03%, I would call that more or less, unchanged and the market has clearly lost momentum. 

We do have the ECB's second LTRO tomorrow, I think everyone is curious as to what the reaction will be, too big of a take up and there may be some bank solvency fears, too little of a take up and again, there may be some bank solvency fears. From what ECB insiders said last week and today (I'll get to that in a minute), it sounds like this could be the last one; they say because they don't want the bans leaning on the ECB too much, but I think it is because it didn't produce the carry trade (buying sovereign debt) like they had hoped for-instead almost all of the money went right in to the ECB's deposit facility for a negative carry for the banks of -.25%.

Nowotny from the ECB said the following today as reported by Bloomberg:
  • NOWOTNY SAYS SMP IS MORE OR LESS ON HOLD
  • NOWOTNY SAYS 3-YEAR LOANS WILL NOT BECOME A REGULAR FEATURE
  • NOWOTNY SAYS NOT `CONVINCED' ABOUT CASE FOR HIGHER FIREWALL
  • NOWOTNY SAYS ECB HAS PROBLEM OF ADDICTED BANKS

This was around 3:30 and may be causing some trouble for the markets which HATE uncertainty.

Furthermore, theS&P ratings agency cut Greece from CC to "Selective Default"and why?
It may sound familiar...

"We lowered our sovereign credit ratings on Greece to 'SD' following the Greek government's retroactive insertion of collective action clauses (CACs) in the documentation of certain series of its sovereign debt on Feb. 23, 2012."
This is what I've been talking about for weeks, Greece may default before their default date just because of the CACs.
As for broad market action internals, volume was mixed, but close to average, the real change has been in the advancing/declining issues, they have steadily deteriorated day after day. Last Friday the NYSE A/D's were nearly even with a slight edge to advancers, today... decliners outpaced advancers (NYSE 1465/1522 Nasdaq 1137/1372), another notable change in character in the market internals.


Treasuries
TLT in green (Treasuries) closed up +.89% as noted earlier while the SPX closed up +.14%, TLT is certainly not what I would consider a high beta stock and it has an inverse relationship, so it's strange to see it even green. You can see some intraday inverse correlations, but the outperformance of treasuries or as I said, even being green even with a .14% SPX close, is rare. As I have speculated, the yields don't seem to be an incentive, so I'm guessing it is a flight to safety trade. See my earlier post on Treasuries for more details. There's a longer term change in character in treasuries in the linked post above, but in the short term it was noticeable that something was up last week as treasuries were still headed down as they rallied late in the day and then reversed their short term trend.

Commodities tried to hand with the SPX today , but just gave up at the end of the day, the broad commodity index was down -.40%, USO down -1.98% and more on that next.

Earlier I noted the channel buster in USO, not that it was or is a turning point, but as noted these breaks of the channel often result in reversals.

 Here is the upside channel buster mentioned earlier today

And here USO was definitely being watched at the channel as volume surged as it broke down through the channel today.

GLD was mentioned in this update with some 3C negative divergences that sent it closing lower. The red trendline is the area we want to watch, a break below that and GLD could move quite quick on a downside move. If you have alerts I would set them for a break of the trendline around $171.20, it may very well pay-off if you get in early on a break below that trendline as it will represent a head fake move.

The VIX was also green today, even with the market green, even though it wasn't a big gain in the SPX (+.14%) the inverse relationship was not present in the VIX either, which suggests traders are moving from complacency and grabbing some protection (hedging possibly).


The Dow is kind of an interesting story as it just cannot hold $13k
It dipped above and below all day, but gave it up toward the close. I really don't think people give the Dow transports divergence enough credit. I would think in a risk on environment, the first break of $13k would lead to a huge move on volume, it just hasn't happened.

The SKEW Index remains elevated as well (remember the SKEW tries to measure the probability of an improbable even, a market crash or Black Swan event and the higher it is, the higher that probability is. The SKEW has been elevated for nearly 2 months.

As for late day sector movement...
It wasn't surprising if you saw the earlier sector rotation post...

I said Industrials seem to be sliding, which they did and that the more defensive Healthcare looked like it was coming back in, as it did. Financials were clearly in the best rotational position. During the afternoon, Energy, Basic Materials, Industrials, Tech and Discretionary all lost further ground.


I'm going to poke around some more, as well as see what's on deck for earnings trades tomorrow.

HGSI

HGSI came in with a beat, but we aren't looking for beat or miss, just reaction. HGSI is up about 3% and was up over 5%. Hopefully it will move higher tomorrow, but I've already heard from a couple of members who made between $500 and $1,000 in AH so it was worth the time.

We'll see what other earnings plays come up, I'll be watching for them.

HGSI doing pretty well thus far


I warned about PEIX, hope you got your profits there...

SPY EOD

There's a lot of volume in the SPY right around that earlier distribution /churning-like candle.

Looking at the TICK chart for the same period....
There's a lot of volatility and chaos in that same area with TICK readings hitting sub -1000.

I'll have to take a look at everything else and I'll be back with you shortly.

HGSI Options Model Potfolio Trade

I'm going to go ahead and try some March $8 Calls for an earnings play on HGSI

AMRS, not AMKR, my mistake.

I am not convinced this is an earnings leak, rather it looks like AMRS may just be getting under way building a little base, while it could be earnings related, I don't see recent evidence of moves that would lead me to think that is a high probability. So there are only a couple of charts that matter since nothing strange moved today.

 The 15 and 30 min charts are positive, this could even be a bounce reaction from the gap down on the 9th or 10th. I don't see this as an earnings play, but it may be one worth keeping an eye on.

Earnings Play Monday After-Hours -PCLN, HGSI and AMRS

OK, we are pretty close to the EOD, so here's what I see thus far...

PCLN...
 The 1 min chart didn't tell me anything today, I wish it did.

 The 2 min chart today is slightly negative, but this doesn't stand out as an earnings leak to me.

 Longer term the 2 min chart is very negative as I showed last night, but the truth is, this doesn't look too much different then the QQQ, so I'm guessing this is more general market related then earnings, although that certainly is part of the general market tone. The 15th seems to have been some sort of breaking point event, it is noticeable in quite a few stocks, not the least of which is AAPL.

 The 5 min chart hasn't told me much, it is more or less in line with a slight hint of a little positive the last few minutes.

 Longer term on the 10 min, there does appear to be selling, I just can't say it is earnings related.

 Same with the 15 min chart

 And the 30 min, again the 15th seems to be some transition.

Overall on the 60 min it is negative, but this wouldn't be a reflection of an earnings leak, I would say just overall market distribution. I would not pick PCLN as an earnings play, but the stock does look like it has a problem.

HGSI is a little different, this is a bullish play.

 The 1 min chart didn't fall with HGSI today, that is bullish.

 Longer term 1 mi seems like it has been under accumulation for some time.

 The same with the 2 min

 Today the 5 min chart went leading positive on a move down in price, this is bullish.

 And long term 5 min

 The 15 min chart has a strong positive divergence

 As do the 30 and 60 min

I'll update AMKR after this so I can get this out to you. I personally would consider HGSI an earnings play on the long side. The only thing I am concerned about is whether this is earnings related or a drug in their pipeline, the difference would be timing. It's like the RIMM long earnings play we took and they dropped 9% on earnings, but the accumulation was real and they replaced their CEOs a few weeks later and we eventually made a decent chunk of change on the trade holding from earnings.

All in all, I like HGSI the best.

AMKR coming up.

Credit/Risk Assets and more

 Commodities vs SPX (SPX is always green unless otherwise noted), commodities have definitely had a good run the last few weeks, led by crude.

 Intraday today there's a little weakness in commodities vs the SPX as USO is down a bit as mentioned earlier.

 Long term commodities are severely dislocated , you can see when they were in line with the market as a risk asset during the 2010 rally, then they signaled the top in 2011 with a divergence and now are at a severe divergence again, refusing to follow equities higher in the risk on trade in equities.

 As I have mentioned several times, High Yield Credit hasn't made a higher high since the 6th, 3 trading weeks of selling off relative to the SPX.

 And locally today, Credit didn't follow the market, instead it went the other way.

 Rates are like a magnet for equities, you can see them hitting new lows today, not rallying with stocks, longer term they are at multi-decade lows.

 I changed the symbol here to USO just to see how it was performing today vs the SPX. Again, it may be a blip, but today's action in USO should be watched.


 Financials have been deeply unimpressive during this last run as you can see in red.

 Even though they have been lagging, they did go in to rotation in January as can be seen here.

 This is XLE/Energy, again I just wanted to see what it looked like vs the SPX, as you can see, not performing well.


 Here's a recent change in character in financials since they came in to rotation, you can see they are underperforming and look similar to the Dow-30/Dow-20 Transport divergence.

 This is XLF intraday today, which has been pretty much in lock step with the market as you'll see in sector rotation.


 Financials are at the bottom and you can see they are in rotation today or at least outperforming, Utilities have dropped off as you would expect with flows in financials today, Healthcare looks as if it may be hitting a low in its rotation and may move back in to rotation, this would be defensive market action. Energy, which has been strong the last few weeks is clearly off its game today. Industrials seem to be sliding a little, while Tech is doing better today then Friday afternoon, it is still one of the weaker groups relatively speaking, Discretionary is completely falling off.


A member mentioned a correlation between the market and FCT which is a floating return income fund. I did some research and compared it to the market and indeed it has called some tops such as 2007, 2011 (July specifically) and is in a relative negative position and losing momentum quickly.

 In red FCT warned about the July 2011 decline seen at the red arrow, on a relative basis, you can see how it has underperformed the SPX by the associated trendlines. I didn't have time to put together a rate of change for both, but the charts below show the momentum fade.

First FCT hasn't been looking too hot the last week or so with Friday being a bearish engulfing candle.
 Looking at the early part of the rally from Dec. 20-Jan 23 we have a nearly 9% return, which is more then the SPY's 6% return below for the same period.

 SPY...

More recently from 1/23 until today, we have a 1% return in FCT...

Compared with a 4.21% return in the SPY for the same period, so 2 things stand out, one FCT seems to be a higher beta fund then the SPX which you could see in the early trend momentum, second the relative performance or ROC has fallen off dramatically and in the large scheme of things, it is divergent with the market.


I'm not sure what is behind the correlation, but it seems pretty solid from looking at past charts.

URRE Long Trade Update

 Here's the big picture again and the typical "new" bullish descending wedge behavior (unlike what Technical Analysis has defined this pattern to be for nearly a century). As you may recall, these bullish wedges "use" to break out at the apex of the wedge, you can see a false breakout in yellow-I also suspect that is the area of resistance that will mark a stage 2 breakout.

 The recent bullish ascending wedge consolidation may have had a little shakeout below the lower trendline, but a daily bullish reversal hammer is forming, if you like this trade but haven't had an opportunity to get in to it, today may be that chance.

 Since we first noted a bullish change in character, I have said, all I care about is that URRE keeps a generally rounding bottom shape as you can see by the 22 day moving average and that volume pick up on the right side of the pattern, so I'm satisfied with URRE's price performance thus far as it was what I was looking for long before the rounding pattern was even present.

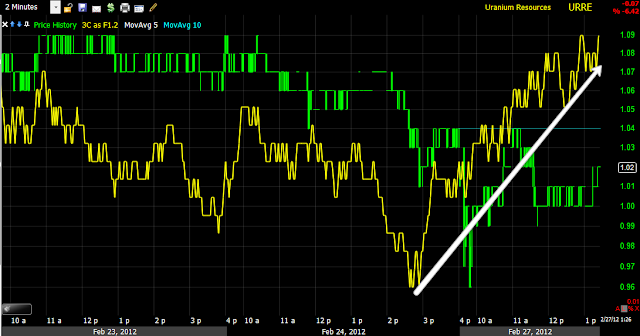
 Short term 1 min chart seems to show a positive divergence today (which is forming a bullish hammer reversal candle).

 The 5 min chart is also showing positive divergences.

 And the 15 min chart looks good overall.

As does the hourly chart.

I'd sum up URRE as so far so good and today looks like a decent area to add or initiate if you like the trade long.