Wednesday, August 22, 2012

HSBC Chinese Flash PMI Not Good

Last night it was Japan's Trade Balance coming in worse than expected, tonight its HSBC's Chinese Flash PMI that just came in at 47.8 vs 49.3 from July. This is the worst print in 9 months and of course, below 50 so China remains in contraction. 

There are 11 sub-indicies in the data, all were weak. In line with the Japanese Trade Balance, China's New Export Orders came in at 44.7 which is the lowest print since March of 2009.

Keep in mind this is HSBC's Chinese Flash PMI and not the official Flash PMI, but because of China's opaque political system, the HSBC number usually carries its weight. Typically on a bad report like this we'd be hearing rumors of a Chinese RRR cut or some sort of stimulus, but considering food and energy inflation in China and the fact they have been conducting reverse repos, the opposite of easing in trying to get a handle on inflation, easing is pretty much out of the question.

Here's how the data has effected the market thus far...

 ES remains in a persistent  negative divergence, we've only seen this a couple of times this year and each time was right as the market as making a major reversal to the downs side. ES did gain after the market closed, but in the white box you can see the reaction to the Chinese Flash PMI.

 The EUR/USD has a minor reaction, the biggest reaction was to the F_O_M_C_ minutes at 2 p.m. in red.

The $AUD being much more sensitive to China did see a bigger reaction in blue, the $AUD also happens to be an excellent leading indicator for the market, a move down in the $AUD is not good and it's been underway for more than a week. We'll see how the market digests this information.

We did have the positive divergences in the market averages today suggesting a move up, even though we saw some deterioration in them. I couldn't find any real confirmation, Treasuries were positive instead of negative as they would normally be, Volatility remained positivie when it would normally be negative on a market positive divergence so there's a lot of movement out there. I would still be looking to short in to price strength as the underlying weakness remains if we get the chance.

* Remember as I posted earlier, I have a doctor's appointment tomorrow morning so I'll hopefully be back by 10:30 -11 a.m., if you could send your emails around that time (if they are market related) it will likely save me some time in getting back up to speed when I get back.

See you tomorrow.

*Important - Tomorrow

Tomorrow I have a Dr's appointment for my back, for those of you who may be newer, I have 4 herniated disks, Spinal stenosis and a touch or arthritis in my lower back so I have an appointment with my back doctor tomorrow morning.

I always try to get an early appointment so I don't miss any time here, but I have to drive to their northern office which is about 45 minutes out of my way so I'l be absent in the morning, hopefully I'll be back by 10:30-11 a.m.

ES and TLT-The Flight to safety

This is one of the reasons I don't mind if I don't catch the EXACT top, I'd never try to pick tops or bottoms if I didn't have the guidance of 3C, but you know every once in a while I'll say, "Close enough". I'd rather have a wide stop and sit through some drawdown than miss a big move, they don't come that often.

First lets look at ES, although 3C was showing positive divergence on an intraday timeframe for many of the averages, it also showed many of them collapse and I can't find much in the way of confirmation.

 ES is just a fraction from making another deeper leading negative divergence and this is already on top of two days of leading negative behavior in ES, this is very ugly and has the look as if it could collapse at any minute, I'm glad all of my re-positioning is done, but we'll always keep looking for opportunities.

 As I said many times about this move in TLT / Treasuries (30 min chart), I believe the move below support is the same head fake move before an upside reversal that we are seeing in stocks making upside breakouts that are likely head fake moves as well. It didn't take TLT long to challenge resistance, it's basically there today. The yellow box represents the suspected head fake move, think about it, major support broken, stops hit everywhere, plenty of supply at cheap prices, it's perfect for accumulation and no one would ever know because someone has to take the other side of the trade.


 The 30 min chart shows several negative divergences and the break below support, but that break is in to a positive divergence suggesting the stops triggered and massive volume were accumulated, as the saying goes, "ALL OF YOUR SHARES ARE BELONG TO US NOW". Look at that leading positive divergence of the last several days, nearly perfectly vertical, that doesn't happen often on a 30 min chart that fast, but we have been seeing a lot of extreme divergences this week.


 The 15 min chart has been lending support as well with a beautiful leading positive divergence in a base-like area until today when TLT gapped up and then ran in the afternoon despite what the market was doing, it seems the flight to safety may have already begun.

 The 5 min chart has also been leading positive, even with today's gap up.


Here's the real impressive move though, the 1 min chart nearly vertical at the lows, it really looks like there's major repositioning going on and they don't seem to care that they are doing it out in the open , although I doubt too many traders notice.

Full BIDU Outlook

This is our 3rd large trade in BIDU and we've had many short term options trades as well. I recall BIDU in April of this year after having just made a breakout rom a triangle, I just had a new member sign up and I believe he was long BIDU and probably didn't quite understand why we were shorting a stock that just broke out. As I explained yesterday at my free site, www.Trade-Guild.net in this post about head fake moves, BIDU was had already told us it was going down before it even broke out to the upside, which allowed us to use that upside breakout to short in to, while it's not easy emotionally for most people to short in to price strength, the underlying weakness told a different story and we got the best priced entry with the least amount of risk.

Since that trade which is still part of the core short positions in the equities model portfolio, we have taken a long trade in BIDU in early June on what I suspected would be a counter trend rally and has been and now a third trade (add to the original core short, plus some new options positions of which one was closed yesterday for a 100+% gain in 3 days). This third trade of course is short again as we look for the downtrend to resume, the point of the post last night was that all 3 trades gave us advance warning so we were able to let the trade come to us on another feature all three trades shared, a head fake move just before the reversal in which we were trading.

So here's a micro to macro look at BIDU, what is going on tactically and strategically as well as some target projections.

 Firs a 5 day chart of BIDU; note the first rally in 2006-2007 was a healthy rally, it saw advancing volume with price, RSI went negative and there was the drop in to the 2009 lows. The rally since 2009 I have called a "House of Cards" built on F_E_D liquidity instead of real fundamentals, in my view, that makes this rally particularly thin and hollow with little support outside the Central Bank; you can see this in long term 3C charts, in Breadth charts in all kinds of metrics. Note the volume in to the 2009 rally and how it falls off, this is the sign of a sick rally that has little support, a serious crack can lead to a fall like we've never seen before because there's no time in history in which the world was so globalized, in which there has been so much Central Bank intervention, no one knows how bad it really will be, but my guess is, pretty bad.

The top formation gives us a rough downside price target of somewhere around $45-$50 using the top's measuring implications, in my experience more often than not these targets are on the conservative side.

 Using my Trend Channel as a stop for BIDU, you could have made 900% in easy money and not been stopped out once during stage 2 mark-up. If you timed things perfectly there was another 225% to be made "IF" you could sell at the exact top and not be scared out of the position by one of the volatile moves down. For the most part, once the Trend Channel signals a stop, staying past that is just opportunity cost as the easy money has been made, the top is a lot of volatility and work.

 Looking at the micro, you recall today there were positive divergences that brought BIDU up to fill the gap, I was watching the shortest timeframes to see if the negative divergence would migrate to longer timeframes, giving us a good idea of when BIDU would be a prime short, although I think anywhere in this area is close enough. The 1 min chart did go negative as you can see.

 Next, the 2 min chart earlier had shown no signs of a negative divergence, later in the day it did, so this is migration of the divergence, it is getting stronger.


 The 3 min chart also saw a leading negative divergence at the end of the day, so BIDU is on track to giving us a short term entry signal.

 As you can see, the divergence hasn't reached the 5 min chart yet as it is moving perfectly in line with price, once we hit the 5 min chart, we should have a strong enough signal to short BIDU if you are interested and didn't already.

 The 30 min chart shows the head fake move that was exactly were we entered the Sept $130 puts for a quick 100% gain. You can see a positive divergence sending BIDU higher as we expected on a counter trend move and then at the flat range (as always) a nasty leading negative divergence and then a head fake move above resistance at the yellow arrow (this is almost always the last thing to happen before a reversal).

 The 60 min chart is even more important and it reflects the April top and how bad the negative divergence is at the July rally, this also reflects that the move up was nothing more than a counter trend bear market rally.

The daily chart really seals the deal, note strong accumulation or Stage 1 in 2008/2009 then strong distribution in to 2011, now a leading negative divergence as the top is about to break on the next leg down.

It certainly is possible that BIDU breaks lower than $45, if all things were equal and there were no F_E_D intervention, I'd bet that it would break lower than $45.

I hope this helps with concepts and gives you some idea of why BIDU was an early favorite core short position.

Volatility-VXX

We already know that the VIX hit 5 year lows, indicating huge complacency in the market, this has long been associated with market tops and a 5 year closing low just 4 days ago taken with everything else we are seeing, doesn't look good. There's a notion out there and I'm not sure where it is coming from, that market participants on the retail side are bearish. The VIX doesn't show any such confirmation.

However if there were any kind of major, even short term changes coming, I'd expect to see it reflected on the Short Term VIX Futures or VXX. Interestingly, VXX did not confirm the market positive divergences by having its own negatives, instead it held up well.

Remember that the VIX and the volatility ETF derivatives typically trade opposite the market.

 Here's the VXX (because I can't get VIX intraday signals with 3C) with NO negative divergence today at all, in fact it was perfectly in line or what we call price-trend confirmation and even ended the day with a leading positive divergence.

 Here's the 2 min chart's trend, notice anything about the character of the relationship between VXX and 3C? Remember Green arrows are confirmation, red are distribution and white is accumulation. Around mid-August on this chart, we went from in line with the right negative divergences in the right spots to a HUGE leading positive divergence as VXX makes a base similar to the FB base, just larger.

 Taking a closer look at the 2 min chart you can see today's intraday action was not negative, 3C made lower highs with price and lower lows where they showed up, it was perfectly in line, no negatives to suggest even a small pullback due to a market bounce intraday.

 Again, on the 3 min chart's trend, do you notice anything about the relationship? At the same area, 3C is putting in a monster positive divergence/accumulation, this tells me someone or a lot of very big someones are buying volatility up in expectation of a huge move in volatility, which would be a huge move down in the market which would fit our second and third trend assumptions nearly perfect. The second trend assumption was a very powerful move up that would likely make new highs, it needed to be strong enough to pull bulls back in to the market and I think the market has accomplished that. We then expected a head fake move, which we have in place and the third trend which would be the emergence or if you go by 3C trends, the re-emergence of a primary bear market, taking out the June 4th lows.

 A close up of the 3 min chart shows 3C following price today exactly, price-trend confirmation, no sign whatsoever of a negative divergence which is unusual because one of my methods of confirming market signals is looking for the exact opposite in different assets that trade opposite the market like VXX.

 The VXX 5 min chart's trend, again, accumulation at what appears to be a double bottom-remember what I said about Technical Analysis' definition of a double bottom and what the reality of a double bottom in the real world is, this would be a small double bottom (by TA standards), but as we often see with divergences (and this makes total sense if you think about phasing in to a large position) they start off with less intense relative positive divergences (usually represented by arrows) and then they get more extreme, stronger and we usually end with a leading positive divergence which is much stronger than a relative divergence (usually represented by a box around the 3C area that is leading). We now have a new leading positive high.

 A longer view of the 5 min trend, confirmation, 3C is moving with VXX as it should in a downtrend and then a sudden and very strong divergence or accumulation of this short term trading ETF. The first bottom is relative positive, the second bottom is leading positive.

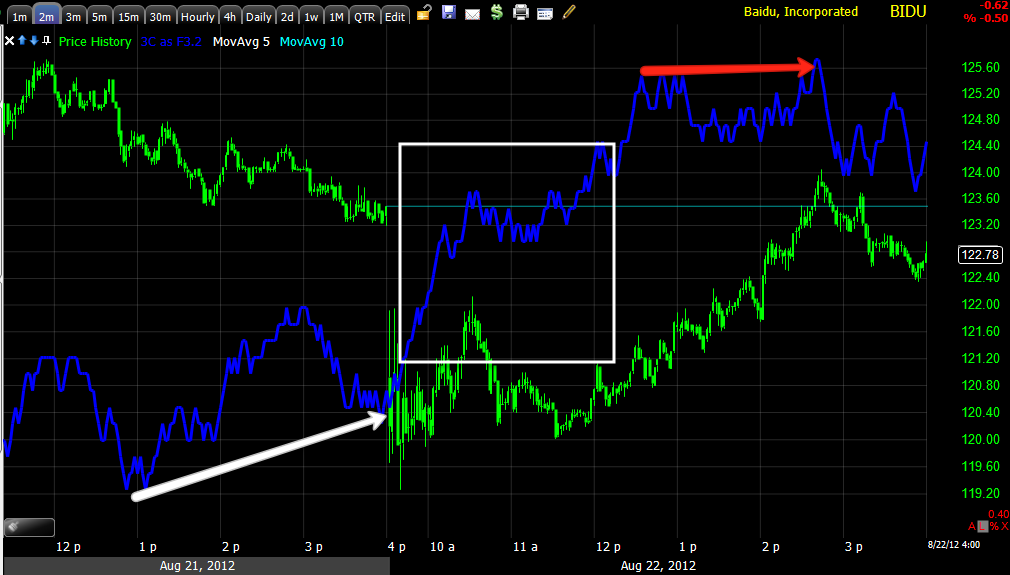
 The VERY important 15 min chart, this is where we see a lot of reversals and strong institutional activity, This shows us a relative positive divergence probably right around the May 1 highs in the SPX and a rally in VXX of over 40% as the market works its way in to the June 4th low, but VXX never really went that negative at the top. This is where it gets a little confusing, when looking at price there's no way to classify the June to present rally as a bear market rally (BIDU is one example where you could classify the move as a bear market rally), bear market rallies are some of the strongest rallies you will see, they have to be to get traders back in the market. The Crash of 1929 and resulting bear market had at least 5 major bear market rallies.

Now, we can't classify the price trend as a bear market rally, but there are so many 3C charts similar to this one that show what appears to be the start of a bear market followed by a bear market rally that is turning now. If this were not showing such signs, then 3C would have made a new low with price, not a much higher low. This is indicative of the accumulation and strength in underlying/smart money trade, it's just strange to see it on such a short term tool such as a volatility ETF. It seems someone is buying as much exposure to volatility as they can.

Finally the 40 min VXX chart, while 30 minutes sounds like a short timeframe, the signals on a 30 min chart can move the market for months, even close to a year depending on how big the signals are. Again, time after time on every timeframe, the theme is the same, a double bottom and a HUGE leading positive divergence.

Why there's no sign at all of anything negative even on an intraday 1 min chart is beyond me, unless I was more correct than I realize that there are too many trying to squeeze out of a closing door all at the same time or there's something in the market being discounted that we don't know about yet.

ES Update

Here's ES hitting a new leading negative low, in other words, it looks like pure distribution in to higher prices, the same thing we want to do.


In the red box, that's a new leading negative low for the day

GLD-QE Sentiment Indicator

As we speak, ES is moving to a new leading negative low, very strange behavior unless as I mentioned about AAPL, there are too many people trying to rush out of the same door at the same time as it starts to slam shut.

As for GLD/gold which benefits the most from dollar debasement/QE, it did NOT show any signs of positive divergences and I feel fine shorting GLD right here.

 There's the triangle and there's our highly directional move expected this a.m., but even on a 1 min chart, 3C not only does not confirm, there's no hint of any positive divergence whatsoever!


 The same with the horrible looking 2 min

 And the 3 min

And the 5 min. Something isn't right here, but I'd still go with the signals and take GLD short here, I'm already loaded up.


Market Update

This is a tough call because ever since yesterday when I posted my "Gut Feeling", I actually expected a counter trend move and then we started to get positive divergences while price was moving lower before the minutes and evidence of the gut feeling, then even a price move, BUT, Wall Street NEVER does something like this without a reason and the move thus far fulfills no reason as all.

The charts are kind of all over the place short term, but my gut says the IWM is the correct average and that we do have more on the upside to go before we get the rest of the reversal.

 DIA 1 min is more positive than the move we have seen thus far, this doesn't make sense at all, the move needs to move higher to off load accumulated shares at a profit or even break-even, unless something radically changed their minds and they just want out.

 The same with the 3 min, the divergence is not huge, but much bigger than the move following it.

 Here we are on the DIA out to the 5 min chart, still leading positive, I do believe we have more upside to go, this needs to move people psychologically.

 ES has been in a persistent negative divergence for a couple o days now, we have only seen this at the last 3 major reversals this year.

 The IWM looks more like what I expected yesterday, this is 1 min, but a nice divergence that should give yesterday's highs a run for their money. That's what I want to short in to if I'm to add.

 The 3 min chart looks exactly right compared to the scale of the 1 min.

 And the 5 min looks as if the move hasn't even started yet.

Remember on the other side, the more important timeframes, it is very ugly, that's why I feel safe shorting in to strength, but we have to see some first.

 QQQ 1 min, over? I don't think so.

 QQQ 2 min in line.

 QQ 5 min going negative, I just don't buy this.


 The SPY is actually the weakest looking of the 4.

3 min relative positive, even this should give more bang.

AAPL Update

As I have said several times today, I want to use price strength in AAPL to enter short / Put positions. I imagine many are wondering where, it seems AAPL has some more to go, but it still has that anchor attached.

 AAPL 1 min is still in line, unlike BIDU that we just saw, I want to see this go negative, like BIDU.

 The AAPL 5 min is the anchor that for me, makes shorting price strength fine here as this is a more important chart and in much worse condition.

The BIDU 1 min negative has just started to migrate over to the 2 min chart as I was waiting to see, it is probably fine here, although I prefer strong signals in moving on trades.

Risk Asset Update

I really anticipated a bigger move than what we have seen thus far in the market, I'll check the averages after this post and see what's going on, we still have plenty of time for a move to take hold as mentioned yesterday first in this post, "Gut Feeling".

As for the Risk Assets we track, as they often are excellent leading indicators, here's what we look like today.

First Credit, "Credit leads, equities follow".

 High Yield Credit, a risk asset that should follow the SPX failed to do so here as the SPX moved higher.

 Relative comparisons of HY Credit and the SPX shows credit making a similar low while the SPX stays above the same low.

 High Yield Corp. Credit is not performing well, also not following the SPX on the risk move that is fading.


 Junk Credit didn't even move.

 Yields which are like a magnet for the SPX are negatively divergence

 Longer term Yields divergence.

 The $AUD didn't move much unlike some other pairs.

 $AUD longer term divergence with the SPX, Carry Trade is off, not good for the market.


 The Euro did rise and was even positively divergence before the minutes, this may even be what causes the short term positive divergences as they often follow the EUR/USD pair in arbitrage analysis.

 The $USD on the minutes release.

 Longer term sector rotation, while Financials may look very strong, they also look peaked out and ready to turn, the safe haven Utilities, Staples and Health Care look as if they are ready to rotate in. Energy seems to be coming off peak rotation and going out as does Basic Materials and Industrials. Tech is hard to say as is discretionary.

Since the minutes...

Financials are seeing some pressure, Utilities, and Healthcare are coming in a bit, Energy is coming in on the weak dollar as are Basic Materials, Industrials are fizzling out, Tech seems to fizzling out as is discretionary.

All in all, the findings haven't changed much, there are a lot of negative divergences here, nothing really leading the market to suggest any health here.