Monday night I looked at the economic calender and there was nothing happening today. In my gut, from all that I had seen and laid out for you over the weekend I felt very confident we'd see a lower close and the start of the Judo Concept with the bounce failing. Logically with nothing on the calender to give us a catalyst to send a shock wave of fear through the retail community I felt a little disappointed, but Wall Street came through for us and all of the signals witnessed were “not for nothing”.
Tuesday, the already questionable results of the European Bank Stress tests from a month or so back, came out with an announcement that they had not counted or they had disguised high risk government debt that they were holding, making the results of the test near worthless and throwing into question the true state of the European Banking system's resilience. Considering what I showed you with all the signals of a reversal very close, DOES ANYONE FIND THE TIMING OF THIS RELEASE TO BE INTERESTING?
I think this is something that was known and strategically released for a purpose. If you listen to Jim Cramer's interview with Aaron Task on Wall Street Confidential on the net (Google "Cramer Manipulation") , Cramer talks about how he, as a hedge fund manager and how others would routinely use the press to send out false information to further their goals. I think the truth runs even deeper then that. If you consider that these financial news organizations DEPEND on Wall Street to sell ads and the infomercial interviews, I think it's very likely that they are fully complicit in Wall Street's manipulations. I've seen things on CNBC that make me say to myself, “Does anyone really buy this carp?" (I know, it's a fish).
BREADTH TODAY.....
PRICE VOLUME RELATIONSHIPS....
Price Down/ Volume Down: Dow (18); NASDAQ 100 (53); S&P-500 (278); Russell 2000 (1046); All NYSE STOCKS (2788)
Price Down/ Volume Up: Dow (8); NASDAQ 100 (32); S&P-500 (165); Russell 2000 (753) ; All NYSE STOCKS (2164)
IN THE S&P-500: 57 STOCKS CLOSED UP
THE NASDAQ: 15 STOCKS CLOSED UP
THE DOW JONES 30: 4 STOCKS CLOSED UP
THE RUSSELL 2000: 201 STOCKS CLOSED UP
Roughly 10% of stocks closed up. The price declines don't reflect the severity of today's move.
I track stocks that make 5% or greater moves and their P/V relationships, obviously Price Down was dominant, but as to volume, the dominant relationship was Price Down 5% or more on rising volume. THIS SHOWS A MAJORITY OF THE BIG MOVES WERE PANIC SELL-OFFS.
16 Major Breadth Groupings tracked by Don Worden: ALL SUPER DECISIVELY NEGATIVE
As an interesting note, I'm not quite sure what it means, generally speaking the averages were down on relatively higher volume then the ETFs that represent them, the NASDAQ 100 vs the QQQQ is a particularly stark contrast, take a look for yourself.
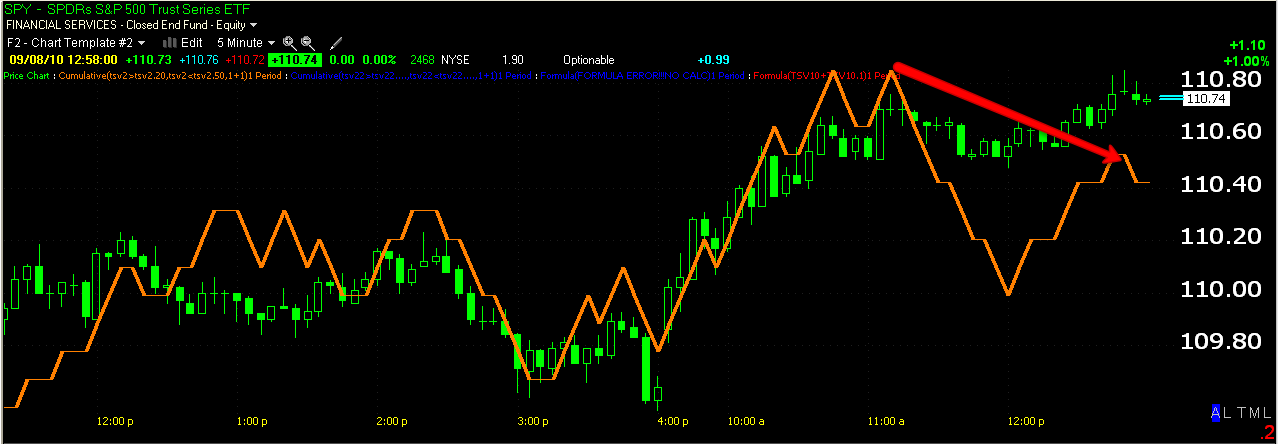
This is what a confirmed Hanging Man reversal signal looks like...

You may remember from the weekend post that this is one of 12 major reversal formations in Japanese Candlestick charting and I point it out because it is an excellent example. The first component is an uptrend which is seen at the green arrow, the second is the Hanging Man candle itself (in the white box), it doesn't need to gap up to be valid, but the further it gaps up, the more significant it is and the higher the volume, the more significant; we saw both conditions met. It's not a confirmed reversal signal until a close lower the next day which we saw today at the red arrow. Note that this is the ETF and volume is somewhat light. Unlike an uptrend where rising volume is essential to confirm the strength of the move, light volume is the hallmark of a bear market and does not diminish the importance of the reversal signal, although higher volume AT THIS STAGE, would indicate panic selling. All 3 candles that make up a Hanging Man Reversal pattern are in the red box. Keep this in your mental tool box.
Remember I told you over the weekend that even with a reversal, do not be surprised to see an attempt at a new high or a volatility move. I called it, ”shaking the tree”. We saw some slight gains in after hours, the IWM gained .11% in after hours, the DIA lost .01%. these are not significant moves.

Above you can see a very slight 1 min positive divergence in the IWM right toward the close, the red arrow is the negative divergence from Friday. We have these 1 min positive divergences (even though they are slight) into the close of all of the major average ETFs. So that would explain the after hours, it may also lead to a gap up on the open. The breadth readings show a market in a lot worse trouble then the price declines depict, but most traders aren't looking at breadth readings, they're taking a chance on catching a falling knife, thinking that today's decline wasn't as spectacular as Friday's advance and maybe this is just a little glitch in the bounce. Remember, humans, as traders by nature are hopeful and biased toward the long side. I see no reason why Wall Street and the market makers would object to a gap up, or even a big gap up, it only helps them make more money-”shaking that money tree, knocking out as many positions as they can”.
Here's the bigger picture though in the IWM
You see the white arrow of accumulation that got this move started, you see the red arrow showing the distribution throughout the entire bounce and today you see 3C making a new low, even though when it is compared to similar levels in the past, price is much higher now-this is the powerful NEGATIVE leading divergence. To be fair there are a couple of positive 5 min divergences in averages like the SPY-see below.
However, we need to look at the bigger picture, this is the exact same chart but zoomed out to show the relative position of 3C.
While that 5 min positive divergence is there, look at where 3C is in relation to prices at similar levels, so we have a slight positive divergence within a really NEGATIVE leading divergence. To me, this smells of a setup. Here's what a possible scenario could look like and I warned of this over the weekend before we saw a reversal to the downside because I know how Wall Street likes their games. It's almost as if they want to exasperate you.

This is a similar situation (above) in the SPY from the top of the June decline this year. We have a weaker hanging man reversal for a couple of reasons, 1) it wasn't a strong depiction of a hanging man, two it didn't gap up as high and 3 the confirmation reversal day was only about a half of a percent down, still it worked out. The white box is the reversal set-up, the red arrow shows higher volume on the hanging man day like we saw and the green volume arrow shows the lower volume on the confirmation day. The vertical red arrow over price show Wall Street shaking the tree with a fairly massive gap up, this was bound to shake out the shorts that entered on the hanging man reversal and encourage longs to re-enter the market-both events that benefit Wall Street and the market makers. However, look at what happened from there, the trend down was nearly uninterrupted and I think right now we have a stronger setup for a move down.
I'm not saying the situation above is what will happen, I'm just trying to prepare you for the possibilities because Wall Street plays the game a certain way and when you see it enough, you can almost guess pretty accurately at what they are likely to do. So be on the lookout for something like this, again, don't panic, I'm telling you in advance as I did this weekend before the reversal that this is a situation that could occur and you should not be surprised by it. In fact I would use it to short into strength.
As far as the longer term outlook....
Here's that 60 minute chart we've been watching-(the longer the timeframe, the more you can see and the more significant the findings of 3C are in showing what institutional money has been doing long term. 3C entered into a NEGATIVE leading divergence today. Remember I told you before the bounce started that they held 3C steady in a positive stance even on down days, well now that we are higher in price due to the bounce, 3C's relative positioning is very negative and should get worse from here. This is warning of a significant move down in the works.
Here's another, this 15 minute timeframe has called advances and declines on the order of a month long trend. Here again, 3C's in a leading NEGATIVE divergence-look at price now and 3C's position compared to its position in the past-this is very bearish.
And again, not as significant as a 15 or 60 minute chart, but the 10 minute has called some major swings, but what is more important is that we see all of them falling into line. You can see the white arrow-accumulation before the move up and the constant selling from institutional money. Again, another NEGATIVE leading divergence-the WORST kind of negative divergence. IT literally seems to PULL price down with it.
So that's what I want to show you tonight.
A trade that I really like and I'll be adding more tomorrow during the day, but for now, MSPD
Here we see a great top with tons of overhead resistance. It broke down and started a bear flag which insinuates a move lower is coming, but they ran the bear flag up far enough to cross above the neckline of the top-stopping out shorts and drawing in longs.
Here's the situation I warned of above, the day in the white box is a breakout of the bear flag on increasing volume. This was likely to take out most shorts left in the trade and such a bunch of longs in as they see a failed bear flag. This is 100% the Judo Concept. Note today price was sucked back into the bear flag and all those 1-day longs are now at a loss.
A closer intraday look at today's action....

The white box is the daily breakout of the flag on increased volume-this is the bull trap. At the yellow arrow they set another bear flag as price dumped back into the flag, longs now at a loss and they let this flag act like Technical analysts believe it should work and let it fail as they'd expect. The end of day price move in the red box shows a lot of long wicks on the candles showing higher prices were sold off and the volume looks horrible. This is a high probability low risk short right now in my opinion and I'd enter a good portion of the position now and add when that daily neckline from the top is broken. This should be a real nice short trade. However, I want you to really look at what happened to this stock, every component and see how Wall Street operates. At each turn those who follow conventional technical analysis thought they were right and then got knocked out of their trades. The initial shorts who were knocked out were probably the right ones and this is why I encourage you to use wide stops right now-the volatility in a top is intense and the trickery is non-stop. I do really like this short trade though.
So as the post said, if you want to know how Wall Street operates in the real world, not some textbook, study these charts, study the intraday charts posted and the bigger picture, go back and re-read the massive post from this weekend. Everything you want to know and need to know about how the market truly operates-the manipulation, corruption, the outright lies from the media, everything is all right here. I encourage you not to just read this post and wait for tomorrow's. Study this because you are seeing something that very few people will ever notice. You are seeing something real that I've never seen to this extent in any of the many, many books on technical analysis I've read and you will see something that CNBC will not talk about. It's all right here. You decide what to do with it.
If you have questions, you know I'm here for you.
Til tomorrow....oops, it is tomorrow.