Friday, March 8, 2013

Friday's Max Pain

From a.m. data

From one calculator the max-pain (cash value) was as follows (dos not include today's data):
SPY $153
IWM $91
QQQ $68

From another the same calculator yesterday:
SPY $153
IWM $91
QQQ $68

Monday Morning volatility

There's no doubt we have had the line on options trades, as posted a couple of days ago, all of the weekly options (a few longer) trades for February...

I noticed something Monday morning though of this week, to be exact, here's the exact post.


"What is more of a mystery is the averages, there's an inconsistency among them in different timeframes. I fully expect there will be some kind of relief rally or bounce on the resolution of the Sequester which I think has to come at some point, however last night I pointed out the larger nature of negative divergences last night and I'm wondering if this is an early sign of the amplitude of volatility getting ready to increase, this would still be basically non-directional, it would increase the size of the days up and the days down, almost like a broadening top, just with less direction.

So far that's just a guess and a guess based on some of the most inconsistent data out there, Monday morning charts.

Each average is a bit different, some are more bearish than others, some are more neutral than others, the iwM is probably the best example so far of the possible theory of increasing volatility/amplitude."


In trying to find this post, I count at least seven times I posted the same or referenced this post through the week, today were the first real two losers, many of the posts after this one were about taking the next week out or April as volatility looked set to increase. I'm going to update and double check, but after more than a dozen winners and the biggest loser of -2.5%, something changed, I noticed it early this week so it's time to make an adjustment, but most of you know what increased volatility mean.

The other theme was the Yen and how it was the pivot asset this week, I can't even count how many times I said that, today proved that to be true. I feel just as strongly about the post above regarding volatility and options as I do about a change in character in the Yen which has been supporting the market, so I'll be doing a lot of research on both and let you know what I find, how we can use it and most annoyingly, how we can take advantage of the weekly op-ex Fridays which feel like a total waste, I'll see what I can come up with.


GLD Update

If it wouldn't violate risk management rules, I'd add to GLD here, I see it as a very high probability, low risk position here.

First as for the probabilities, both GLD and gold futures are on the same course.

 5 min Gold futures showing accumulation on the stop run this a.m.

 Remember the futures 3C divergences are bigger than the equity ones so this 60 min positive is more like a 4 hour in GLD.

 GLD's 15 min leading positive on what I think is probably a larger base than just this rounding one, but even if it's only the rounding, it's still a solid divergence.

 GLD 4 hour has been on track through all of these signals, you can see here why I suspect it might be bigger than what we have been looking at recently.

 We even have a daily positive which is rare.

If I use today's lows that's still only 1% risk from here, actually less, I can invest an entire portfolio with at least a 3% stop without ever violating the 2% rule, probably bigger so I think you can have a stop even wider, still max position size and still come no where near violating the 2% rule (no more than 2% loss of portfolio on any one position with no more than 15% of portfolio invested in any one position).

This is actually a really nice looking area for an entry.

QQQ P/L

This is the first loser out of something like 2 dozen of these weekly options that is greater than 2.5%, but I just don't see enough momentum being able to build to make much of a difference.

Luckily it's a spec. size, but the fill was at $.20 for  -57% LOSS

The SPY weeklies expiring today are not worth anything.

All other positions are staying in place:
GLD April (month) $150 call
GOOG April (month) $810 Put
QQQ April $68 Put
IWM March 16 $95 put

Closing March weekly QQQ $69 put

While it's still worth something, if there's a move in the last hour there are longer potions that can benefit.

Futures

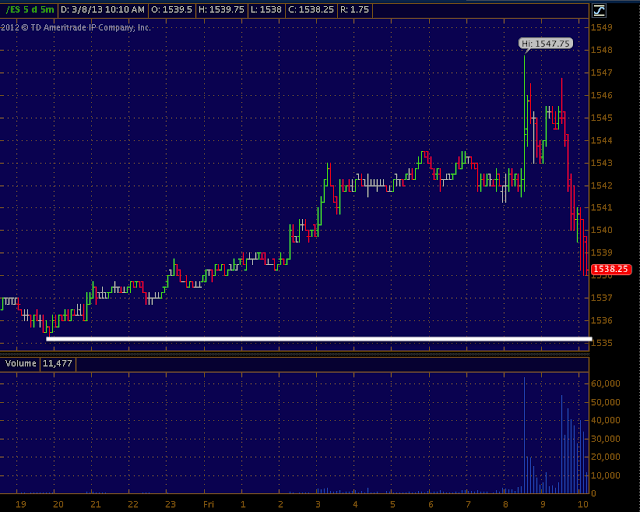
ES and TF (russell 2000( are moving, on a day that otherwise feels very much like an op-ex pin, I don't know if the June contract which started trading after the close yesterday has anything to do with that.

 SPX futures ES

R2K futures / TF you can see the June contract at the far left (dashed lines).

HYG is also acting worse.

More in a few mins.

FX

It's beyond ironic how many times I said the Yen would be the pivotal asset for the market this week, the overnight move to the upside was Yen driven, the halt of that move was Yen driven, if I get some time I'd like to see what the new board is going to look like, it's one thing to put a BOJ head who is a currency debasement zealot up for leadership nomination, but just like our own F_O_M_C, that's one vote of a panel of 8.

Yesterday morning we knew the outcome of the BOJ policy decision, we knew that 1 member proposed "New Easing" which was rejected by the other board members, we knew and talked about Abe's new BOJ appointments having at least 1 ally in that 1 board member, but did you know what started the rout in the Yen last night and thus the futures?

Overnight the WSJ reported on what was already known...

"one board member proposed fresh easing steps—a move seen as a precursor to the aggressive easing the incoming leadership is expected to undertake to meet its target of ending deflation in two years."

This article of information already known for almost 24 hours is what kicked off the move in the Yen, now we can debate whether the article was simply cover for a move that was planned in advance, but this is what coincided with the Yen plunge and futures ramp.

You have to keep in mind that with the kind of money that is circulating around Wall Street for friends of Wall Street, a lot of what you read and hear are "plants", they are meant to facilitate a short term move, but as anyone with a shred of common sense knows, the WSJ article that started the avalanche contained NOTHING new, not even a new take on the analysis of the 1 dissenting board member! 

It's not only price that is deceptive, but the entirety of Wall Street which is why its important to make fact based, logical decisions and not emotional ones, the Yen move was meant to touch an emotional nerve. Look at what happened with GLD today, it stopped out a lot of people on a very scary move and then came back to levels as if nothing ever happened; this is one of the main reasons I and most traders I know are loathe to trade the open unless we are fading some move, such as the lows in GLD this a.m., that would have made a nice chunk of change in an hour.

Here's how the FX market is shaping up and without doubt the Yen has the cleanest, clearest signals, the kind I rarely ignore while the others are not what I would call a strong edge.

 Very short term the $AUD looks like it wants to move higher from these levels.

 Longer term it looks like it was supported in this move and the plunge in price was a knee-jerk reaction  which has no confirmation on the downside.

 The Euro is positive below $1.30 to the left, right where we thought it would move higher and while it looks like there was distribution at yesterday's highs, it also moved lower on a knee jerk reaction.

 The EUR/USD and the move up from below $1.30, does it do it again? I'm guessing it dos at some point.

 The Yen Futures are the only ones that have a clean signal like this, in fact this positive divergence at the Yen lows at the exact same time as the NFP release this morning is probably the strongest, cleanest divergence I have seen market wide today, that doesn't bode well for the market.

 As far as the Currency ETFs, again I checked them all and only the Yen has a very clear divergence that has been proven right in the past from left to right: Negative at a gap up and deeply negative ending the Yen lower and then a positive that stopped the Yen's fall and sent it to a lateral range/consolidation, then a negative divergence sending the yen below the range, something that looks like a head fake move as the positive divergence at the lows is leading almost to a new high, remember "Changes in character lead to changes in trend" and the lateral consolidation was the first changes in character.

 Strangely the $usD was moving up pre-NFP, just before the release and then exploded higher, I see this as more of a knee jerk effect as well, but there is a change of character in the $USD as well, just not this powerful and there was no large accumulation to take advantage of the move, it's almost as if the NFP was a surprise.

Being there wasn't any significant accumulation in the $USd, I highly doubt the NFP print was expected or at least the "QE-Off" reaction wasn't expected sending the Dollar higher, it's not well supported up here, but if the Yen moves up, it's not going to matter than much in the pair (USD/JPY), it will matter to the carry, which is why I have been saying the Yen is the most important asset for the market this week, it's really the carry that is the most important, the Yen just has the power to turn the carry off.

VXX

VXX and UVXY (VIX Short term futures) are starting to gain some positive 3C momentum and a little price momentum, not surprisingly just as the Yen seems to be coming out of a small consolidation and looks as if it will head to the upside.

Market Update

Junk Credit is now moving and has been out of sync with the SPX around the same time the SPX was out of sync with the Yen (remember I said the Yen would be the pivotal asset this week), the very liquid  High Yield Corp. trades a lot like Junk credit, it too has been out of sync, but to a lesser degree (as you may recall the performance of credit earlier today was something I didn't like and have been watching closely).

Here's what several key market charts look like (at least as of their capture)...

 Junk Credit vs the SPX (green) has fallen out and gone negative on the day, this at the same time the Yen/SPX/Market correlation was wrong as I posted earlier.

 HY Corp. Credit isn't as bad, but it didn't follow the SPX higher either.

 Here's the Yen again this morning since hitting a bottom at 8:30 a.m. EDT, the white arrows are the proper correlation, the red box is the market moving out of step with the Yen, it seems now the market is starting to respond to some increased strength in the Yen.

 The $USD is also higher on the day (also puts negative pressure on the market and most risk assets including commodities). The correlation between the SPX (green) and the $USD is also off with the SPX performing better than the correlation suggests, at least until a few minutes ago, the Euro is nearly the exact opposite of the $USD so it may be easier to see there as the Euro and SPX should move roughly together as the Euro makes up 50% of the $US Dollar Index.

 Note the SPX moving up and out of correlation with the Euro, as the charts were captured the market started moving back toward the correlation.

 Commodities vs the SPX have been much more sanguine and respecting of the $USD's strength today.

The averages
 As mentioned the DIA has a pretty sharp negative divergence that the DIA is just starting to respond to here.

 That's stronger on the 2 min chart

 Other than the open, the IWM was mushy in it signals until just a few minutes ago as it got more extreme.

 The Q's went negative earlier just before they dropped and are starting to lead negative here

 The QQQ 2 min chart showing several apparent head fake moves

And the SPY has been moving with the SPY, except on the open when it was very deeply negative.

I think the momentum in the market will have a LOT to do with the movement of the Yen which you can track with FXY.

Italy Downgraded

The French and Chinese are ganging up on Italy, I wonder why with the recent elections throwing the entire Euro integration plan in to the sea.

Fitch just downgraded Italy to BBB+ / Outlook Negative and of the four reasons why they downgraded them, can you guess which one was first given the timing of the downgrade?


KEY RATING DRIVERS
The downgrade of Italy's sovereign ratings reflects the following key rating factors:
  • The inconclusive results of the Italian parliamentary elections on 24-25 February make it unlikely that a stable new government can be formed in the next few weeks. The increased political uncertainty and non-conducive backdrop for further structural reform measures constitute a further adverse shock to the real economy amidst the deep recession.
  • Q412 data confirms that the ongoing recession in Italy is one of the deepest in Europe. The unfavourable starting position and some recent developments, like the unexpected fall in employment and persistently weak sentiment indicators, increase the risk of a more protracted and deeper recession than previously expected. Fitch expects a GDP contraction of 1.8% in 2013, due largely to the carry-over from the 2.4% contraction in 2012.
  • Due to the deeper recession and its adverse impact on headline budget deficit, the gross general government debt (GGGD) will peak in 2013 at close to 130% of GDP compared with Fitch's estimate of 125% in mid-2012, even assuming an unchanged underlying fiscal stance.
  • A weak government could be slower and less able to respond to domestic or external economic shocks.

Market Update

Since it's pretty difficult to even get charts up in time before they have changed, I'll just tell you the intraday QQQ and DIA have gone sharply negative.

I'm still waiting on the SPY and IWM


Yen Shakeout

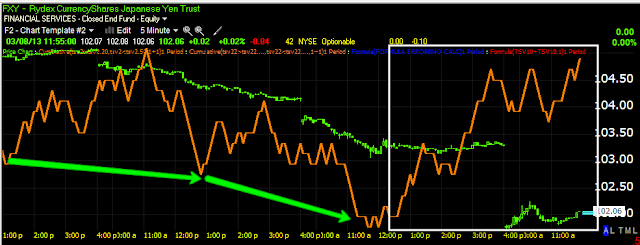
The plunge in the Yen overnight is what sent Stock futures lower, as some of you know we have been tracking some changes in the Yen the last few weeks from a solid downtrend (market positive) to a lateral trend (the market went lateral in the same area on increased volatility), today the Yen broke below that area, but is it a capitulation move? Even short term? I'm not sure, but there are signs the Yen may be about to make a run to the upside (market negative) and it doesn't really matter which pair, the AUD/JPY, EUR/JPY , USD/JPY...

Here's what I'm talking about as it does look like the Yen bottomed earlier today and on some of the largest volume since early February; it's not at all beyond the realm of possibility that was a capitulation move in the Carry trade, as a matter of fact, right at the NFP.

 The Yen vs the SPX, the correlation is clear, a falling Yen = a rising market, in yellow the Yen went sideways for the first time in a long time and today broke below on what may be a washout move, the volume was there for it and it was right on the NFP at 8:30.

Note the market chop/volatility during the Yen's sideways move, now imagine the Yen rallying, it's hard to imagine if you haven't seen what happens when a carry trade goes south, but suffice it to say, lot of momentum.

 Intraday the Yen vs the SPX, in white the correlation is as it should be, right now the correlation is off as the market typically falls on a rising yen, so this is another thing I'm watching closely.

 Here on the Yen Futures there are a series of 3C lower lows, that is downside confirmation of the Yen move, look at the recent move in 3C though as the Yen hit a bottom today

This would be the same as selling high or covering low.

 The FXY 5 min positive that started yesterday has grown.

It has now moved to the 10 min chart.

There may be more volatility than we expect very shortly, if it came down to it between a weekly op-ex pin and a carry trade going south on anyone who is still in, I'd bet on the Carry momentum which wouldn't be good for stocks. Whenever or whatever, something is happening here.

Jobs, Workforce Participation Rate and Seasonal Adjustments

I guess everyone has their own "Slant" on the economic data such as this headline by Drudge...

Which links to an article from CNS news, I know that is hardly unbiased, but they do have at least one thing right in their headline:

296,000 Americans Drop Out of Labor Force in February; 89M Not Working


This is the infamous "Labor Participation Rate" that the BLS ignores, which has the effect of making the jobless picture look better than it is. 

This is sort of like a permamnent "seasonal adjustment", which skews data to the positive side like it did last year, it tends to end around March and when it did last year, we saw the economic data go from beautiful to a nightmare almost overnight, starting the May 1 decline.

However there's something a little more disturbing in this report, other member have noticed it and I mentioned it earlier today, the Revision.

Today's 236k beat of 165k consensus was impressive, enough to scare the QE crowd, however, equally impressive was the downward revision for last month's data:157k to 119k !?!? 119?

How do we go from 119k to 236k in a month? At this rate the BLS's data is noisier than the infamous ADP data.

I have to wonder if the F_E_D is looking for a stage left exit sooner rather than later, no matter what needs to be done to get there. The reason is simply, monetary policy is easy to get in to, it's a nightmare to get of and from the last two releases of the minutes, it seems the F_E_D is becoming more and more aware of that fact.

GLD Update

Lets just get in to the charts...
 As long as GLD keeps this general "smile" I'm happy, it should start to see upside momentum as we are or should be on the right side of the middle of the pattern, I fully expect volatility like we saw this morning or in the yellow box, price patterns are never like the textbook. There were quite a few stops hit on the open (red arrow), but the bounce back was encouraging, I wouldn't trust it as much without the rest of the charts below.

 YG/gold Futures with a big leading positive divergence at the drop.


 The intraday chart shows a relative negative divergence at this morning's highs, but this is an intraday chart and a less powerful relative divergence so I'm ok  with that, I know there's going to be some noise.

 The 5 min chart of GLD, like YG also had a large leading positive divergence on the gap down open.

Most encouraging is the longer term 15 min leading positive which has picked up momentum right around the area to the right of the middle of the price pattern.

Market Update

As you can see by the posts, it's hard to keep up with the speed of the market. At 10:15 Wholesale Inventories came in strong and the market put in a bottom for the a.m. session and moved up a bit which, however the bug-a-boo was wholesale sales dropped, on one hand enthusiasm, on the other no proof as sales dropped.

The SPY is now drifting laterally as the market wrestles with QE on/QE off.


SPY bounce on Wholesale Inventories and then thinks twice on Wholesale sales...

The thing I don't like this morning (and I usually don't look at Leading Indicators this early because they haven't had time to move), but I don't like the way credit and Yields are holding up so far this morning.

Those are several assets I'll be watching.


GLD Update

GLD / Gold was hammered at the open on the weaker dollar, but has since re-gained all of the losses and gone green, this may actually be good news for the position, when Wall Street invests money in to something like accumulating a position, say GLD for instance, they defend it, of course taking out stops is all part of the game for them. We'll see how GLD looks in a bit, for now though, an impressive comeback,

GLD intraday

Again, moving faster than I can post it

ES and NQ updated and the Yen looks to have hit a low, perhaps to reverse, but that's too early to say.

 At this capture only a couple of minutes ago ES was 3 points from taking out the overnight low, the entire night of melt-up within 3 points of being taken out in 45 mins., now ES has moved within less than 2 points of the overnight low.

NQ was just above the overnight low, it has now taken that level out.

Jobs level is lost

Now both ES and NQ have lost the pre-jobs level, the QQQ is below yesterday's close, the SPY
is finding some temporary support right at yesterday's close.
 ES gave up all the jobs gains and then some

 So have the NASDAQ futures
As strong as the Yen was overnight, the $USD's strength this morning is playing counter-balance and we are in the twighlight-zone known as the market when good news is bad.

It's way to early for opening indications, but...

I thought the degree to which the SPY and QQQ failed to confirm the gap up this morning would be a good lesson for reading intraday 3C charts, the failure to confirm means, well basically money didn't follow enthusiasm, at least so far. It's more likely money came out on enthusiasm.

 This is one of those moments when the market is moving faster than can be posted, the Q's were at support of yesterday's close, they have already broken that level since this capture a few minutes ago.

The SPY hasn't broken below yesterday's close yet, but is lower than seen here.

The point is the fastest chart, the 1 min should confirm the gap up if it will hold, this can't be taken as a longer term indication, except the early tone it sets as this is an intraday chart, but what it shows is the gap being sold, however if you noticed the ES and NQ charts posted in the Overnight update, they warned of the same thing.

For now we are back to good news is bad news as the fear of the punchbowl being taken away rises, there's already quite a few F_E_D members who want to do it sooner than later and today's jobs report just gives them more ammunition in the debate, that is what the market is responding to.