Thursday, September 22, 2011

FX

Remember this morning's FX post showing the Euro under accumulation?

Take a look at the Euro now.

Here's the Euro rallying from the time the post was written. This is stock market positive, but as always with FX, a lot can change overnight.

Not a bad close

Most people wouldn't look at it that way, but we don't see the market the way most people do.

 DIA makes a new 1 min leading high

 Also a new 10 min leading high.

 IWM makes a new 10 min leading high

 QQQ breaks the day's downtrend line and makes a new 10 min leading high, the Q's shaped up in the afternoon quite a bit.

 QQQ also makes a new 15 min leading high on the day.

 SPY breaks the day's downtrend and makes a new leading 5 min high.

SPY also makes a new leading 15 min high.

TICK Data

The Tick chart showed earlier an opportunity to pick up shares on the cheap, it's starting to break that down channel now.

QQQ/TQQQ

I'm liking the looks of the QQQ a lot better then earlier.

 QQQ 10 min leading positive.

QQQ 15 min just entering leading positive.

I personally would use TQQQ for the leverage.

BAC Trade (long)

I was asked about BAC and believe it or not, short term it looks pretty good.

 Both the 1 and 10 min are leading


And the 15 min is pretty darn close.

GLD/DGP Update

 GLD 5 min negative divergence

 GLD 15 min leading positive divergence

 DGP-Double Long Gold ETN - 1 min negative divergence.

DGP 15 min leading positive divergence.

Recently the relationship that has held somewhere around 80% is risk off in equities, gold rises, Risk On in equities, gold falls, that's about 80% so it bucks the trend once in awhile. GLD/DGP are showing very short term trend negative divergences suggesting a pullback/consolidation, but the larger trend represented by the 15 min chart is still very positive. You could trade around this and sell DGP until risk is off, but I am very well hedged here and will keep my DGP long open.

FX/TICK Data

 FXE-Euro 1 min 3C leading positive divergence.

 FXE 15 min leading positive divergence. Remember I posted the charts on the Euro gaining strength while it was flat and making lower lows, here we are starting to see strength, is the magnitude of the manipulation of the FX/Equities/Commodities markets sinking in yet? It's like they set up the chessboard while you aren't looking. These moves are planned in advance, they only want you to believe that XYZ moved because of some fundamental news.

 1 min UUP dollar weakness that was seen this morning. When the Euro is up, the dollar is down creating a favorable environment for stocks.

 UUP 15 min leading negative divergence.

This was the Tick chart as of 5-10 minutes ago with a slight negative which should provide a little pullback to enter positions at a better price point.

Adding UPRO

I'm going to add UPRO even though I already have some coverage via FAZ.

Market Update

This is pretty incredible...

 DIA 1 min-remember we had accumulation yesterday and today, but look how much stronger the accumulation today is by looking at how shallow the trough of the 3C depth chart (bar chart below) is.

 Here's the DIA 2 min chart with yesterday's accumulation, even in to the initial sell-off right after the FOMC statement, toy can see the crest of distribution fading yesterday and we are at a very shallow trough with a 3C leading positive divergence.

 The 5 min chart is doing exactly what it should and reaching new leading highs on lower price moves, smart money always accumulates into 1) flat trading ranges 2) lower prices.

 Here's the 15 min chart reaching a leading positive divergence.

 This is what is truly spectacular. Look at the 3C depth chart on this 15 min chart, the deeper the rest, the more distribution, the shallower the trough, the more or stronger accumulation. This is a new low in the 3C depth chart, you can see by following the arrows marking the lows of each accumulation zone. This is why I chose the Dow as one of the longs. Usually (recently anyway) 1 day of accumulation led to 1 day of rally, but at these new, unseen lows that we see presently, I have no idea what the relationship would be, this is heavier accumulation then we have seen in 6 weeks.

 IWM 2 min is also very low and a reason I also chose an IWM leveraged long.

 A closer look shows a leading positive divergence on the 2 min chart.

 IWM 5 min chart zoomed out so you can compare the 3C depth chart and see how low the trough is.

 IWM 5 min chart zoomed in, a leading positive divergence and nearly making new highs at new lows in price.

 IWM 15 min chart which is now leading positive and has made a higher low at each successive lower low in price.

 However, the zoomed out 15 min chart really shows something incredible. Look at how shallow the trough is, the shallowest since July and probably a lot further back.

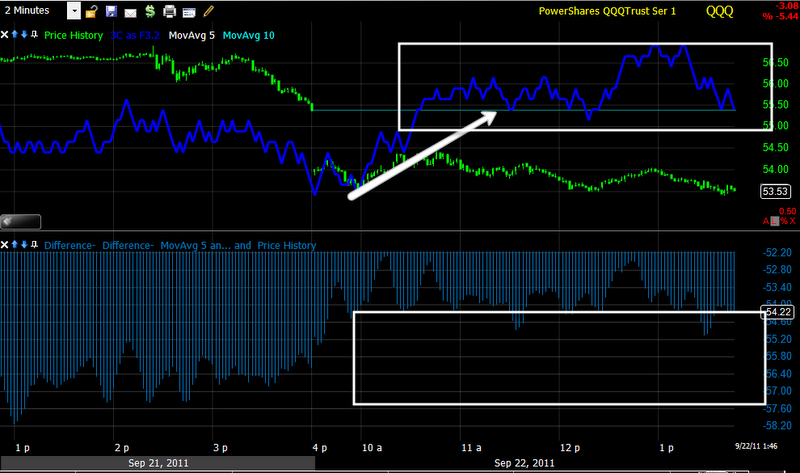
 QQQ 2 min chart is positive, but not showing the same lows in the depth hart, this is why I didn't chose a QQQ long compared to the others. However it is still respectable.

 The 2 min QQQ chart zoomed in closer reveals a leading positive divergence with higher lows at lower lows in price.

 QQQ 5 min showing yesterday's accumulation and today's, somewhere between will be the average and distribution on a move up shouldn't start until that average price is passed.

 15 min QQQ zoomed out, not seeing new lows, but still respectable.

 SPY 1 min in a leading positive divergence today with yesterday's accumulation.

 SPY 2 min chart zoomed out, this is a new low in the trough, not as low as the DIA/IWM, but still a strong signal.

 SPY 5 min chart, note the relative position of 3C, it is in a leading positive divergence, not just for the day, but for the 6 week period.

And the 5 min chart zoomed in to a leading positive divergence making new highs.

The shallow troughs are something of an extreme that we haven't seen before and I'm guessing they have more to do with intensity, as to how that translates in to duration as we had the duration formula figured out, I don't know yet. Either way, it looks like the market is getting ready to put in a strong move up. The longer it accumulates, the longer the move up will be, but it should be enough to create a head fake on the bear flag, I'm starting to think we see two, unless this continues to accumulate over the next several days, then we could be looking at a move up totally different then what is assumed now.

Remember those currency charts

Today at 10:53 a.m.  I posted "FX/Currencies" you might want to look back at that post if you don't recall the gist of it.

Take a look at the real EUR/USD

This s the EUR/USD currency chart (5 min) and the red arrow is when I posted the currency article linked above, the gist was the Euro was showing positive signs and the dollar negative, you can see now the Euro is moving up against the dollar. There's a market correlation there too, a weak dollar helps the market, so in this case, this is the start of an equity positive environment, although the correlations are not at all what they use to be, they still are way above 50/50. I'm interested in the gold correlation as that used to be strong on a weak dollar until it became a safe haven trade, then it had a tendency toward strength on a strong dollar. I'm not the only one who has recently commented on these changing and deteriorating correlations, but they are something to keep an eye on for future confirmation.

Lets see where the Euro wants to go from here.

NOTE on Positions

These positions are going to be comparatively small. I may also end up closing them today, depending on what they do so make sure if you are following along you don't run afoul of Reg. T

Trades

I am going to take some partial positions in UDOW, TNA, FAS, TYH and URTY. Probably about 1/3 at this point of a normal position size for me.

VXX Update

 Look at the depth of distribution on the VXX (trades inversely to the market) 1 min

 2 min

 5 min

Again, I'd like to see this 15 min chart lead negative before entering any long positions.

To be clear, I do not see this as a long move up, unless this divergence continues to build for many more days, I see this as one of probably a couple of head fakes on that bear flag.

So I am not viewing/considering this as a long term trade as of what we see right now.

Market Update

I'm getting lose to pulling the trigger on a partial position, but trying to stay patient here.

Here's what I see in the DOW, which seems to be one of the best looking thus far.
 I like that break of intraday support and the volume ticking up in the area.

 3C has stayed in a leading position on the 1 min

The strength is bleeding to the 5 min.

 I'd like to see this 10 min chart lead.

The 15 min is already leading.

I would be using UDOW if I entered a Dow long position.