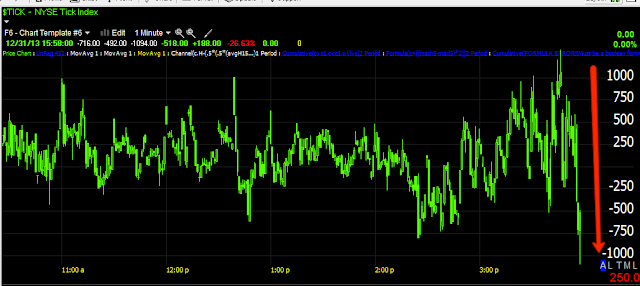
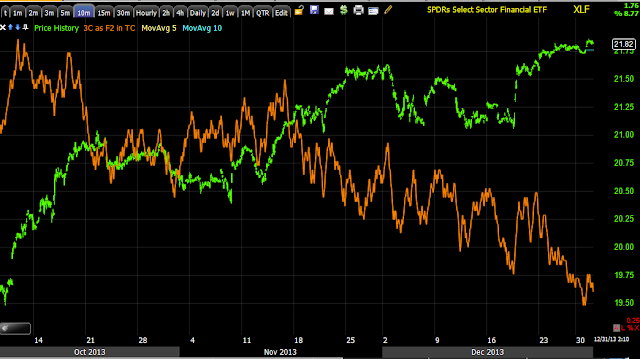
So this is what was expected Sunday on a more condensed timeframe (Monday), I still have the same expectations, just a wider timeframe, I'll probably be able to give you an idea once I see a some more signals, movement is important because it tells us so much about the health of a move or where a set up can be found.
Luckily the AAPL hedge opened yesterday )up +1.16% today) with the MCP gain of 4.09% today has been more than enough to hedge the trading shorts and has pushed the trading portfolio up to a +20% gain for December and this is without the current positions even having moved yet, I just needed to hedge them for a day or so.
I'm looking at a possible AAPL Trend Channel stop of $560.30, it depends more on 3C, but the initial momentum is starting to roll over while I don't want to jump the gun on an asset that is so important to the NDX, I also don't want to lose the hedge value.
This apparently seems to be a "Hold the year's gains" move as many a hedge fund manager's job depends on it as they are already coming in on average at 6% on the year, well below the SPX and they are charging 2 and 20 at minimum for such dismal performance.
The charts... First it seemed obvious via the VIX pin yesterday and the attempt to awaken HYG that there was going to be some SPY Arbitrage, which is not showing up on the model, but with TLT and VXX both down and HYG up, it's the perfect arbitrage so whether the model sees it or not, the algos will read it.
ES intraday as you can see doesn't look so good, TF and NQ look better, but this is definitely worth keeping an eye on especially if SPY starts to deteriorate as badly. Volume looks dismal.
While the averages are still holding enough of yesterday's divergence that I'm not ready to place or fill out the SPXU and FAZ positions, I do see some signs as I was hoping to see Sunday night in to some movement like this IWM chart (intraday) going from yesterday's divergence to a small negative, it has to start somewhere.
The QQQ shows the same positive yesterday and some weakness forming in intraday charts as well.
The divergence from yesterday is much more clear now in the SPY, but was obvious yesterday if you know what to look for, this 2 min chart has moved to an inline status with the gap up.
The 1 min is where the first divergences will start and there's some evidence on the SPY of that happening.
VXX as shown yesterday being pinned, the red trendline is yesterday's close.
VIX futures however on a 5 min chart have really no damage at all, I suspect they are still bid for protection and at this point it can't be for year end protection.
And HYG as mentioned yesterday on a 1 min chart did move higher but this is a weak divergence.
The plan is still the same, gather information on the movement, look for the weakness and an area to pounce.


