Tuesday, May 1, 2012

XLF/Financials Update and some random thoughts

I did not enter the Financial trade in BAC as you would have heard about it before I did it. We've had plenty of really good opportunities to sell in to strength, yesterday was a tough call, but look what we got today. So hopefully you've been able to use this to your advantage.

I'll talk more about the end of this bounce after market, for now, Financials.
 XLF has been sold in to strength, this should be no surprise as I have said they will sell in to any strength probably 6 times a day for the last month. There's the start of a relative positive 1 min divergence here. Remember, they need to sell in to strength, not in to declines.

 The negative divergence today selling in to strength is clear, this is the same thing we have been doing, however as XLF falls back, there's the a pretty decent looking 2 min positive in place.

 I'd have a hard time saying the 5 min is positive, it is just less negative than it was, you have to remember that divergences flow from the shortest time periods (like those above) to the longer time period, it's not quite there on the 5 min yet. What is VERY clear is the selling in to strength.

The danger we face as we move closer to the end of the bounce (as I have already said the last few days-"The cliff ledge is broken, Wiley Coyote just hasn't looked down yet) is that short term divergences get run over by hedge fund managers dispersing the flock to be the first to sell and keep their job, "He who sells first, sells best".

While the 15 min is CLEARLY negative here and this rounding top looks very nasty, the 15 min could be a whole lot worse. The last 3 failed bounces these pretty much were leading negative by the time the bounce failed, so there's still some promise, although as I have been trying to demonstrate with model portfolio trades, the trick is to get exposure, start building a short position in to strength and leave room for the extreme volatility.

Yesterday I said that even though the market was down and was looking ugly, there's certainly enough volatility in this market to take us above the SPX recent highs.

That's exactly what we saw today...

Yesterday's prediction for what we would see in the market looked like this...


Today's market action looked like this...

That's the argument for what volatility can do.

The close to me looks horrible and if I missed out on BAC or another financial today, guess what?

On this weekly chart, we are still significantly high, I can easily grab some FAZ, have financial coverage still at a great price and pick my longer term short on the first shakeout move. I have maintained for some time that I believe the market will take out the October lows, barring F_E_D intervention-but even if they intervene, there's a lot of money out of the market for good, there's some very good arguments being put forth-some directly from F_E_D members that another round of QE is less likely to do what the first two rounds have done.

There's something to be said for "Don't fight the F_E_D", there's also something to be said for the power of mass sentiment and the conditions in place now in Europe, China, the US, etc which form major market cycles.

And remember that the 2009-present rally was in no way organic growth, it is a house of cards built on huge excesses of liquidity so this last move up didn't have the same organic growth that the Tech revolution created to the far left, or consumer spending (even though it was mostly their now foreclosed home equity lines) from 2003-2007. Also lets not forget, the F_E_D doesn't always win...

The F_E_D didn't win this round, part of it was because what was already in motion in the market cycle, not unlike now.

Finally, at the successful intervention (and this is assuming intervention that fills the market with excess liquidity and drives already high food and gas inflation even higher) of 2009 and late 2010, we didn't have Europe collapsing like it is now, China and emerging markets were still strong, not the case now, and the F_E_D's tool box was a lot bigger and their balance sheet was a LOT smaller.

Time to go to work and see how the underlying conditions of today's trade ended.

AAPL Update

I wanted to get this out with Tech, but in the interest of time...
 Daily the candle is not that bullish, the fact it has stayed around support looks better than the candle. Volume is also not huge, which I like for potential upside still.

 The conflict I have talked about is no where more apparent than AAPL, they sold strength all day, this is not quite a positive divergence, but it looks like some support.

 2 min also seeing some very recent intraday positive support and longer term relative support

 The 3 min shows the end of day 3C support the best right around price support.


The 15 min is still positive.

I still have a decent short here, but looking to add on that move higher.

Energy/XOM Update

I expected Energy yesterday to start to rotate out, it has seen a decent day today, the price charts are one thing, but they lag the underlying action.

 First XOM's risk profile here is well within my tolerance, even if they can get a head fake move above this long range, that's why I saved 25% of the position, it has decent strength today on the whole to short in to.

 All of the short term charts are falling apart fast - 1 min

 2 min

 3 min

 5 min

For me, it's worth the risk here with the extra room I still have in the position and its near the top of the range.

Energy/XLE
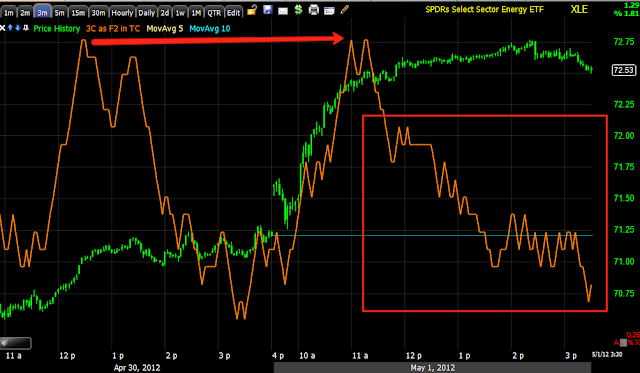
 Seeing the same weakness on the short charts 1 min

 Deep leading negative 2 min

 leading negative 3 min

 same on the 5 min

And a very strong relative negative divergence on the 15 min. Energy to me looks to be at a good place to short considering some probable sector rotation.

Adding to XOM short here

This will take XOM from 1/2 a normal position to 3/4s.

Charts coming

Risk Asset Update

It's good to take a step back, I can just feel the emotions and craziness, that's not analysis.

Our risk asset layout is a detailed version of CONTEXT where we can see exactly what is going on in credit, FX, commodities, sector analysis, etc. This is one of the most useful tools, but it takes a lot of analysis, I think it is worth it here.

If you don't want to read the entire post, the gist is there's still support for higher prices, the hedge fund hotel is starting to create a lot of noise in the market and making it more unpredictable, but the bottom line is the higher we can bounce, the more damage that will be done on the break of the bounce. These calls are getting harder and harder to make, but I think we can bounce higher.

There is some interesting information in the post though.

We'll take a look at the 3 pillars next, just slow things down a little. Unless otherwise specified, each risk asset is compared to the SPX in green.

 Commodities are in line for the most part with the market, this is important as you will see why.

 This is commodities vs the Euro, as the Euro is an inverse proxy for the $USD, they should travel together, this shows commodity strength despite Euro weakness or put another way, $USD strength. Yesterday I mentioned two things that apply to this 1) Wall Street kicked in some support yesterday to keep the market from falling on the bad economic PMI print and to keep the bounce alive and 2) "Once Wall Street sets up a cycle, they usually don't let anything get in the way". This up cycle was set up April 10th and as you can see, although commodities should be lower on Euro weakness/Dollar strength, they are not. This is the manipulation of the market that Wall Street can and does get away with, it's usually confined to tactical short term periods, they can't manipulate the major trend, only the F_E_D can do that, but this is pretty clear evidence in my mind that they have been able to use a few economic or 1 economic data point to fight the traditional $USD correlation today.

 As shown last night, last Friday High Yield Credit was not supportive of the market and it fell, yesterday as I posted, HY Credit was short term supportive and look at where we are today. The fact that HY credit is tracking the market pretty well looks like continued support, even though we have a little sell off in the small red box. Credit is usually pretty negatively divergent at a turning point and it stands out clearly.

 Rates long term suggest the market moves much lower, over the last weak or so they have been diverging which is what they should be doing in this cycle.

 (we are talking about two different or even 3 different trends here-the very near term, the bounce completion and the consequences on the longer term) In the very near term, Yields are supportive of the market intraday, they haven't faded off to a worse position so this looks like some continued support for higher prices.

 This is the Euro vs the SPX, traditional legacy arbitrage should see these moving together, we are seeing some short term manipulation of the market moving it higher against the head winds of a stronger dollar today. This is not often seen, but neither was what we saw yesterday that told us a move higher was coming today.

 Intraday, there's a little support (natural support) building in the Euro toward the EOD trade.

 This is a proxy for the $USD, the correlation in white is the only one on this chart that i correct, the when looking at the day on the whole, stock should be lower in to $USD strength, again, Wall Street is steering the market where they need it to be today.

 Yesterday late in the day one of the biggest tells that the market has support to move higher today was the end of day rally in High Yield Corporate Credit. Note it sold off hard on the market's early gains, since it has jumped back in line and near term is still supportive of the market, when the market has turned on the last 3 failed bounces, Credit was significantly divergence from the SPX, not so here yet. Long term, it is very divergent, but that is for the trend after the bounce is complete.

 Late day we are even seeing some more support from HY Corp. Credit

 Sectors are showing financials and Energy leading, Discretionary was stronger than it should have been yesterday also implying a higher move today, it remains pretty strong. The defensive sectors are losing ground.

 This is sector rotation this afternoon.

 Energy was the strongest yesterday and helped the market stay afloat, it is still lending support.

 Financials have lent support all day

Tech has been the disappointing sector, but we will look at these closer, this is probably largely due to the conflict between higher prices to sell in AAPL and the survival instinct among hedge fund managers to keep their jobs, a powerful mix.


ES Update

 CONTEXT for ES is still holding up, the model is still rich to ES.

On the other hand the negative divergence in ES is just getting worse, this presents a dichotomy. The last 3 failed bounces ES saw a persistent negative divergence, meaning it kept leading lower in to higher prices, all 3 of those bounces failed, so yesterday we were able to look at 3C on ES as an intraday indicator, I'm not sure it is wise to consider doing the same today with the past 3 bounces doing what ES / 3C is doing now. It is negative for the market for sure, but as a timing vehicle, it becomes less useful.

I need to step back because I can feel the emotional pressure and excitement to call this a top and that is not what I need to be doing, I need to be gathering facts. So although I want to keep looking at potential trades as I feel rushed that the market could crack and break down here, I know that the market can go higher in to these negatives. So while I don't want to take the time away from looking at positions, I need to look at our risk asset indicators and see what it going on here. That will be the next post.


BAC Trade Idea-Very Speculative

I'm going to look at a few other financials before deciding whether to start a position here and if I find anything I'll post it before I make any model portfolio trades, but I'm very tech heavy, very financial light.

If I took BAC here, because of the charts you see below, it will be 1/4 position size to allow for room in case, but at least I'll have some financial exposure. I'll be taking a look at GS too.

 This is Paulson's nightmare, selling around $5 after having taken a 50+% loss in BAC to see it double.


 We apparently looked at shorting BAC from my notes and trendlines that were already on the chart and it was near the top in March, there was a triangle that had an upside false breakout before BAC fell-we almost always see the false break before a reversal, I can't emphasize that enough.

 As for a LN channel, BAC was a channel buster on the upside, it appears to be bullish, but it is a volatility change in character that is almost always bearish (I know that sounds counter-intuitive, but it is about the change in the character of the stock. BAC already kissed the channel goodbye, while it is certainly possible for another run to the channel, at the position size I'm considering, I could afford it and I wouldn't be considering the trade if I didn't think there's a good chance that this may be it for BAC.

 The head fake move in BAC? The most obvious is a move above local resistance on a closing basis as well as approaching a breakout on the intraday high, it fell 2 cents short.

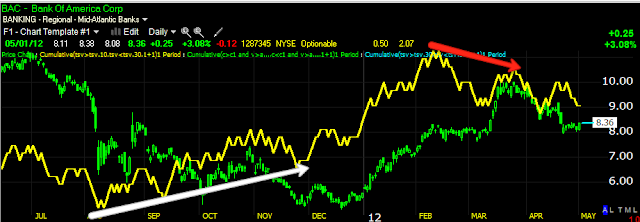
 The daily 3C chart shows the negative divergence as well as the positive that got BAC moving up and called a top.

 Usually BAC responds better to the slower yellow 3C, but as declines are faster than rallies typically, the faster orange version is working better for intraday (more recent) trade. This is where the risk is, accumulation at the white area could send BAC quite a bit higher from here, possibly to the LN channel, however if the market breaks, the greatest directional gravitational pull on prices is the market itself followed by the industry group, in other words, it would be difficult for BAC to fight the market's tide.


 The 15 min chart also shows the positive divergence, I would normally expect a bigger move out of BAC and that is why I'm cautious, but it is up nicely today and shorting in to strength as the market appears to be seeing heavy distribution is what I do.

 Near term the 1 min is negative on this move up today.

The 2 min is negative

 The 2 min is bleeding in to the 3 min

And now starting to bleed in to the 5 min.

This isn't my favorite trade, but it has strength. If I entered it, it is a phased in partial position of no more than 25% regular position size with the rest going to the stop and possible add to positions.

I'm going to look at some more financials before deciding, but it's one with good relative price strength and the short term charts seeing distribution and that's what I want to short in to.