Thursday, May 26, 2011

The Close

Again, today there's no dominant Price/Volume relationship, but another strong day in the averages.

SP&500: 348 gainers
Dow 30: 19 gainers
NASDAQ 100: 76 gainers
Russell 2k: 1519 gainers

Internals weren't as interesting today as technicals. All 4 majors broke out of the trading range I identified in last night's closing post.

Interestingly today the strongest sub-industries included: Jewelry Stores, Internet Service Providers, Photographic Equipment and Supplies, Lodging, Broadcasting-TV, Sporting Good Stores, Residential Construction, Apparel Stores, Footwear, Specialty Retail, etc...

Are you seeing a pattern there? A lot of consumer discretionary, a lot of industry groups that haven't been doing well and aren't expected to do well. This actually makes sense if you look at it in light of why I've maintained my belief that we would not sink lower after Monday's plunge, but move higher and I still feel the chances are pretty good that we will see that head fake breakout. If you understand what the head fake is there for, then you'll understand why all these stocks that would seem odd balls to lead a rally, were the leaders today.

As far as silver goes, I warned several days ago that I see upside there, but be prepared for a bumpy ride. There still appears to be plenty of potential n Silver, today did do some damage though to the mid term charts.

Interesting, the CME hiked some margins and lowered others like Palladium which was on my bearish list specifically. One they hiked was the classic underperforming Natural Gas that was just featured this week as a potential bullish play coming into rotation. I found this very interesting.

I'll write a bit more when I get back, but for now, my mother has just been released from the hospital so I'm headed down to pick her up.

VRML Update

Getting a lot of emails on VRML, I still like it and here's why.

 Everything on the daly chart looks healthy, the volume looks right for a consolidation after a big run like that, MACD looks good as well as RSI.

 The hourly positive divergence before the last run and the current hourly positive divergence.

 On a 15 min chart, positive divergences again, before the last run up and currently.

 On the 5 min chart, the break below the trendline didn't drag 3C down, rather it went more positive.

And the 1 min chart shows this as well.

This isn't my favorite sector, but I'm not looking for a trend here, just a quick, big move up.

The chart, 3C, the consolidation, the break down of the consolidation, all remind me of SQNM which took off yesterday, although I think this one ha more potential upside in a move.

For these reasons, I still like the idea of this trade.

Check out the FSIN Short

It's at the earlier target I said I'd like to short it at today, about $7.00

Just make sure you use that stop or a stop close and don't expose yourself to a lot of risk, the point of waiting was to lower risk exposure.

Also watch position sizing. A 10% gap up shouldn't produce more then a 1-2% maximum total portfolio loss, that can only be done in position sizing.

USO development

This popped up rather quick and rather strong.

SPY -the Forest

This is what I've been looking for, a final head fake, like we discussed today and many times before. Today we are moving a lot closer to that target, when once again, traditional T.A. would argue for the short to have been put on Monday. Traders don't get what they expect and Wall Street makes money.

It still looks like end of day we'll see downside in the market, consolidation, whatever you want to call it, but the thing that has kept me hanging onto the idea of this move higher has been the longer charts like the one below.

So far so good on the 15 min chart's signal that started Monday.

SO this is the broader look at the game I think is being played out. It hasn't been easy to stick with this line of thought through this week, but again, based on the way they play the game, I still believe it's the highest probability.

USO

And here is my earlier concerns with USO coming into play...
We're getting very close to a failed breakout, volume is picking up on the downside a bit too.

Just as a quick reminder, these patterns, in this case, a bearish continuation triangle, "used" to follow the handbook of technical analysis and just break down, thus a bearish continuation pattern. It seems in a large percentage of the cases in which these patterns show up, they are still valid according to the technical analysis handbook, but Wall Street , the black box pattern recognition systems, etc, all know what traders practicing traditional T.A. expect-a clean break down from the triangle, and as such, they use that predictability of technical traders against them and create these head fakes. This is so very common that it's nearly predictable. So the lesson I've been trying to pass on is that these price patterns that you may see as a technical trader are usually good patterns and still reliable, especially the bigger ones, but you almost have to expect a head fake move before they do what they imply.

This is just the nature of how the market has adapted to take advantage of traders who have not. It may not seem like a big move or a worthwhile exercise, but apply 10 or 20x leverage and these head fakes become very profitable for Wall Street.

Market Update

As I mentioned earlier, it looked lke the market was going to break the resistance trendline and we'd want to watch that. I'm using the Q's/SPy for time's sake, but the DIA looks the same.

 Here's a 15 min chart, just to see if there was any volume as none was apparent on the actual break and as you can see, volume on the breakout was average, not a great sign, but not a deal breaker.

 The 1 min is a bit negative here, this also is not a deal breaker as we've had a pretty steady move up since 10 a.m., a consolidation, would not be out of the ordinary, but if this goes leading negative and keeps moving lower, then I'll be more concerned with this move's sustainability.

The 5 min chart is in line, this is why I'm not hitting the SELL switch, if there is any breakdown here, I'd be inclined to look at this as another head fake.

 This is the QQQ, everything is just about the same, except...

 The 1 in chart is leading negative. The 5 min chart below is still in line so at this point I'm giving it the benefit of the doubt and expecting a consolidation. If the 5 min charts start to fall out of line with price, then I'm looking at this again, as a head fake.


The DIA looks just bout the same as the SPY.

USO Update

In my assessment of USO I suspected the breakout of the bearish continuation triangle may very well turn out to be a head fake. It hasn't dropped below the apex yet, but I don't like the way this is shaping up for a long position here for short term plays.

USO part 2

 This 5 min chart represents the breakout of USO from the descending triangle yesterday and the current breakout from a bearish continuation triangle.

This morning formed a sharp negative divergence on the 5 min USO chart. While there is longer term potential on 3C charts for more upside, this pullback looks real. The triangle forming after a downside move is taken to be a bearish continuation pattern, but these are always broken up with head fake moves.

If you are trading this leg in USO, be aware of any move below the triangles apex (point) as that will likely identify this upside move as a head fake. If 3C responds favorably to the breakout and no negative divergences form, then this may be the extent of the pullback. It is pretty early for a pullback with the breakout occurring only yesterday.

If you are one of our more active traders and trading this leg, make sure to keep in touch.

Dollar Update

The dollar is moving down, which has let up the downside pressure on Silver, USO could be next to see some upside intraday.

Market Pivot

Action in the markets may seem a bit subdued, but we are actually nearing an important test in several averages including the Q's and the SPY.

 QQQ nearly breaking out of the range.

 The SPY is similar, I've drawn the trendline the way I did because the 5/25 breakout was confirmed to be a false move.

Last night I showed you the correlation between the Australian Dollar (FXA) and the market and how the FXA often leads the market. Note FXA gapped up today and is moving higher currently.

This potential breakout will be important to validate or recognize as a false move.

FSIN Follow Up

I mention FSIN yesterday as a Chinese short play you may recall yesterday it broke below a multi year top/range on volume. The thing I didn't like about the trade was the fact it was down so much yesterday and thus wasn't in a good risk management position. Today it's up 8+% but still fighting with that long term trendline. It was up 14% earlier today, but higher prices, which were above the long term trend line were rejected, thus far any way.

There's always the possibility of some more upside as the market likes to knock around these important trendlines for a bit, driving traders in and out of positions, but all in all, the risk side of the trade looks a whole lot better today. Patience!

 Today's attempt to break above the trendline.

 3C showing a rejection of early opening gains of about 14%

This trend channel setting has held since FSIN started down in March, the closer the execution of a position to the red box, the better for risk management. I don't if it gets that high though. If you like the trade, keep in touch.

VICL Long

VICL has made some money for us, close to 100% depending on when you got in and out, but it was in need of a pullback, which has happened and now VICL looks to be preparing for another leg up. In the current position, I'd call it a high probability, low risk trade.

 A little deeper then normal pullback, but VICL had a very parabolic move toward the end.

 15 min pos. divergence

 10 min positive divergence

5 min positive divergence

This is the type of confirmation I like to see.

I personally would use a stop below yesterday's lows around $3.67

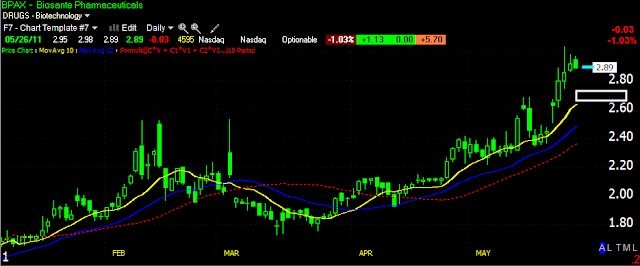
BPAX

Yesterday I warned about taking profits in BPAX as it looked ready for a pullback. I still think there's a good chance of further gains after a consolidation, but lets cross that bridge when we get there. For now, I'd hate to see anyone lose the gains in this one.

At the yellow 10-day moving average, BPAX will probably be worth a look to re-establish a position as it had a nice base to work from, but why take that loss in the meantime?

Market UPDATE

The SPY/DIA look like they may be stabilizing

 DIA 1

SPY 1


The R2k and Q's are not showing the same signals right now.

UUP

The dollar may be getting ready to rollover shortly

This should let up on the downside pressure on most of the market

More News Pressuring the Euro, lifting the Dollar

Just got this news:


Euro vs US Dollar Euro off its session highs following Juncker comments that IMF might not release the next tranche to Greece in June

(EU) ECB's Gonzalez-Paramo: Feels Spain has some issues that must be resolved; Regions in Spain should aim to meet their deficit targets to calm investors

Bank of Ireland (IR) Ireland Fin Min could force losses on sub debtors in a junior debt for equity swap scheduled for tommorow - financial press
- Losses could be forced if some debtors refuse to take the offer

USO Decision

I personally don't like the action in USO this morning. It still looks like a pullback, the dollar still hasn't dropped as it came off its morning lows. I think I'd rather take profits here and take a look at USO when it stabilizes and the Dollar drops a bit.

USO Update

 USO 1 min looks like a consolidation, maybe an intraday bounce thus far.

 5 min- The drop in 3C on the open as seen above, looks more like USO wants to pullback a bit here.

The longer term still looks like there should be more upside.

I'm trying to decide whether I'd close a USO position or ride it out at this point. I think I'm going to delay that decision to see what comes out of the 1 min chart.

Wondering What Caused that Bump in the Market

It looks to me to be about the dollar gaining ground, which is probably connected with a comment out of the IMF that inflation is a non-issue in the US.

While Silver was expected to experience one of those bumps today from overnight trade, everything else seems connected to this bump up in the dollar. I imagine the market will settle back in soon.