"There are numerous smaller indications that make me think we either open higher early next week or we try to put in more of a base for a bounce, but I mean bounce in the most nearly meaningless way, nothing I would trade (other than a speculative position) and nothing that would make me think that our course is going to be interrupted by anything more than some short term noise if that."
Today looked a lot like that "trying to put in more of a bounce for an early week bounce", however it's important to take the forecast above for what it is. This is the 5th consecutive red close for the SPX, with the 200-day expected to act as a brief speed bump and after that, everything changes.
It appears the retail crowd who was so bullish on Friday with the "Buy the Dip" motto have changed their mind today which is perfect for the Week Ahead (early option of the week) forecast above.
Although staging and cycles sound like arbitrary malarkey, do you remember what I said in last Friday's The Week Ahead forecast?
"I'm fine carrying some downside positions in to next week, including Trade Ideas from this week including FAZ (3x short Financials), SRTY (3x short Russell 2000), UVXY (32x long Short Term VIX futures), SQQQ (3x Short QQQ), QQQ 8/21 $112 Puts, BIS (2x short NASDAQ Bio-Techs).
The EUR/USD which as a carry cross has sponsored this week's bounce along with HYG, some VIX smack-downs, is clearly looking to make a downside reversal."
I say this often because I mean it, "You have to know where you are to know where you are going" and staging a cycle, especially when we know what the underlying trend is well before is the easiest way to not only know both of those things, but to use price to your advantage. For instance I asked numerous times during this bounce from July 10th after showing the short term and long term 3C charts, "How would you trade this?". The answer from the charts alone was simple, sell/short in to price strength.

Stage 2 mark-up has decent confirmation (3C) and stage 3 top/distribution goes negative and puts in the tell-tale Igloo/Chimney head fake (yellow) that we see before 80% or trend reversals in any asset and any time frame, it just needs to be confirmed and the negative divergence on this 15 min chart confirms, although more detailed charts did it earlier.
Stage 4 comes nest, that's decline, that's what we knew at last week's The Week Ahead, that the week ahead (last week) was due to move to stage 4 decline and has now erased the entire bounce.
Also not the long 100-period Stochastics I use not as an overbought indication, but as a trend strength indication; it dumps right at the head fake (the best entry we can ask for and exactly where we opened QQQ puts).

A more detailed 5 min chart shows the previous bounce off the SPX's 150 dma as well as the small accumulation at stage 1 which was not strong enough to show up on a 5 min chart telling us this bounce was doomed to fail before it even started, so how do you trade that? The same way smart money set up the bounce to be traded, tom sell or short in to price strength. These cycles are all pre-determined, they are not random.
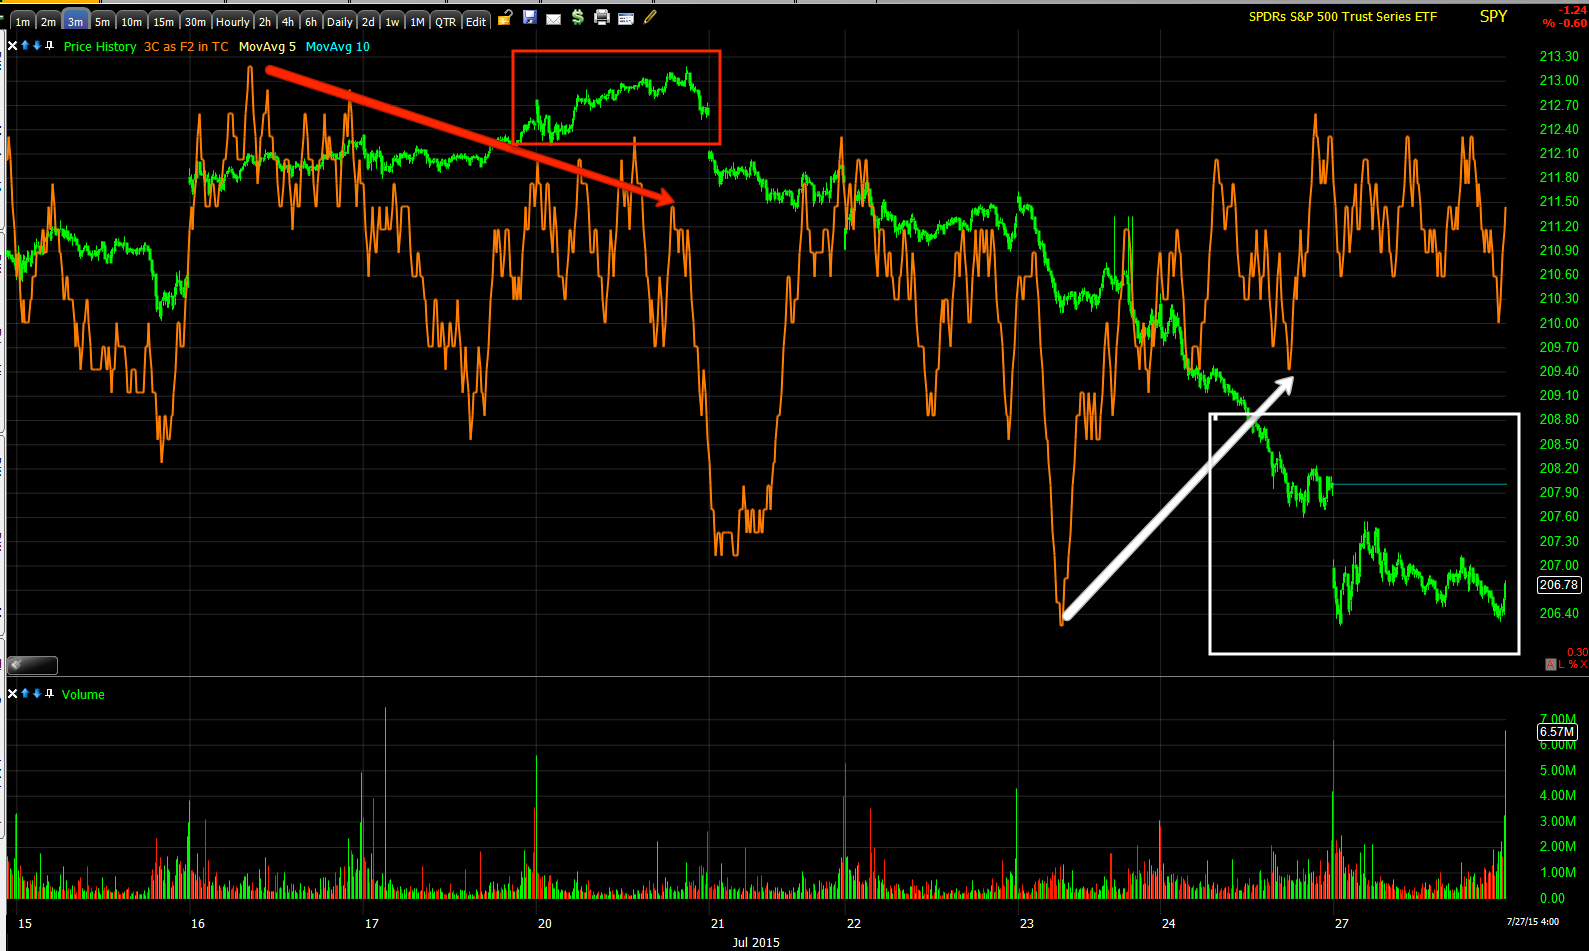
As for the market strength, look at point "A" and point "B" which have nearly the same price level in the SPY, yet look at how much lower 3C is at point "B" as it sees continued distribution as the primary trend.
So any bounce we may get early this week should see what in to price strength?
Speaking of which, earlier today I was showing you the Daily Candles and where I thought they'd close to set up a bounce. Remember I wanted to see price come back down intraday toward the a.m. lows (Intraday Update and Possible Trade Plan/Idea)? This helps set up a stronger base that can support a bounce, although I clearly don't expect anything of much significance, but the retail crowd have already flipped sentiment from "Buy the Dip" Friday to bearish today. The market seems to do a great job of making the largest number of people WRONG at any given time.
From the link just above this morning:
"Since capturing the charts above, the NYSE TICK (intraday) looks like it will break the channel to the downside, that could lead to the conditions I'd be looking for to add to the Trade Idea: VERY SPECULATIVE IWM call partial/speculative position from Friday. Usually right around the European close we get a change in character in intraday prices so it may be a point of interest in any short term speculative long positions."
This gave us the exact closing candles I had posted earlier in the day that I hoped we'd see on the close...
 DIA 3 mi chart positive divergence with lateral trade intraday today.
 QQQ 3 min intraday positive on lateral trade as well.
 IWM which is my favorite for a bounce has a positive divergence, although small, out to the 10 min chart.
 And the SPY has a similar chart to the DIA/QQQ 3 min leading positive and lateral trade.
 This gave us those closing reversal candlesticks that make a bounce more likely such as the DIA's Morning Star candle on increased volume which makes the candlestick reversal 3 to 4x more effective or probable.
 The IWM was just a bit wide in the body for a star, but there it is right at last ditch local support.
 The QQQ daily shows the head fake above the multi-month resistance range to have been a head fake as we called it with out entry in QQQ puts at the very top on the 20th of July.
Note the head fake below the Ascending Triangle that drew in new shorts and created short squeeze momentum once they started covering as price moved back in to the triangle with another head fake above it as we saw distribution up there. This also gives us a Crazy Ivan shakeout on both sides of the triangle which is too large for a normal consolidation/continuation price pattern in the first place with volume completely wrong.
 And the SPY putting in a bullish reversal Morning Star right at the 200-day, the only thing that would have made it more probable would have been an increase in volume over Friday's.
Remember this morning's sell off as depicted by the NYSE TICK with an extreme of -1819, Opening Indications?
That was a pretty extreme reading for TICK even during the stage 4 decline, something about weekends and traders who have a 9 to 5 putting in their orders to fill at the cash open. In any case, at the same time market support came in the form of yields, take a look...
 30 year yield in red vs the SPX as the TICK hit an extreme of over -1800, it seems yields ad their magnetic quality lifted the market right out of the pits early on.
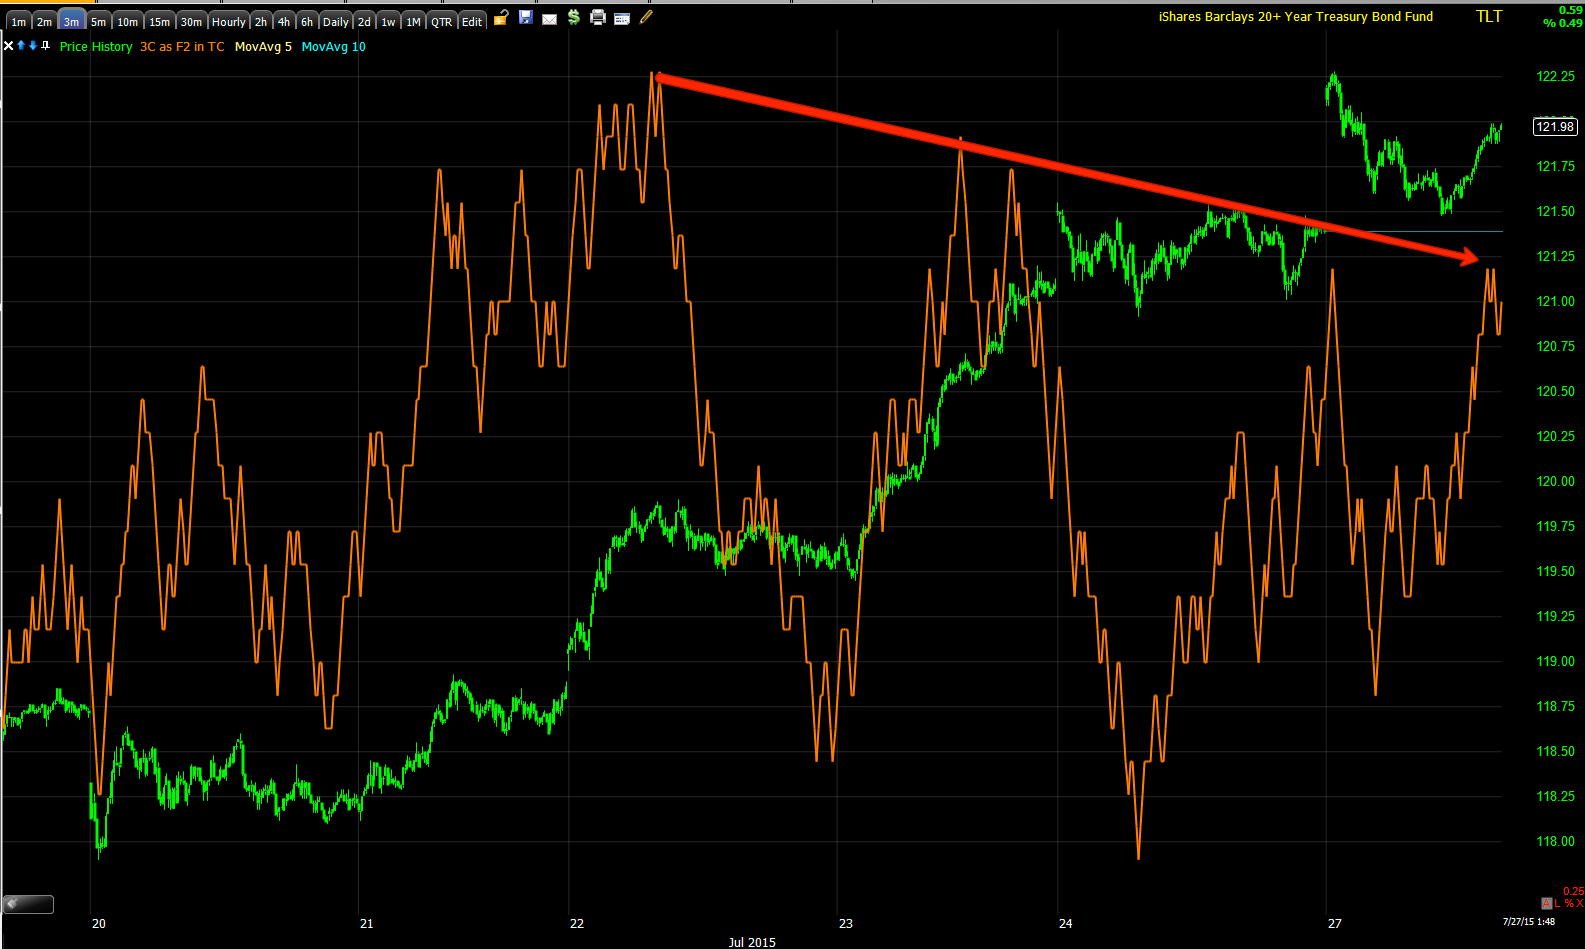
As a reminder of yields' ability to act as a magnetic leading indicator and what this market looks like beyond an intraday stick save, here's a longer view of the 30 year yields...
 First they led the market to the upside at stage 1 and the start of stage 2, then they negatively diverged in to stage 3 and were leading lower by the time the SPX made its head fake and are still leading lower bigger picture.
Leading Indicators were pretty subtle today, but they were either in line or slightly positive, not leading negative as they have been the last 1-2 weeks.
 Our custom SPX:RUT indicator went flat on the day vs the SPX (green).
 Pro Sentiment turned lateral with the SPX.
 And HY Credit which had been leading to the downside made a right hand turn lateral. However this is intraday and I don't want to make a bigger deal of a probable bounce than it is so for some context...
 HY Credit in to the last bounce cycle starting 7/10 vs the SPX (green).
 And the longer term HY Credit vs the SPX leading negative with only 1 positive divergence right at stage 1 /base of the mid-July bounce.
I wouldn't say the market is screaming for a bounce, but I do think it will get one. This wouldn't change any trend positions whatsoever, other than to maybe open a few new ones if we get a decent enough move to make them worthwhile, otherwise I've just been letting positions work.
As for futures tonight...
The Yen and Euro Futures look to come down short term...
 Yen 3 min Futures negative
 Euro futures 5 min negative,
Both would suggest the $USD benefit and thus the USD/JPY benefit which has been pretty ewell correlated to ES/SPX futures which are now just about in line...
 USD/JPY in candlesticks and Es/SPX futures in purple have reverted to their mean near term so any weakness in the Yen or Euro would benefit the USD/JPY and help support the market, but these are all VERY near term, along the lines of the probable bounce.
Beyond that, I expect the USD to head lower...
 60 min $USDX large negative divergence.
 Daily $USDX should head lower later in the week.
As for Index futures, VERY near term the 1min Russell 200 futures look the best going in to the overnight session, but this is intraday 1 min charts ONLY!
 TF 1 min positive divergence going in to the post market session.
 However at the 5 min chart which is the minimum signal for any position not considered absolutely speculative, 3C is in line with price which indicates confirmation of the downtrend. This would need to have a positive divergence to consider any trades that weren't speculative on the long side, otherwise it's a great indication for letting current shorts continue to work for you.
 The more important 10 min chart is also confirming the downside, although not leading like last week, this still points to lower prices this week and when we talk about a bounce, we are talking about something at this point that is so minor, it's nearly noise. We have 1 speculative position out, but even at a total loss on that position it would hardly put a dent in the gains of core shorts we have opened over the past week/s, months.
I really don't see much sticking out other than what I showed you intraday and with the daily bullish candlestick reversal signals, but those don't have any target, they could be a 1-day reversal and then back down and only about half had the increasing volume.
As usual I'll take a look at futures before I turn in and if anything stands out I'll post it. Otherwise tomorrow I expect a bit more of the same, we should have a better grasp on the probabilities for a bounce and if so, where to, but the theme for the week looks to be lower and once the SPX 200-day is broken, sentiment is going to change fast and for the worse.
Have a great night.
From the link just above this morning:
"Since capturing the charts above, the NYSE TICK (intraday) looks like it will break the channel to the downside, that could lead to the conditions I'd be looking for to add to the Trade Idea: VERY SPECULATIVE IWM call partial/speculative position from Friday. Usually right around the European close we get a change in character in intraday prices so it may be a point of interest in any short term speculative long positions."
This gave us the exact closing candles I had posted earlier in the day that I hoped we'd see on the close...


Note the head fake below the Ascending Triangle that drew in new shorts and created short squeeze momentum once they started covering as price moved back in to the triangle with another head fake above it as we saw distribution up there. This also gives us a Crazy Ivan shakeout on both sides of the triangle which is too large for a normal consolidation/continuation price pattern in the first place with volume completely wrong.

Remember this morning's sell off as depicted by the NYSE TICK with an extreme of -1819, Opening Indications?
That was a pretty extreme reading for TICK even during the stage 4 decline, something about weekends and traders who have a 9 to 5 putting in their orders to fill at the cash open. In any case, at the same time market support came in the form of yields, take a look...

As a reminder of yields' ability to act as a magnetic leading indicator and what this market looks like beyond an intraday stick save, here's a longer view of the 30 year yields...

Leading Indicators were pretty subtle today, but they were either in line or slightly positive, not leading negative as they have been the last 1-2 weeks.


I wouldn't say the market is screaming for a bounce, but I do think it will get one. This wouldn't change any trend positions whatsoever, other than to maybe open a few new ones if we get a decent enough move to make them worthwhile, otherwise I've just been letting positions work.
As for futures tonight...
The Yen and Euro Futures look to come down short term...


Both would suggest the $USD benefit and thus the USD/JPY benefit which has been pretty ewell correlated to ES/SPX futures which are now just about in line...

Beyond that, I expect the USD to head lower...


As for Index futures, VERY near term the 1min Russell 200 futures look the best going in to the overnight session, but this is intraday 1 min charts ONLY!


I really don't see much sticking out other than what I showed you intraday and with the daily bullish candlestick reversal signals, but those don't have any target, they could be a 1-day reversal and then back down and only about half had the increasing volume.
As usual I'll take a look at futures before I turn in and if anything stands out I'll post it. Otherwise tomorrow I expect a bit more of the same, we should have a better grasp on the probabilities for a bounce and if so, where to, but the theme for the week looks to be lower and once the SPX 200-day is broken, sentiment is going to change fast and for the worse.
Have a great night.