Friday, October 24, 2014

Daily Wrap

In mid-October after a horrendous decline and even worse bearish sentiment, at zero on a scale of 0-100 in the Fear and Greed Index, we predicted that this wasn't going to be a bounce, but a sentiment changing move, that it likely was going to be a sharp upside reversal rather than the normal reversal process which it was as well. The SPX regained its 200-daym, it's 100-day and the area we expected on a short trade volatility shakeout, the same concept as the H&S initial neckline break and following shakeout of new shorts.

SPX breaks above the blue 200-day, yellow 100-day, 2013 uptrend line and the Broadening top's neckline, which was the main target. In the process the SPX saw the best 2 week swing since December 2011 and the best week since June 2013, that should change sentiment as the boat was way too crowded on the short side and just to illustrate a point, the Most Shorted Index saw one of the biggest moves in years which was the initial premise of such a move after Q3 window dressing was completed and before we had the first sign of any accumulation. Small and mid-caps were among the most shorted and they were squeezed higher, although on today's op-ex pin, small caps underperformed.

This is what nearly 2 weeks of accumulation buys, remember it started Oct. 2nd and ran through Oct. 15th. True to the concept, ALL of the major averages ran above the level at which we first saw accumulation despite how much longer it went on at lower prices as is always the case.

Still, the SPX is red for October.

Once again, as the trend has been for October (above average volume days have been down and below average volume days have been up-the exact opposite of a healthy market), NANEX proves to us that liquidity in the S&P E mini contract was abysmal...
NEAR RECORD LOWS!

And that's how they get it done, just like this week's break in the NYSE of 150 symbols including XIV which ripped higher on no liquidity and the market followed it. Otherwise they've been breaking exchanges (whoever they are) with quote spam, 10,000,000 quotes a second until an exchange breaks and liquidity falls apart, interesting all of the ways they have learned to manipulate a market.

However the big event the market may be looking to front run next week is the F_O_M_C on Wednesday, this time no press conference after and Monday is the last scheduled POMO day with a Billion dollar POMO scheduled which "should" finish QE unless Bullard gets his way and they continue at a pace of $15 bn a month until December, but we didn't hear about that ever before until the minutes from the last meeting were released with concerns over global growth due to a strong $USD, then QE noises were made which of course drives the $USD lower so I think it's jaw-boning the USD which just had the first weekly close up in the last 3 after about 12 weeks of gains previously on EUR and JPY weakness.

I personally doubt they change QE, I don't think it's a matter of QE, employment, inflation or anything else, I think it's a matter of the F_E_D's balance sheet as the BIS recently stated, it's so bloated they don't have the capacity to respond to even a run of the mill recession. Don't forget, the F_E_D has shareholders too.

Despite how strong this rally was, despite whether it succeeded in swinging sentiment, it did succeed in getting shorts to cover, the bottom line is market breadth hasn't improved and is as broken as ever which is just a house of cards waiting to come down, actually a house of cards that has already started coming down.

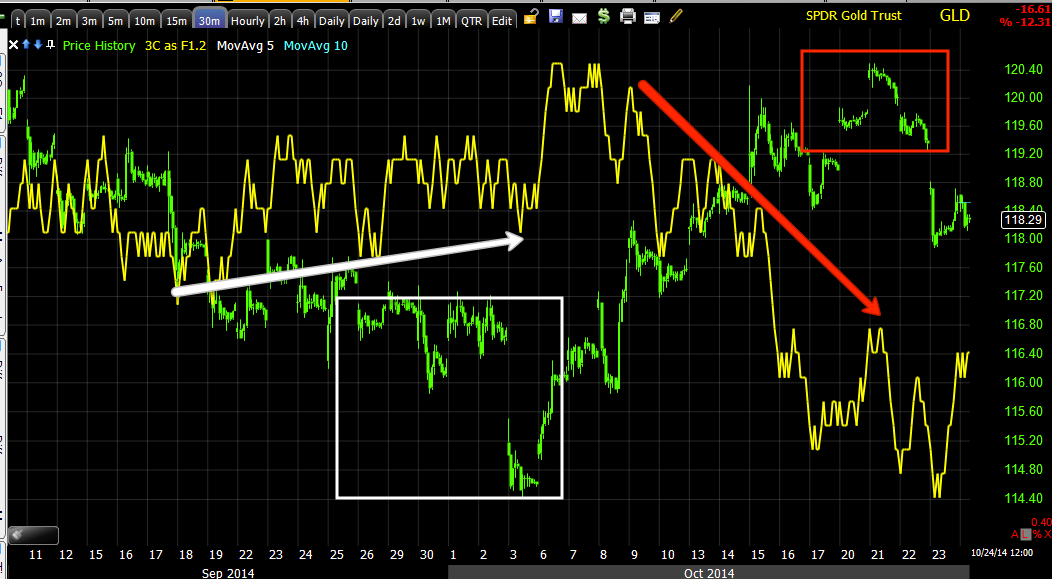
As to the additional charts I mentioned, as I said I suspect early weakness next week judging by this short term SPY chart.
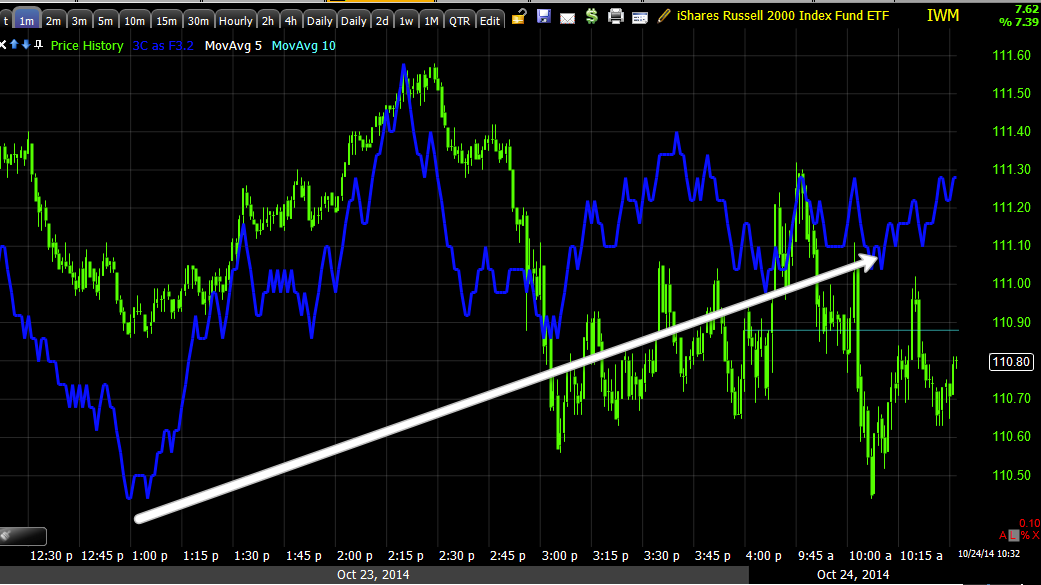
 SPY 1 min

QQQ 1 min in a range

And the larger picture, IWM 10 min, although I suspect there will be some initial relative performance issues between the SPX/QQQ and the IWM early next week.

Other charts...

While no one chart is a Holy Grail, as I said earlier today, it's a matter of probabilities and which way they are pointing, that's the best you'll get unless you wait for the move in which case you missed it.
 The longer term Custom NYSE TICK Indicator showing breadth running low in the uptrend.

HYG distribution as I posted in the middle of the week,  you may recall before the move started me showing HYG accumulation and saying, "There's only 1 reasons they'd accumulate HYG, that's to support a market rally", now we have the exact opposite.

HYG's actual price is the leading indicator as you can see it has been lagging the SPX the last few days, 3C signals are just early warning that this scenario is a high probability.

 Professional sentiment has also been lagging this week and today specifically...

Pro sentiment refusing to follow the SPX any higher, in fact moving lower.

And one of my favorite, Yields as they tend to pull equity/SPX prices to them like a magnet as they are leading negative, wait until you see the 30-year yields vs the SPX below.

Interestingly the VXX/Short term VIX futures was one thing I was looking for to enter final short positions, today it clearly outperformed the SPX in green which has its price inverted so you can see what the normal correlation would look like. Perhaps hedges in to the weekend? Perhaps, but with everything else, I suspect there may be more than meets the eye beyond hedges.

Given everything we see above, remember the 15 min VIX futures leading positive I showed earlier in the week? This doesn't look like last minute Friday hedging for the weekend.
15 min accumulation of VIX Futures nearly all week, but growing in strength in to the later part of the week.

And spot VIX vs inverted SPX prices also showing more resiliency than would be expected.

That comes complete with a VIX Bollinger Band Channel Buster and...
a clear VIX sell signal from our custom DeMark inspired buy/sell indicator meaning it looks like we may have seen a flameout here as well.

And the 30 year rates vs the SPX. The last several times they diverged negatively the SPX lost, the only time they diverged positively the SPX gained and now they are at one of the largest divergences again.

The Dominant P/V Relationship for all of the averages except the Russell 2000 which didn't have one was a second day of Close Up/Volume down, the most bearish of the 4 relationships. During the decline we saw these in clusters as well rather than the normal 1-day overbought/oversold. There were 24 Dow stocks of 30, 76 NDX of 100 and 319 SPX of 500 so it was VERY Dominant.

As for the S&P sectors, again 7 of 9 were green like yesterday but with Healthcare leading and Energy lagging. Of the 238 Morningstar groups, another whopper at 194 of 238 green, like yesterday creating a 2-day overbought condition and...
Market breadth is still no better for it, the pilings under the pier are as rotten as ever (% of NYSE Stocks > 40-day m.a).

I look forward to getting back on the short side and making more money on the next inflection point, I hope you have a GREAT weekend.


The Week Ahead

I think as I said this morning, we pretty much have expectations down for next week's theme, in case it's not obvious, I'm pretty much back to fully short, initially looking for a wider base, but if we don't see accumulation on the way down, then those shorts will just stay in position until the next inflection point.

I have quite a few charts leading and otherwise, most you have seen, I'll post the others after the close, but they are all pointing at the same thing as well.

We do have the F_O_M_C next week, remember to beware the initial knee jerk reaction, the past several ones have been badly wrong and retraced in a big way.

Right now I'm expecting we'll see downside Monday, although there may be some relative performance difference as we have been seeing, largely between the major averages and the IWM.

This is one of several reasons I suspect that...
SPY 1 min intraday looks like we see weakness early next week.

The damage done in October in my view is the market front running the F_E_D. I'm not sure the F_E_D could do much on the QE front as small as it is now, even if they delayed an exit, I just don't think it would matter, it will be all about the dots and rate expectations, but initially I suspect the market will front run the F_E_D again to the downside.

Hopefully you were able to use the price strength and recent underlying weakness to get in to some positions, but remember, there's a bus every 30 minutes, no need to chase anything.

Have a great weekend (Additional charts to come).


Anchoring Expectations

I received an email from a great member and friend in which the concern that the market feels like it may never drop and I reminded my friend that it was just mid October in which it felt like the market would never rise, the Fear and Greed index that runs from 0-100 had been pegged at 0, the most bearish for nearly a week. The point is not about my friend/member, this is something we all deal with, it's emotions in the heat of the trade and they rarely serve us well.

Sometimes I think it's good to go back to what we were looking at and forecasting before things changed so I want to just touch on a few posts from mid-October which I had said I was trying to "Anchor" expectations so you could use moves like this to your advantage , so you'd know what to expect and hopefully not get bogged down in emotions and miss great opportunities as our emotions are often the best reverse indicator we have.

From an October 13th Market Update, 2 days before the market lows were put in...

"The 5 min chart which is usually the timeframe I use for trades is obviously not enough, this tells me this is likely to be more than just an oversold bounce, but a sentiment changer and this is why,  once again I try to anchor expectations before anything happens. Right now it's difficult to believe we'll see a sharp upside move and that move we can use to short select assets in to, but once a move starts, sentiment changes fast so I want you to see all of this before hand so when you see it in reality, you knew what to expect, you aren't caught up in the emotions that these type of moves are designed to stir and you can make the trades that are otherwise, emotionally very difficult." 

From October 14th's post, the day before the market lows were put in, XLF & Market Update

"this as a broadening top would have pulled in the retail shorts and just like the H&S shakeout, this would be a perfect place to shake them out with a move above the trendline that shakes them out and then fails to a lower low, whether it makes a right shoulder or not almost seems like a moot point being the neckline is already broken.

The larger point is this looks to be shaping up as a rather larger or strong counter trend move/correction, so once again I mention that to anchor expectations as it's one thing now when sentiment is bearish to say, "I'll use any price strength to short in to", but when sentiment changes on a strong move, emotions take over, this is why I try to anchor expectations before we get to an emotional stage with objective data.

The name of the game for now however is still patience unless you are doing some day trading which I'm putting out the market signals fi like the last pullback signal intraday."

And finally from October 15th, the day of the market lows that led to this move higher at 1:04 p.m., Important Update...

"I'm not worried about the size of the move, I'm worried about how fast it can flip and that's why I'm spending most of my day flipping back and forth between about 20 assets looking for those signals as I suspect this is a move we don't want to miss.

Also I want to post this to anchor expectations as this gives us another chance to sell short in to strength, but it will be emotionally difficult which is why I bring it up now before there's any upside or emotions that come in the way of your emotions and making the trade, the market will make a lower low, but look at the 1929 breakdown and the first counter trend rally of about 50% shortly after, they are strong, impressive and their job is to be convincing, you just have to know it's not going to last."


This isn't about a victory lap in predicting a strong move which this has been one of the strongest moves we have seen in years in many assets, nor about the sharp reversal which is not normally what we look for, nor the upside target which we hit, it's not about the trade idea on Oct 14th that would have gained 14% or about the opportunities right now to get in new positions for a new leg lower or a trade inflection point. This is about emotions. I'll always try to anchor expectations ahead of time, but like they say, "Every boxer has a fight plan until the first punch is thrown."

Emotions and sentiment are funny things, they often paralyze us when we need to be the most proactive and they are often the best reverse indicator we have. Just remember, the best that you'll ever get from the market are probabilities and you make the best choice you can with the data you have and you are well served by sticking to the probabilities and the data and doing everything you can to put the emotions where they belong , outside of your decisions.
 

AAPL Update, Another Head Fake Move...

Just to be clear, I think AAPL will hold out longer than most just as many large cap/blue chips did in 2007/2008, although they eventually lost ground, but not as much and this is because long only funds only have so many choices so they are engaged in a flight to quality / dividend trade. If you have nothing but bad choices, you try to make the least bad choice,

However since we have talked about this concept 3 times in the last 2-days, I figured AAPL, which I've been asked about by several members recently,, would make a good example to carry on the concept of the head fake move.

The more of these I see recently on the lift from Oct. 15th, the more I'm convinced this wasn't just about the broad damage in breadth, but also some areas set up for head fake moves that Wall St. could take advantage of, I mentioned a few yesterday including XLF/Financials.

 From left to right on the Daily chart of AAPL, we have an uptrend at #1 in to a consolidation/continuation price pattern, a symmetrical triangle which has no continuation bias other than the preceding trend which was up so technical traders are looking for a break out to the upside as the triangle's apex forms. At #3 we see the opposite of what they expect to see with a break below the triangle/support, remember what the TA rules are, "If a trade goes against you, reverse positions ) and in this case go short which would have been a big mistake as they'd be chasing price and easily stopped out on a reversal to the upside probably with a fair amount of risk with stops inside the triangle. Once again, another failed move which would suggest going long and AAPL finally breaks out as the price pattern suggests,  however the first head fake break lower created the upside momentum for the upside breakout via short sellers being squeezed and forced to cover, in the process soaking up supply and creating demand which moves prices higher and thus you have a sling shot momentum, head fake move.

 The longer/intermediate term 30 min 3C chart shows the distribution/accumulation that forms the triangle whether purposefully or not and then clear distribution sending prices below the triangle.

Note there's not any accumulation on the break below, they don't need it as the short covering will lift prices for them without having to invest much in soaking up supply.


The shorter term , more detailed 15 min chart shows some accumulation after the break below the triangle, these are the piggy back longs we often take even if the bigger trade is to short AAPL in to price strength.

 And as AAPL makes the upside breakout, distribution or selling short in to price strength has already begun.

 The more detailed 3 min chart shows it more clearly.

As does the 2 min. I think there are better trades out there, but if AAPL stays in the area and I can't say it will and continues to distribute until we have 15 min negatives, then it's probably worth considering as a put/short trade.

However, the head fake concept should be very clear as we have seen 3 in as many days that are exactly alike.

Desperation

Overnight the market was headed lower when someone stepped up, some assume it was the Plunge Protection Team, it could have been options sellers looking to cash in today on all of the worthless option contracts that will expire today, allowing them to keep the premium, but there was an attempt to hold the market off from an overnight decline and we opened just as we almost always do on an op-ex Friday, right near Thursday's close.

Over the past few weeks we've heard some pretty amazingly ridiculous stuff from Central Banks such as the San Fran F_E_D saying, "Perhaps QE4 is in order" or Bullard's, "Perhaps we shouldn't end QE3 so quickly" when it's just a fraction of what it was and on track to end this month. These weren't serious comments, they were jawboning and I suspect largely to drive the $USD down as the F_O_M_C minutes from the last meeting show, the F_E_D is concerned about a stronger dollar and its impact on the global economy, however there's one group of people who will be happy with a stronger dollar, the Americans who did the right thing and saved money which they saw evaporate in terms of buying power during the F_E_D's accommodative policy, however with that ending, savers will be rewarded, funny that the responsible ones were the ones punished, but as I've ALWAYS maintained, QE was not about the "wealth effect" as most Americans have no exposure to the stock market with employers cutting benefits like 401ks, QE was nothing more than a stealth bank bailout because we saw how unpopular the real bank bailouts (and AIG) were in 2008 with the voting public, NOT AT ALL.

Today it was the Jaw-Boner in Chief, Mario Draghi of the ECB's turn to come out and try to tickle stocks higher with several comments like...

 CALLS FOR STIMULUS: CNBC
DRAGHI SAYS JOINT EFFORT NEEDED TO AVOID RECESSION: CNBC
DRAGHI SAYS INFLATION TO REMAIN LOW IN THE NEAR TERM


Which is all subterfuge just as ridiculous as the F_E_D last week. I've spent a lot of time in Europe and understand the peoples' perspective of becoming part of the European Union, but what you have to understand is it's nothing more than a German Free trade zone as Germany is the manufacturer and exported of Europe unless you call olive oil a major economic export. The EU created a free trade zone for Germany and the ECB is essentially run by Germany just as the IMF is run by the U.S.

All of the above spouted by Draghi, master jaw-boner, is an absolute "NO" from Germany meaning it won't happen, but that wasn't the point, the point was to lift equities enough as they had been slipping in the overnight session.

As for where we are now... THE SPX/RUT RATIO IS NOT A PERFECT INDICATOR, BUT IT HASN'T GIVEN US BAD GUIDANCE SINCE WE RECENTLY INTRODUCED IT AS A NEW LEADING INDICATOR.

As we approach the 2 p.m., hour in which price can and will do strange and meaningless things, it's the 3C signals the last 2 hours that give us the greatest edge to forecast the next week, but I think we already have the signals in place.

On several timeframes....

 Near term for the Put Contingency plan, we have a small SPX/RUT Ratio positive, but the main trend is negative and it has shifted negative since yesterday's move higher and continues to make lower lows today.

 Longer term we have a stronger or larger VIX term structure inversion or buy signal, so far it has not been as long as the August cycle, but darn near as volatile in a shorter amount of time. If you follow all of the individual signals of the SPX/RUT ratio indicator, each one has been right on and is now calling for a move lower after calling very clearly for a move higher which we have already seen.

 Closer, intraday you can see the deterioration in to the SPY's higher intraday prices, non-confirmation which is a signal that this move won't hold, but we already expected that, which is why it was put put to use as an area to enter puts or additional inverse / short ETFs.

 The most important and highest near term probability signal is on the SPY 15 min chart with a leading negative, recently in line.

Intraday we are seeing deterioration in the 3C charts as well.

And intermediate between the two, deterioration or distribution, so I'm quite confident next week's theme is lower, thus all of my positions (Short) are in place already.

 QQQ 10 min is the most important signal for near term trade and it is negative.

Intraday it is negative as well and...

in between at the 5 min charts, negative.

 IWM 10 min negative is the most important near term signal and highest near term probabilities, this has even migrated and just about cleared on to the 15 min chart.

IWM 15 min going negative as well

Intraday it's in line, but...

inbetween at the 3 min chart there's a clear negative/distribution trend. This is the highest near term probability going in to early next week.


Finally intraday the NYSE TICK has broken down as well like many of the 3C charts, we'll see how we close as far as what Monday morning might look like, but I have no problem being nearly fully loaded for bear.


GLD Position Update

Our current GLD Put position, Trade Idea (Options) GLD PUT from 10/20 is at a decent gain for as far as it has moved...

 So far we have a 22% gain with an expiration November 22nd so still plenty of time which is by design as I would have chose a leveraged inverse ETF, but I'm just not crazy about the choices when it comes to gold.

Intraday and yesterday GLD has looked like it has been set up for a pin, I almost closed it yesterday just to free up funds for other positions , hoping to be able to get back in GLD short before it starts moving again, but decided just to let it sit where it is.

 The 3 min chart shows the negative sending GLD lower and the current in line which "looks" like op-ex pin activity although it may be any kind of consolidation.

It's the longer charts that tell me to hang in there with GLD short, no matter what I may think of gold on a longer term basis moving forward, we just aren't at that bridge yet.

 This 5 min is leading negative, but close to in line.

It's the charts like this 30 min that tell me to hold on to the short.

And GLD 60 min.

As for the longer term long, we'll take a look when price moves lower, I suspect Gold will rally longer term, again, we're just not at that trade yet.

A.M. Update

Good morning.

Right off the bat I'll ask for your understanding with my lack of enthusiasm today, not to be confused with lack of diligence, it's just these weekly option expiration Fridays are as boring as the monthly expiration, they all tend to pin right where the market closed the Thursday before, take the SPY today for example...

 On the daily SPY chart, today's open is just about at yesterday's close and typically the max-pain op-ex pin which shifts through the day as different contracts are closed out, tends to stay within a pretty narrow range until about 2-3 p.m. as most brokers have got their clients to wrap up positions before the last hour of the day and that's when the op-ex pin tends to be lifted, until then, it's typically pretty dull, pretty boring.

After that time though, the market can and will do whatever it wants, it's the 3C data the last hour or two that is some of the best data of the week, making the week ahead forecast pretty clear, although I think we already have enough data to suggest what the direction of highest probability is for next week, DOWN. Still, the 3C signals at the close tend to pick up right where they left off the following trading day, even over a 3-day weekend, but until then, it's pretty monotonous.

As for early indications and the most important charts of the week, from a 3C perspective any way...
 SPY 1 min, which is more of a steering divergence intraday, but from a trend perspective like this, is an excellent timing indication of a reversal as it puts in a divergence trend like this negative one after earlier in the week confirmation. Remember we had a long UPRO/FAS call out Oct. 14th, the day before the final low and then rally. We are not about catching falling knives, but when you follow the money flow that moves the market, you'll have early/advance notice nearly every time.

Note the last 3 days in SPY and 3C, now look at the daily chart...
Those same 3 daily candles show the same negative character.

 The 3 min trend is useful on its own or as confirmation of the migration of the 1 min divergence.

And the 5 min trend is the first timeframe where we see institutional activity on an intraday basis.


 This 15 min negative is right on the borderline of having enough gas to push higher and maybe not. As I said yesterday, any decline/pullback will have to show accumulation for a solid long trade if a base is to be formed, if there's no accumulation during the pullback, then I suspect we just saw one of the first bear market-style counter-trend rallies.

 IWM 1 min is about in line intraday, slightly positive on a 1 min chart...

Here's the 3 min trend confirming SPY very well.

And the 15 min negative divegrence which is pretty serious, if it weren't for accumulation as early as Oct 2nd, I might be looking at this in a different light, a simple next leg down and that's it.


 QQQ 1 min leading negative

QQQ 5 min leading negative

And the most important, 10 min leading negative... this is why I say we don't really need the end of day information although I'll be looking for it, we already know what the most probable direction is.