Friday, February 21, 2014

Daily Wrap

What a week and not for the reasons you might think, she the text at the bottom in red, what happened this week may have been the most significant, bearish development in the market since 2008

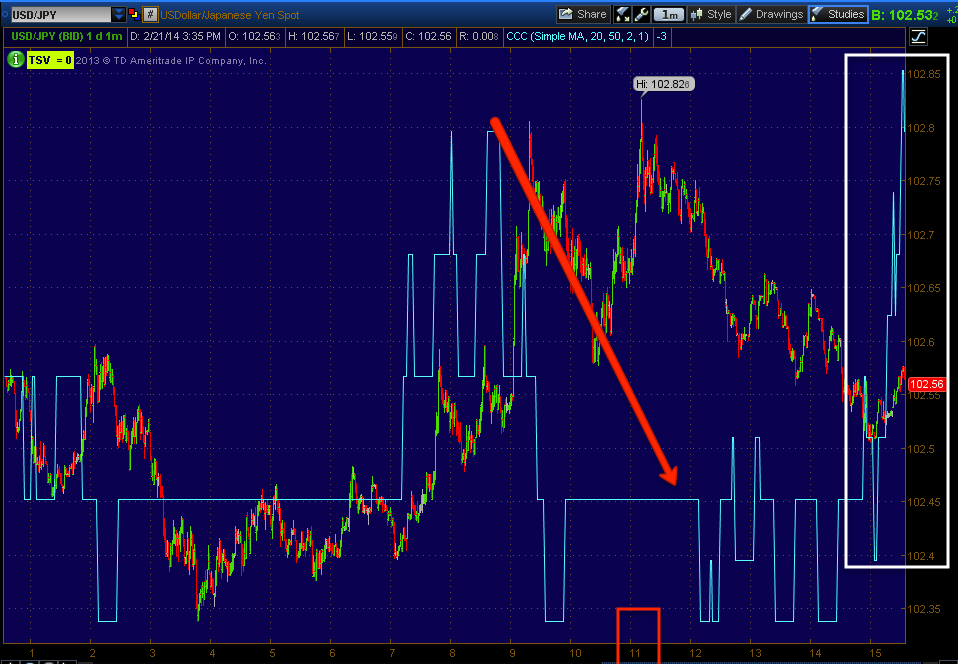
As to the late day USD/JPY/Market ramp... FAIL
 Now that we've moved to the right a little more you can see the positive 1 min intraday divergence, you can also see the move in the pair it created, an ant hill!

 This is the pair's correlation to ES intraday, not only did ES fail even before USD/JPY at the closing ramp attempt, but it sank even lower.

The 60 min chart shows the head fake move/bear trap, the short squeeze that came out of the head fake move and then at the 3 attempts in USD/JPY to go higher, you can see the last two, ES reconnected its correlation with the USD/JPY, as suspected, the only reason Es broke free of the correlation was because of the head fake/ short squeeze. There are nearly 70 ES points on the downside for ES to reconnect to the long standing correlation which fits with our next trend expectation and this wasn't created this week, this trend expectation has been with us since we identified the likely head fake move in early February.

As for the EOD ramp FAIL, look at it vs VWAP which has been very steady which is what we see when there's large scale distribution.
A nice steady VWAP and EOD, FAIL all the way down through the lower standard deviation.


As far as the possible bounce Monday, I'd have a REALLY hard time making the case based on objective data, for instance, take a look at the averages (I've included several timeframes).
 DIA 2 min, it's nearly impossible to look at this chart and expect a bounce Monday, the best I have is the AAPL chart which saw a little deterioration, but is still positive enough to launch a short move.

 DIA 5 min, so there's nothing waiting in the wings either

DIA 30 min showing the last trend failing like the other averages and Index Futures.

IWM 2 min, How could I possibly look at that and expect a bounce Monday? 

5 min, again, nothing on the relative divergence side either

And the 4 hour chart is pure bear market material.

 QQQ 1 min, not a hint of a positive divergence and these divergences usually pick up where they left off the next trading day (Monday).


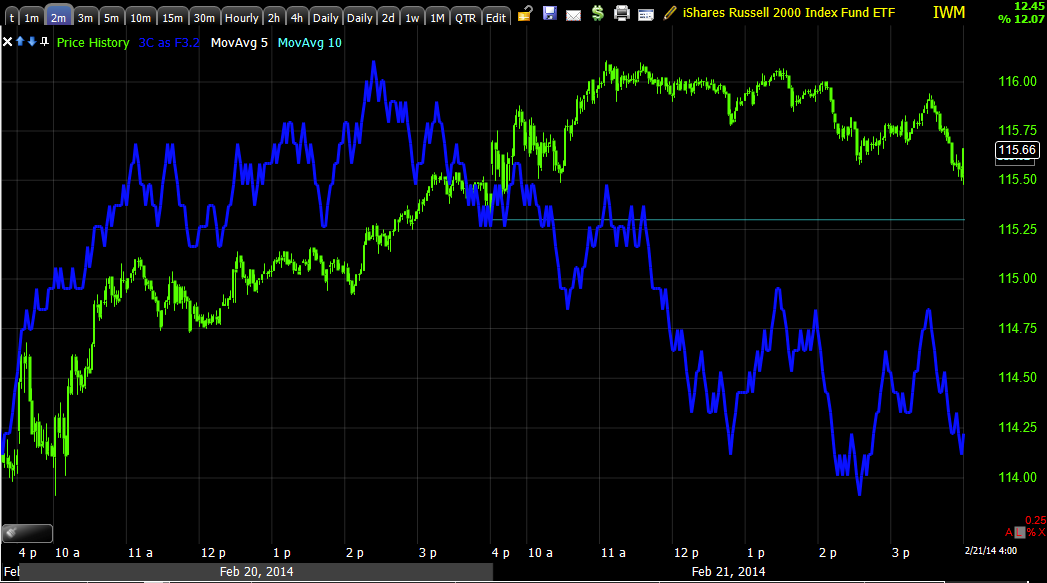
 With the 2 min hitting a new leading negative low, there's nothing there either.

The detail the 15 min chart affords us shows this move to be exactly what we called it more than a week before it started, a move to change sentiment, to get bears buying and allow smart money to sell/sell short ad there was no accumulation in the move, not even in line, just pure distribution which is what I said to expect long before the move started when I was trying to anchor expectations.

SPY 1 min is in line, but no where near a positive divergence.

The 30 min chart shows the accumulation area for the head fake move from 1/27 to 2/6, also the intensity of  distribution.
The 4 hour chart is Bear material as well, you've seen the daily charts now vs some of the worst crashes over the last century, we are much more extreme and negative now than any of those including 1929.


Earlier I told you that Index futures are no better...
 ES (SPX E-mini futures) 5 min leading negative

ES 15 min leading negative


And ES 30 min leading negative, this move for all intents and purposes did exactly what we expected it to, I just hope we have a little more time to enter some more core short positions because the next trend should take us below the SPX's 200-day moving average for starters.

As for some other indications, when Healthcare and Utilities are the best performing S&P Industry groups for 2014, you know there's been a huge flight to safety among the long only mutual funds and other firms. . We saw that this week with the VIX climbing and specifically today as if it were an emergency with VIX futures seeing huge accumulation on an already huge accumulated position, also Treasuries out performed their SPX correlation easily, in fact in a very scary way if I were long, but I'll rest well this weekend not having taken on longs and not having endorsed any that didn't have very good reason.

 TLT (20+ year Treasuries) vs SPX (green), I've inverted the SPX's price so you can see what the correlation should be and how much TLT outperformed that correlation today as there was a massive flight to safety in both VIX and TLT.

Sentiment is ready to move lower, it's not buying at this stage.

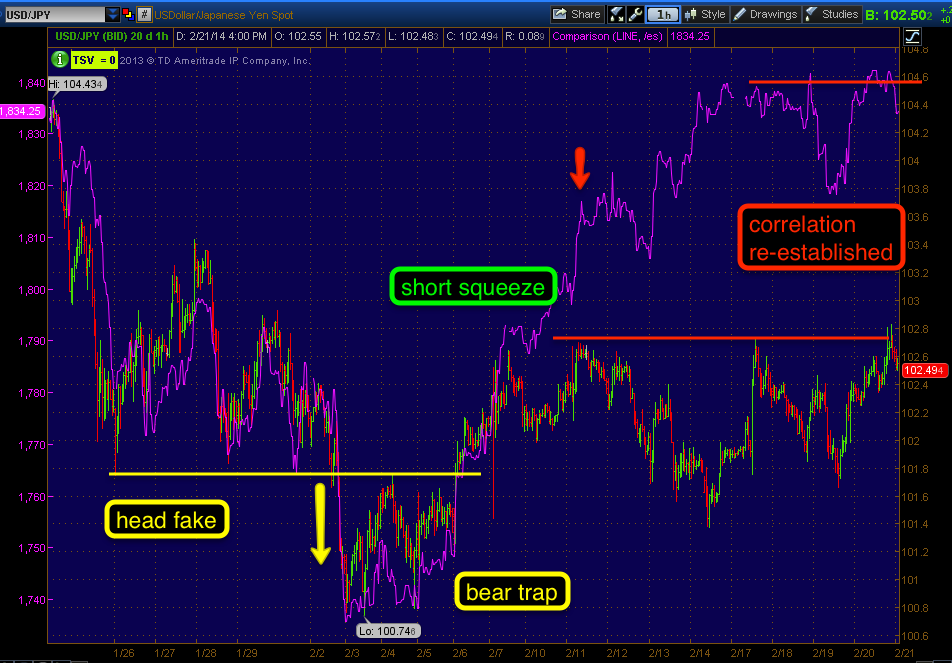
And perhaps my favorite all around Leading Indicator, Yields.


Yields called the fast collapse of prices in January, they even called the head fake "W" bottom at the lows, this current dislocation is way deeper than the last negative dislocation sending the SPX lower with a -2% and a -2.20% day, remember when the market was moving up +0.10% and everyone was so bullish and I was incredulous that anyone would even consider that a move up, I had said anything less than a half a percent isn't even worth mentioning, well here we are in the 2% moves, it won't take much for a 4 or 5% gap down to take out millions of longs and create a massive disturbance in the force filled with margin calls, talk about a snowball effect, NOW YOU KNOW WHY I'M SO DESPERATE TO GET SOME MORE CORE SHORTS IN PLACE.

Else where, the SPX , Dow-30 and Dow -20 (transports) all closed flat on the week, only the Q's and IWM were up, but I don't expect that to last, although I hope we get a little time. As mentioned, the best performing SPX groups are DEFENSIVE, dividend yielding Utilities and the one service everyone needs even in a bear market, Healthcare.

As for my custom tracking scan, Dominant Price/Volume Relationships, we had a huge one today.

The dominance looked like this for one relationship (of a possible 4), the same for all of the averages:

Dow-30 had 23 stocks in the relationship, the NASDAQ 100 had 81 stocks, the Russell 2000 had 1064 stocks and the S&P 500 had 336 stocks, a HUGELY DOMINANT THEME and it was...

Price Up/Volume Down.

Of the 4 possible combinations, not only was this Dominant in each average, but every average and it is the most BEARISH of the 4 possible relationships. Close Up/Volume Down typically is viewed as an overbought, failing trend and the next trading day almost always closes down after this relationship.

All I can say moving forward is, "I hope we have at least a day to add core shorts, PCLN and NFLX are high on my list with many others.

The release of the January F_E_D minutes was probably the most bearish thing we have seen from the F_E_D since they got involved in 2008 with extra accomodative policy, why? It's not because of the continuing QE taper which I warned a long time ago, actually the same day they announced QE 3, that they were looking for a way to start unwinding accomodative policy and normalize their balance sheet.

Remember the June QE taper Talk in which they were VERY hawkish, saying it should be wrapped up by the end of 2013 and several members wanted to start right away and then all of the sudden the F_E_D went totally silent over the issue. The reason why? It wasn't because of the loss of QE, pros knew that was coming if you listened carefully to what the F_E_D was saying, it was the interest rate hike that was initially guided as coming 6 months after QE was wrapped up. That meeting sent Bond traders in to a tizzy and they lifted the 10 year to 3%, the F_E_D was extremely alarmed and they shut up about it for the next several meeting. The other guidance was an interest rate hike would come at the 6.5% unemployment threshold, well we are at 6.6% so very close and with extended benefits a thing of the past, there are fewer and fewer people being counted as "in the labor force" which sends the unemployment rate lower even if there are more people out of work so that is a fait accompli. 

The F_E_D did not give new guidance on the unemployment threshold, they only talked about how they should consider talking about new guidance. 

HOWEVER, THE REAL BOMBSHELL WAS THE MINUTES PUTTING A RATE HIKE ON THE TABLE AS SOON AS MID-2014, THAT'S 3-4 MONTHS FROM NOW.  FROM PREVIOUS HINTS/GUIDANCE, BERNIE MADE IT SEEM LIKE RATE HIKES WERE OFF IN 2015 AND EVEN 2016 WITHOUT SAYING SO, IT'S WHAT I CALL "PLAUSIBLE DENIABILITY" AS HE NEVER REALLY SAID IT, JUST HINTED AT IT.

This was by far the most damaging fundamental event to the market over the last 5 years, nearly EVERY F_E_D rate hike has precipitated a bear market and I don't think we need any help to get to a bear market, but the F_E_D is a for profit corporation, they have done all they can to stuff banks to the gills with cash without actually bailing them out and causing a public uproar like 2008, but the F_E_D has to make money too as they have share holders and they've reached the limit of what they'll do WHICH WAS MADE CLEAR IN THE DECEMBER MINUTES IN WHICH A SURVEY HAD BEEN PASSED AROUND TO VOTING MEMBERS AND ONE OF THEIR MAIN CONCERNS WAS THE F_E_D ITSELF TAKING LOSSES, REMEMBER THEY ARE A FOR PROFIT CORPORATION NOT SO DIFFERENT THAN BANK OF AMERICA WITH EXCLUSIVE RIGHTS TO PRINT LEGAL TENDER.

This bombshell wasn't reflected in this week's trade as people expect as the media always tells you why the market did what it did, but it will be and it won't be pretty.

Have a great weekend, if I have time between moving I'll get some individual charts up.


Closing 3C charts

As was the case earlier, the SPX has the best relative 3C performance vs the Q's, Russell 2000 and DIA (which is right there with the Q's, maybe worse).

This does not mean that it's positive performance/signals. I suppose it could be enough to get a small move like the one I talked about in the last post and with AAPL with its positive divegrence...
I'd think that it wouldn't make an upside move against the broader market, I'd expect some cooperation from the averages or at least a neutral market.

The USD/JPY's intraday positive is still in place so maybe something happens before futures close out, this is not the kind of divergence that will carry over to the next day or the weekend.

I'd almost say if it weren't for AAPL, I'd wouldn't be talking about a very short move up at all.

With things the way they are and I'll show you, my best guess (as I do every Friday) would be a piercing of resistance for the SPX followed by a failure, I want to say all in the same day, but whenever I say that I always am reminded of the lesson of market extremity, "Whatever you think is reasonable for time or target, multiply it by 3".

WHEN I SAID,

 "I hope the market can hold in the area or move up a little on Monday, there are a number of core short positions or option trades I want to enter immediately, PCLN and NFLX are among them"

I DIDN'T SAY THIS FOR THEATRICAL EFFECT OR ANY OTHER REASON THAN A TRUE WISH, I THINK ONCE I POST THE CHARTS I HAVE SEEN THAT LED ME TO THIS (EVEN THOUGH WE EXPECTED THIS SINCE BEFORE THE MOVE STARTED, JANUARY 31ST I BELIEVE IS WHEN THE ENTIRE SCENARIO WAS THROWN OUT THERE, OF WHICH ALL OF IT HAS COME TRUE THUS FAR), YOU TOO WILL UNDERSTAND WHY I FEEL THIS WAY AND WHY I FEEL AN URGENCY TO GET THESE POSITIONS NAILED DOWN.


End of Day Market Update

I just looked at Leading Indicators and my gut feel is that we do get a ramp in to the close or are set for an early Monday ramp, however, it looks like a fluff move, more so than even a head fake. Sentiment indicators are negative like the trend from 2/6 to present is not only in the reversal process, but at the cliff, however a very short term move in 1 of the sentiment indicators since 1 p.m. today toward the positive hints at that upside move that was all part of yesterday's "Scenario" post. The larger view of both is that they are leading the market to the downside.

VXX (Short term VIX futures) have had very strong outperformance today, we already know this is a larger position, I suspect that there will be no rotation out of protection and in to risk because it looks like the move would be so short they wouldn't be able to replace the assets rotated out in time.

TLT or the Flight to Safety trade (20+ year Treasuries) is MASSIVELY outperforming it's market correlation, apparently there's a lot more bid for safety than you can see without putting it up vs its correlation. 

Yields which are on of my favorite leading indicators are in line intraday, but from the 2/6 to present move in the market, they are SEVERELY dislocated and leading the market to the downside, much, much larger than the fall on 1/23 to 2/3 that created so much bearishness among the retail crowd. I'll show you after the close.

INDEX FUTURES ARE NEGATIVE FROM 5 MIN TO 60 MIN WITH HUGE DIVERGENCES BETWEEN 5 AND 30 MIN.

All I can say is I hope the market can hold in the area or move up a little on Monday, there are a number of core short positions or option trades I want to enter immediately, PCLN and NFLX are among them

USD/JPY Update

To me this looks like a closing ramp job is coming up, look at the carry pair.

USD/JPY intraday , we have a beautiful negative divegrence in to the late morning highs sending the pair lower, but look to the far right , there's a very fast building and large positive divegrence leading exceptionally well.

This is not a strong divergence in that it's very small (time / duration), but it's very strong in that it looks like a bunch of intraday flow was thrown at it very quickly, the only reason I see to do that is to cause the market an End of Day Ramp.

Again, the ramp doesn't have much gas in the tank, the divergence would need duration, but it should have volatility/ intensity.

Remember that when it materializes.

AAPL Follow Up

If you like the idea of the short term AAPL trade (I think it needs leverage, call options), I think I wouldn't wait any longer to enter it, it's giving great short term signals, almost enough to make me consider it.

Trade Idea: GLD Short / DZZ Long

I'm going to open a half size trading position in DZZ long, this is a 2x short Gold ETF. I see so many great looking GLD (short ) charts as well as GDX, I think it's at least worth an exploratory position.

If I see more evidence or see an opportunity to add to DZZ at a better price with more chart confirmation, I'll bring it up to a full size TRADING POSITION.

Update

The USD/JPY should be giving the market some support right about now as it has moved up 21 pips in just the last minute.

As far as how that plays, what that means, put it this way, I was just looking at FAZ (3x short Financials), it has awesome looking charts, or horrible looking Financials (XLF-Financials long). I do have a position there, but was considering an add to.


I think the only reason I don't (I probably would at least open a partial position if I didn't have any exposure) IS THE SPX SITTING SO CLOSE TO MAJOR RESISTANCE.

THIS IS NOT ABOUT PROBABILITIES, IT'S ABOUT TIMING AND TIMING ONLY.

I'm going to check some FX and LI charts to see if there's a timing edge on any of these or if the "Scenario " post from yesterday morning is still a possibility.

GLD / GDX / DUST Quick Update

I've been looking for GLD to make a move higher since I first considered it as a short Wednesday, it did so yesterday and today, but I'm not sold on short term charts yet.

GDX (Gold Miners) however look very different. There has been a decent correlation between miners and gold, however as you know the 180 degree about face in the gold/SPX correlation from inverse to 1.0 took hold very quickly, although we saw early signs and had suspicions and stopped trading GLD short term after a number of very successful short term option trades.

I'm still on the fence with GLD's signals, the fact that is has good correlation with miners (GDX) tempts me to look at opening a GLD short, but I don't like doing anything with out a clear and undeniable reason and I don't have that yet in the 1-5 min GLD charts, although the intraday gold futures are negative.

GDX is a different story, it has good signals (short) and as you might recall, I closed a core long in a 3x leveraged long miners ETF (NUGT) and replaced it with a 3x short miners ETF, DUST. I like DUST a LOT here, but I don't think it is a core position, I think it's a trading position, it just happened to be that the NUGT position was in the core tracking portfolio.

I do like DUST long here (3x short gold miners), as far as GLD, I suspect it will come down, but I need objective and overwhelming evidence, I did get the upside move I wanted as of Wednesday now I just want to see objective 3C charts, otherwise I'm fine missing the trade, there's another bus, they run 24 hours.

Quick Update

The more negative price action, especially in the Q's and R2K is being confirmed by worsening intraday and longer negative divergences. You saw the averages earlier and all looked bad (the SPY looked the best of all, but still not good). The Q's looked particularly bad and they are showing it, IWM looks every bit as bad as the Q's did earlier.


BIDU Core Position (Short) Update

On Feb 14th I presented BIDU as a new or add to short position, I've had ti for a while and in the green as a core short, but needed to fill out the position. On the 14th I said I'd like BIDU as an entry > $170, but in the larger scheme of things, it wasn't crucial, it's just a better entry with less risk.

BIDU made that move and is at $173, I still like BIDU a lot as a longer term core position, usually that means (when we are not in a trending market, but a choppy one or transitional one) that I want to give the initial position a wider stop as volatility and choppiness that are just hallmarks of transition could take out a tight stop with no good reason other than the stop was too tight.

As I said, I do like BIDU short here, either as a partial position, a new position or an add to, depending on your situation.

Nearly every chart since they were posted on the 14th has seen further deterioration.

The entry right now is VERY similar to our 2012 BIDU short that eventually gave up about 45% in gains with no leverage. The only difference between the two entries now and then is the scale, but as I often remind, "The Market is Fractal".

Take a look for yourself...
 Entry now has a bullish ascending triangle which technical traders will see and look for a breakout to buy, even though it's a bit too large to be a true consolidation pattern, their buying is what allows smart money to sell in to demand/higher prices, this is exactly what we did last time at the head fake move, that has already failed as you can see rather than make the next leg higher as TA traders would expect.

The bounce since has been market correlated, I don't think it is on any BIDU strength itself, like I said, 2/3rds of the market will follow the broad averages.

 This is the last big core short position we had in BIDU, a large sym. Triangle that is taken as bullish as a continuation consolidation pattern (continuing the preceding trend which was up). At "A" this is the increased positive Rate of Change in price that "looks" bullish, but is more often than not a red flag warning the asset is about to top, these are the changes in character you have to look for and often they are opposite of what they appear to be. At "B" is the sym. (bullish) triangle which was also too big to be a real consolidation triangle and more often they function as tops or bottoms depending on the preceding trend.

"C" is the breakout head fake move that retail chased and we shorted, this gave us the best entry with very little risk, BIDU ended up losing -45+% without any kind of leverage, it was a core/trend short.

 More recently, note the "Igloo w/ Chimney" to the far left. As I often point out, bottom / upside reversals are often much tighter than the larger umbrella top reversals, but they are almost always proportional (meaning the size of the base is proportional to the size of the following trend which is proportional to the top reversal process).

At 1, 2 and 3 we have a bearish daily Shooting Star candlestick which is a reversal (downside) signal, a bearish, "Hanging Man" following the Shooting Star and today a nearly perfect Doji Star (bearish loss of momentum and indecision which opens the asset to a reversal).

The only thing that's missing is a head fake move on the reversal process, the "Chimney".

 60 min chart showing most of the cycle from Stage 1 Accumulation/Base to stage 2 Mark-Up or upside trend to Stage 3 /Distribution/Top, the last and final stage in a stock's cycle is Stage 4, decline.

Note 3C's divegrence in the flat toppy area.

The 30 min chart shows the exact same, again, note the 3C divergence at the flat toppy area.

Intraday 1 min BIDU is seeing some trouble.

2 min as well

3 min

And 5 min is making a new leading low.

I'd like to see these a little more defined, but the larger/longer term charts show VERY strong bearish probabilities and I'd feel a little naked if I didn't have at least some BIDU exposure at this point in the market.

Trade Idea: Reiterating MCP Long

As you know MCP is one of the few assets I like as a long term long position, I don't mean as a trade, but as a primary bull market for the specific asset.

There are some short term signals that have been a bit ugly, but they have been contained to intraday charts and it seems they have done nothing more than consolidate MCP over the last several days.

The longer term or stronger charts that show heavier flows of funds, are showing large accumulation making its way back in to MCP which is one of the few stocks that can trade opposite the market as most stocks (at least 2/3rds) will follow the market directionally.

Here are a few charts to give you an idea of what I'm talking about...

 MCP 10 min suddenly leading positive in the range

MCP 15 min positive in the same range

You know I like it long term such as this 2 hour chart showing where GS came out with a rating update that knocked MCP down, I suspect GS has been one of the major buyers since it was knocked to the lower end of it's long term base/range.

And the 4 hour chart.

As far as a stop, since this is a core position I'd have a wider stop, but if you keep you losses small you can make multiple entry attempts if need be. This is the difference between pro and amateur traders, amateurs make one attempt, get stopped out and forget about the stock, pros will make several attempts until they get the position they want, the only secret is in keeping the losses small and I provide this stop with that in mind, not as a core position stop.

I'll let you know if I add to an already pretty full position, it would only depend on 1-3 min intraday charts.

Quick Update

As was laid out yesterday morning at 10:30 about the SPX possibly making a run above the clear resistance zone right in the area (I'd do it), and as I said in a recent post it's like "Free Change on the ground", there may be some signs of that. First of all the Op-Ex Max Pain pin is usually removed around 2 p.m. as most contracts are wrapped up by then.

Secondly, on an intraday basis I see some rotation out of treasuries, TLT to be exact, this is on an intraday scale, but for HFT's and fast traders, that rotation may be in to SPY for such a move, as long as they have the speed to get in and out.

I can't be sure about this, it was what I thought to be a probable scenario yesterday morning and seeing rotation out of a safe haven asset (but in small quantity) like TLT, means it's likely going to a risk asset like SPY since it's so close to buy limits.

It's something to keep in mind, especially if you are interested in a trade like AAPL long, this would likely be the best timing/entry on a trade like AAPL long if you were inclined to take the trade.

More as it develops.

VXX / UVXY Update - Protection is being Bid

The VIX futures just saw a big boost in accumulation, protection is being bid, this is apparent in the Short term VIX futures as well. Remember that VIX trades opposite of the market, a positive VIX divergence is a market negative signal.

 The real VIX futures just came alive with accumulation and a bid for protection, someone is getting jumpy.

To show you the scale of this accumulation, look at the leading positive divegrence to the right, this is a 15 min chart!

 VXX 1 min intraday is seeing the same thing, but the difference is, the pros knew the market rally was going to be distributed in to, they would rotate some of their assets out of protection and in to risk for such a move, but ultimately they know the probabilities as well and the asset reallocation would only be on a smaller trading scale, the major accumulation of VIX futures would be in place as it takes them some time to build a position that large, as we go you'll see that they only reallocated a small portion from safety to risk for the rally, they understand what's at stake.

THIS IS THE SAME REASON I LEAVE the UVXY long trading position open. The VXX February calls will expire worthless, the UVXY long position is not that far off and should be fine.

I may consider adDing a new call position with an April expiration, but I prefer to have an equity long trading position so if I do add to anything I'll let you know, AS YOU KNOW I DON'T LIKE TO CHASE.


 2 MIN VXX ...whenever there''s a yellow trendline I'm usually trying to point out a head fake move just before a trend reversal. There was VERY little distribution at yesterday's reversal and as you can see the divergence is now leading positive

 On a 3 min chart there's no distribution at the reversal which means it was very small, again we have a clear positive today.

The 5 min trend is in line at yesterday's highs, no distribution on this chart meaning it was VERY small and a positive divegrence building quickly today, this is part of a much larger positive as you'll see.

 On a 10 min chart from left to right, the distribution at the top is where the head fake move in the market averages was or the bear trap, smart money was well aware of this as we were more than a week in advance and rotated some money out of safety and in to risk, however the leading positive as the market ran higher (VXX lower) shows that they only rotated a little and did it at the very highs of VXX or very lows of the market, it looks like not only did they keep a large portion of the poposition intact, but added to it on price weakness.

The same 10 min chart on an intraday basis again confirms no strong distribution yesterday so whatever move "may" come in the SPX, they aren't worried about it or they would have rotated out of protection in size, the divergence only reaches a 2 min intraday chart which is very small.

The 10 min positive today alone is quite large.

Here's the 15 min chart, it shows in line on the move up in VIX and down in the market until the head fake market lows / VXX highs, even there the divergence at the top is not very large, the leading positive shows an increased ROC for 3C on the upside in to lower prices (the same concept as shorting in to higher prices if you know the probabilities), for a 15 min chart, this is an exceptionally large positive divegrence.

The market run which was one of the strongest we've seen in years did not have this much accumulation, that should tell you something.

If I can add to VXX or UVXY long, I want to do it in to intraday price weakness, otherwise I already have a position so I don't need to make sacrifices for the position, if it comes to me, I'll likely try to add what I can to UVXXY / VXX long for a TRADE, but a substantial trade.


Market Update

The USD/JPY is getting pretty negative intraday, but beyond intraday I'm going to try to show you where we are in terms of a few timeframes/trends and overall in relation to the strong upside move that was born of the head fake/bear trap , "From failed moves come strong reversals".

 USD/JPY 1 min intraday going leading negative to the right

SPY 1 min intraday, mostly in line

SPY 5 min intraday, has been in line since yesterday so seeing this go negative on an intraday basis is a good signal for timing.

30 min which is the trend that ran up just the last several weeks, you can see how close we are to resistance and this is what I was talking about yesterday in my "Scenario" post, it's so close and so easy to hit orders and make some extra money before you turn the market, it's like free change on the ground and I think that's a good analogy because it's not going to make them a lot, but it would be like change on the ground, but free.

The overall trend has deteriorated exceptionally bad considering I thought this chart might be able to hold up with a downside reversal all the way to SPX 200 day m.a. This is kind of what I was talking about with not taking a long in AAPL, these are the strongest probabilities, even though we can have short term moves above resistance, this is where the probabilities are and I don't want to bet against those without an amazing reason as we are at a trend pivot which is obvious just by the increased volatility, you don't even need the 3C chart to see that.


QQQ has not been acting well, this is the 1 min intraday, my theme was "Sell in to price strength", what I try to do is follow in the footsteps of those who move the market, it seems to be more than apparent that this is exactly what they are doing. A short here is in line with the highest probabilities and it's in line with the highest short term probabilities for the Q's

 The 3 min chart is leading negative ever since the divergence on the 18th, the green arrow just shows 3C moving in line, not positive, but this in line is within a leading negative divegrence so it's not a strong signal by any means.

 And the larger trend from distribution that turned in to a range that was the start of accumulation for the move up at the start of February, the head fake move that set the bear trap and short squeeze and the price move. This is the same chart I thought might hold together positive even with a move down to SPX's 200-day, it has fallen apart much faster than I anticipated, which changes the outlook for what happens at the 200-day, we'll see as we start moving that way, but I DOUBT WE ARE IN THE AREA AGAIN AND THIS IS WHY I HAVE BEEN LOOKING AT AND ENTERING SOME CORE SHORT POSITIONS.

IWM 2 MIN INTRADAY had enough accumulation from yesterday to create this move, but as you can see it too is failing like the Q's.

The 3 min chart shows migration meaning the failing divergence or negative is growing in strength since yesterday's expectations from the a.m. post.

And again the highest probabilities and the reason I want to enter core shorts in this area, note the leading negative from the far left start of the arrow and where price was to the far right current position of 3C/arrow and where price is, that's a lot of overall distribution which is exactly what we thought this upside run would be used for and this is documented as our view BEFORE anyone had a hint the market would move higher, everyone was still bearish. You see the range area where accumulation for the head fake started, the head fake/bear trap and distribution in to the run.

Again, this is about aligning expectations and trades with timeframes and probabilities.