Tuesday, December 10, 2013

Daily Wrap

It's really almost incredible how 2-days back to back can have such different character, yesterday was really defined by the market's weakness in not being able to stand on its own two feet without help of levers such as the SPY arbitrage, today there was no SPY arbitrage, the fact HYG is under continued distribution probably doesn't help...

HYG distribution 15 min.

The SPX and Dow both have reversal candlestick patterns in place while the R2K is pretty severely dislocated from the pack as dispersion noticed weeks ago continues to grow.

Although there were a lot of undertones and moving very fast, almost like panic, I get the feeling the market could fiddle around in this area for a brief time, maybe let the R2K work off it's relative oversold condition and the candlestick reversals in place are not that convincing, but even so we still saw late day distribution in the Q's as you already saw, the SPY and the DIA, only the IWM stood out as being totally different.

The key at this point and has been for some time is understanding where the probabilities are. For instance, the spot VIX Bollinger Band squeeze is not forgotten, it's not done, it has just got started.
 All of you know (except a couple of new members) that we called this as a highly directional upside breakout that would breakout, then hang around the area with a pullback to the 20 bar average/day and today we have a more bullish hammer-like Doji reversal candle.

We called everything that would happen here before it happened and its right on track, but we also had insight as to the probabilities as VIX futures posted and continue to post the largest leading positive divegrence I've ever seen.

4 hour VIX futures chart...
And the recent stalling of the VIX to activate the SPY arbitrage seems to be ending as you saw with HYG, but also this 15 min chart of the VIX futures also leading positive as it starts back up again.

I didn't call a long in the VXX today, maybe tomorrow, it depends on whether the market or parts of it fiddle around in the area, but above is one of the looks at probabilities. We've seen the overwhelming breadth and 3C as well a leading indicator probabilities as well.

In Index futures...
 30 min Es (SPX futures) shows the last time in this area we didn't see this kind of distribution, this makes me wonder if the R2K may bounce and the other averages will go their own way.

It's for this reason I'm more interested in looking at trades, I think directionality of the market and probabilities is locked up now.

If the R2K can bounce, this 60 min chart of its futures has been right on and it's in worse shape now than ever, that just makes an IWM bounce a gift to short in to price strength.

I think the IWM probably will bounce, although it may not even last the day, as I mentioned, it may be a day trade, but I noticed my custom TICK indicator went from negative to neutral at the close.

Today we posted the second Hindenburg Omen for those who follow it, Friday was the first.

Treasuries and Gold use to act QE sensitive and even recent QE on/off events have seen that relationship maintained even though they are 180 degree opposite in their correlation now, however I think that is changing too as it seems there's a strong move toward the safety of bonds and a move toward gold on inflation expectations.

 This is the 30 min 30 year Treasury futures, you know I've long been interested, but have backed off to see what happens, it may be time to pay closer attention.

And you know I love gold even though I think a pullback in to the gap is high probability, but at the end of the day today I noticed 3C improve intraday so maybe a gap higher before the pullback? Either way, long term I love it and it's not because of QE as that correlation was put to bed in 2011.

USO/Crude I still love for a move higher even though I suspect a pullback, I will add a position in oil to the trading tracking portfolio on any pullback, I've been waiting for this one for a long time.

This 4 hour chart of Brent futures looks exactly like the 60 min USO, that's a strong positive and I think we get a strong upside move that has already started.

Another of the typical levers failed today, the EUR/JPY, in fact it led Index futures lower in to the a.m. after they had been up overnight.
ES is purple and EUR/JPY in candlesticks, ES just couldn't tag the carry pair. I don't have evidence for this, but I'd say watch the pair carefully for a downturn, I suspect carry traders are going to be wrapping the carry pairs up.

I'm looking for some near term $USD strength so that may be what pulls USO back, but this is short term.

XLK/Tech tried to put in an intraday positive today, but it didn't get too far and the probabilities are firmly against it.
 XLK 10 min distribution.

This is what I mean though about the separation of the market which was unheard of 6 months ago. While Tech "tried", XLF/Financials just kept deteriorating.
XLF 30 min, Financials are smokes, also note that October cycle breakout/distribution here as well.

The market is acting like a healthy bull market rotationally, but it's the furthest thing from that, this is one of the most significant changes in character as almost everything use to move together, you were either long or short, it didn't matter what and now it's all broken up with averages like the Russell 2000 smoked today while the Q's were almost flat.

Why is this important? CHANGES IN CHARACTER PRECEDE CHANGES IN TRENDS.

UNG had a nice breakout as we recently saw (another long term long favorite)...
I'm guessing the typical pullback to the yellow 10-day is going to coincide with a pullback somewhere around current / new support, we'll take a closer look at UNG then, but I suspect it will be a buyable pullback.

On the short end of the stick there are quite a few we've been paying attention to that deserve more attention, you saw BIDU today, but others include :AMZN, GS, GOOG, and of course, PCLN.

I'll be concentrating a lot more on individual trades as the market gets out of whack with this dispersion.

As far as breadth indicators, EVERYTHING went further downhill today. The NYSE A/D line looks worse and still hasn't broken above October's high, the NDX's A/D line as well as the Composite's have deteriorated recently or even more. The ABI is now heading back down toward the recent multi-year lows which is indicative of a market top, All of the % of NYSE stocks above or below their moving averages have deteriorated even more today, you may recall last night's daily wrap and the charts I posted, well they're worse.

The McCleellan Summation Index is majorly divergent and at -500 and headed down, next breadth post I'll get this up because it's screaming "Red Flag".

Also for the first time, the Russell 1k, 2k and 3k's A/D lines have all deteriorated.

Context is flat tonight so we could fool around in the area, VXX is not ready for a long so as long as it's not, there's a chance for some wobbling, I of course suspect the IWM, but whether it's intraday or not, we'll have to see what the signals say tomorrow, that's another thing, THEY ARE MOVING FASTER THAN EVER, THERE'S A LOT OF ACTIVITY IN UNDERLYING TRADE.

As of now, not much too exciting in futures, if anything changes I'll let you know.

I noticed earlier today ZH mentioned SBUX's really tight range of about a cent or so, I should have bought calls right then as I knew what it was and so do you if you remember the flat ranges and how 3C behaves (think VWAP)...
 Here's the 60 minutes of ultra-tight ranging in SBUX today, I should have played a day trade with a call right then and there...

Look at the intraday leading 3C divegrence right in the same area and then... pop.

Have a great night, I'll check in if anything pops up.

Breadth by Bank of America

Bank of America's latest analysis warns of the market's poor breadth, specifically the Percentage of NYSE stocks below their 200 day moving average. They are just catching on now? I have been featuring breadth posts the entire year at a clip of about 2 a week, recently much more, even in last night's Daily Wrap and not just 1 metric, but this article shows BOFA has caught on to something that has been structurally breaking down for the entirety of 2013.

I don't know why it makes me so angry, perhaps because the dimwit who finally figured this out is likely making six figures a year more than I am and the person didn't even do a decent job in covering the totality of market breadth. Maybe it's because this person says that at 69% of NYSE stocks above their 200-day moving average, this has historically correlated with pullbacks of 15-20% over the last several years and it would take a reading below 60% to signal something more dire.

Maybe get your information correct?

In green, Percentage of NYSE stocks trading above their 200-day moving average, currently at 50.86% (SPX in red)

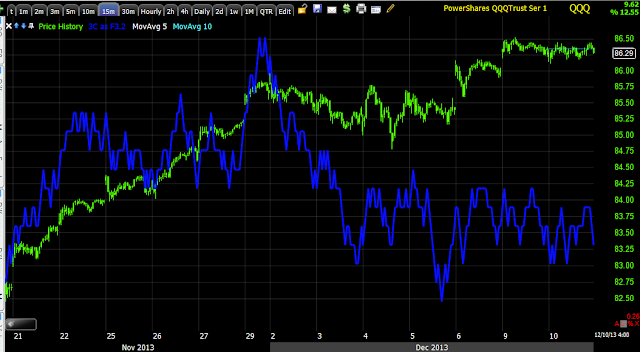
Initial Impressions: QQQ

"Chaos" 

I've been showing you the changes in character not only this year, the last several months, the last few weeks, but very recently. Last night I ended the Daily Wrap by saying I think we are going to see some "Unusual and unexpected" developments.

If I had to look at the market this morning and give an opinion, it would probably be somewhere along the lines of an intraday bounce, later in the day after looking at some leading indicators, it would probably have been along the lines of maybe even a tradable bounce, but only in certain areas as dispersion is becoming almost untraceable whereas the market use to move all together, all the same direction, all about the same size moves; I even said back then, buy/short the SPY, the Q's the IWM, it doesn't matter, they all move together.

THOSE DAYS ARE GONE and are rapidly being replaced by something much more chaotic.

Now I look at the averages about every 30 minutes at a maximum timespan and often much more often, earlier today I saw dispersion in the Q's compared to the IWM especially, but I wasn't excited about a trade there. Within an hour or so, things changed and I don't mean in the Q's alone, I mean EVERYWHERE, it is truly chaotic.

As far as the Q's and why I'd consider a SQQQ long (3x leveraged QQQ short) or maybe even a QQQ put if I can buy the put in to QQQ upside momentum and 3C negative divergences.

Here are the Q's (I'd love to see the breadth within the NDX-100, maybe I'll check that out)
QQQ 60 min. Entire October 9th low Cycle, what I've been trying to point out is the Oct Cycle that moved in to stage 3 around late October-mid-November and the break above that range which is a common theme in the average, industry groups and stocks, the distribution of that breakout makes the entire area look like 1- large head fake, what's important to remember is that the moves are proportional most of the time so the head fake wouldn't just be for the October cycle, it would be for a much larger trend reversal. This distribution of this area is such a common event that I've spent a lot of time trying to highlight it.

 The 15 min chart confirms distribution at what would be stage 3 of the October cycle and then additional distribution on the move above it.

 This 10 min chart also confirms the same, as we look at faster charts we get more detail, so the distribution can be seen at the very first break above the trendline that dropped back below and leading negative at the subsequent break over the trend line.

 You know how I always warn about these really tight, flat ranges that seem to be "boring areas" and I often compare them to "The kids in the room next door being a little too quiet, you know they're up to no good", well this is also where we almost always see distribution (in this price/trend configuration) and accumulation , the 1 min 3C chart makes it very clear what's happening here.

This is an intraday view of the 1 min chart, earlier it wasn't very exciting as it was in line, then this afternoon it leads negative to a new low on the chart, a pretty fast change from "uneventful" to "interesting".

The 2 min chart confirms and shows the divergence migration to a longer timeframe, also look how much damage was done today alone, of course in that flat range (think filling at VWAP).


The migration continues through the 3 min chart, note how much stronger the leading divegrence is at the flat range.

If the Q's were to gap above the range or move above the range, I'd be interested in a put option, otherwise I'd be more interested in an equity short, or 3x leveraged ETF like SQQQ.

There was a lot of this changing today across all different assets and very fast.

Trade Idea

If I had time I'd open a QQQ short, with some room on the stop, but use a 3x leveraged ETF like SQQQ, there are quite a few charts there that turned ugly quick.

I can withstand 3x lev. drawdown if I have to wait a bit, you may feel different.

I'll be looking in to this tomorrow, possibly a put position.

IWM Trade EXAMPLE

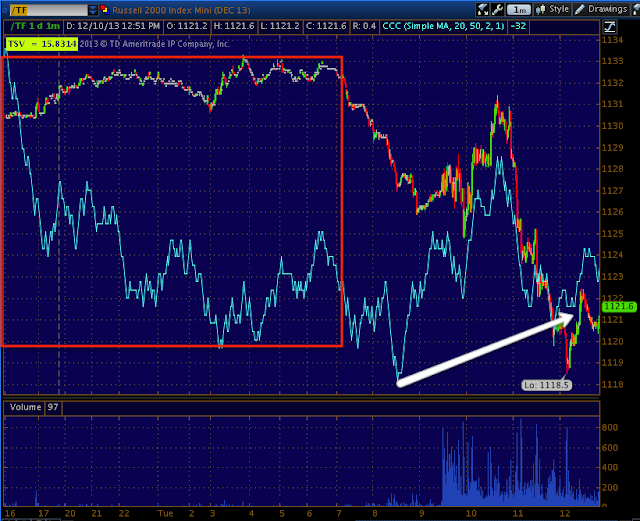
After looking at the TF 1 min futures (the 5 min are in line and nothing special), I considered an IWM call as a short term trade, maybe even day trade, then I looked at the IWM and saw the probabilities even for a short term trade aren't looking good, "IF" the IWM looks like this in the morning (the same set up), I'd enter a options position (call/long) or maybe URTY, but I'd fully expect and be prepared for that to be a day trade.


Here's what I mean about the probabilities just not being there and this looking more corrective (the fact it's the IWM, hit hardest tends to confirm). First the 5 min chart which is what I really pay attention to with Futures isn't anything other than in line and that's moving down, so no probabilities for anything other than overnight or soon (in to the close?)

As for the IWM where action will pick up tomorrow were it left off today...

Since there's so much dispersion between the averages and Industry groups, it's hard to view this as even a mini cycle.
 Since the bulk of what I have for probabilities is on a 1 min chart, I need to look at the IWM's 1 min chart trend which isn't good, negative divergence after negative have taken it lower.

Intraday here's the 1 min positive, but this is about the best I have, like I said, if this set up where there tomorrow morning, I'd take oit for a day trade or whatever it gives, but not overnight.

 The 2 min chart is barely seeing any migration of the divergence and this is just a 2 min chart, not even a 5 min

5 min is in line as you see, I rarely would take even a quick trade without at least the 5 min being divergent.

Then there's the bigger picture on the 15 min of the Channel Buster and a leading negative divegrence at the Channel Buster.

I can't take this position, probabilities are one thing and my guess is the probabilities are the IWM moves higher from here, but "High probabilities/low risk trades" are another thing, it's not here.

Market Update

There are a lot of different things going on in a lot of different places, very short term it looks like corrective action, that's why the R2K which is down -.73 and IWM -.84% look the best in underlying trade, they have the most to correct, market's do not move straight up or down and many of us have forgotten that as the F_E_D has created an artificial Bernanke Put, but markets are starting to trade more like they normally or use to so it's going tp be an adjustment.

The level of dispersion between assets is stunning.

I'm not impressed with much short term in the Index futures, the long term probabilities or the strongest probabilities because there's nothing long term (as in far off) about this, look like this all over.
 The 60 min Russell 2000 futures went negative, the R2K turned down and is the worst performer on the day, but just looking at price I can tell it wants to correct in a more normal market atmosphere, that won't change the very negative probabilities of this chart and the asset.

Short term the futures aren't exciting, but look at the 1 min R2K futures...
Look at that divergence, I'm guessing it holds through tomorrow, not just overnight.

There is so much dispersion, there's no way I could even give you a feel in an hour of writing it all down.

I'm going to instead look for TRADING opportunities and some CORE longer term opportunities like BIDU instead for the last 30 mins. and then I'll try to put this together tonight, but there's a lot of bad news charts for the bulls, but as I said (I think this morning or last night), "VOLATILITY AHEAD".

We may very well just see an out of nowhere crack, that 60 min chart is the warning it could happen any time.


BIDU Follow Up (SHORT)

In the initial post last Friday bringing BIDU back up as an add to, to the initial phased in core short position, I not only said we wanted the trade to come to us, that the "Ascending Triangle" (bullish) wasn't there by accident, but most importantly  I showed this chart with what we at that point, the two potential trade set ups, the preferred Option "A" and the second best, Option "B". I also include the commentary following that chart.


"My first choice entry is "A", a breakout to the upside above the $170.78 level, the breakout would usually be quite strong, it has to attract the attention of bulls and convince them that this is a strong move, they are selling a lie, so they must really make traders believe so don't just expect a move to $170.85."

" The chances of a head fake move are very high and that's also where out HIGHEST PROBABILITY TRADE IS."

Today's move of nearly + 5% QUALIFIES, this is exactly what I was talking about on Friday, the move HAS to be strong, otherwise who's going to chase it?

Who's going to question this move coming out of a bullish Ascending Triangle?
 This is the kind of move I was talking about on Friday.

It got the job done as well, these aren't just price patterns to be memorized, it's psychology and tactics that have a very specific purpose (actually quite a few), again if you haven't already, I urge you to read the two articles I wrote and posted on the members' site, Understanding the Head Fake Move" parts 1 and 2; when I put up part 3 it will be examples of different kinds and how they end up.

The purpose here was to bring in buyers or more accurately, to create demand at a higher price. 

What can you do with demand at higher prices when you have positions so large it can take months to unwind them or start new positions such as shorts that are so large, it can take weeks or longer to fill them without giving your position away to other firms or the much dreaded predatory (Ice-berg Pinning) HFTs?

The only reason I didn't fill the entire position is because today's move is very parabolic, parabolic moves tend to end (in this case) badly with an almost equally vertical drop, however, if that doesn't happen then there will need to be a reversal process, the only way BIDU will have a reversal event is a parabolic failure, other than that, probabilities are astoundingly high that a reversal process like the one I drew in will take place as "V" shape reversals are VERY rare.

 So far so good on the 3C signals in to the moves, both the initial breakout Monday and today's move.


I don't want to re-post all the BIDU charts that were just posted days agao, but my point here is most technical traders believe that a move like today IS SMART MONEY BUYING BIDU, BUT WE HAVE SEEN OVER AND OVER AGAIN, BY THE TIME THERE'S A MOVE LIKE TODAY'S SMART MONEY WAS IN THE POSITION LONG AGO.

Above we see where the initial accumulation for this leg was set up, selling in to higher prices in smaller blocks keeps their average price very high without alerting predatory HFTs that ill make them pay for showing their cards.

I'll let you know as always if any further moves are made in BIDU, but this is exactly what we were looking for Friday in "LETTING THE TRADE COME TO US".

Trade IDea: BIDU

Now that's what I was talking about. Adding 1/3rd to bring BIDU short equity to 2/3rd full position

GDX / NUGT / DUST

The NUGT/ DUST switch-off in the Trading Portfolio (that I'm trying to maintain as an experiment to see if I'll have the time I need to start trading again without compromising any of my work here and without putting my hard earned money in danger because I don't have the time to properly risk manage and otherwise manage positions. I think a real, live portfolio (smaller in nature because they are the most challenging to manage) will be beneficial as an example portfolio, but it isn't meant as a "Follow my positions" portfolio because the positions entered are a function of what exposure I have, what looks good at the time, etc, it's not the best of the best, it's just the best for what's available and my time at the time, this is one of the things I fear most, that such a portfolio (which would be easy to display) would become a "follow me" portfolio which it's never meant to be, I'd trade just about any position I highlight.

In switching from NUGT to DUST I am NOT implying by ANY means I no longer like GDX (gold miners) or the 3x long gold miners, NUGT, I'm simply expressing my opinion that the gap created today is likely to be filled. Upon any gap fill (total or partial), I will re-enter NUGT long as a trading position and I have one as a long term position that is staying in place.

The P/L on the NUGT position just closed looks like this...

As for the charts that made me make up my mind, the gold charts had something to do with it, additionally the NUGT and DUST charts also had a role.

This is the overall probabilities, as I say, "Go with the probabilities" and on a 60 min chart, these are strong. GDX...
 Leading positive divegrence, it looks like a stage 1 "W" type base is complete with a head fake move already in place and accumulated with the highest level on the chart.

Thus I love NUGT, the DUST trade is just a counter-trend (3C) trade.
 NUGT 60 min is also very strong like GDX.

NIGT 30 min is very strong so I have no problem with the probabilities of gold miners (GDX/NUGT) higher .

The 10 min chart and a very impressive leading positive in the head fake area where supply and cheap prices make it easy and advantageous to accumulate, however today created quite a gap and gaps over the last several years have been filled in a very thorough manner-I wish they weren't.

 NUGT 2 min chart tells me it looks like a pullback in to the gap is likely, otherwise I want to keep a fairly short leash on DUST as it's not a probability trade, but a counter trend so I don't want to be stuck with it when I don't believe in it longer term.

DUST 3 min has a similar/opposite leading positive on its gap down this morning. This is why I'm trying to trim around the fat or thread the needle and close NUGT at a slight gain and try to pull some out of DUST before heading back to NUGT hopefully at a lower price.

DUST 5 min shows a very different chart, leading negative so I don't think it has more than a gap fill/bounce in it.

 DUST 30 min is interesting to study, but the punchline is the current highs have a sharp leading negative 3C divergence, like GDX has a leading positive, that's good confirmation.

Remember the NUGT and GDX 60 min positive charts, DUST 60 min is the exact opposite as it should be, leading negative, thus I only see a bounce in the gap at best, after that I'm looking to re-enter trading longs in NUGT.

Trade Idea: NUGT / DUST

I love GDX and NUGT long, but for a very short term trade in the new trading portfolio, I'm going to close down the NUGT long which was the only of the 7 longs that was in the red about 15% and now in the green, but that's not why, it's the gap fill and I'm going to add DUST long for a short period (gap fill) charts will follow.

All core positions, longer term  positions and so far option positions (especially out to Jan. expiration) will stay as is.


Intraday Market Charts

As mentioned there's an intraday 1 min positive divegrence, all new divergences that may become significant start on a 1 min chart, but otherwise the 1 min chart guides intraday trade, I've been watching to see if this 1 min builds (suggesting there's a new divergence starting, perhaps regarding the talk of a possible budget deal in CONGRESS between 2 (1 Dem and 1 Rep. budget committee leaders), this is far from a congressional vote and passage of such a deal and far from the Senate accepting the same as well as the president so it's actually in its infancy.

The fact intraday prices look like they'll move as they should with an intraday divergence suggests this is an intraday steering divergence and that's all. This is significant because starting at 2 min charts, they get pretty ugly on the negative side, but for now this is what the 1 min positives look like which is why I have told a few members I'd wait on things such as VXX long, which may be a position available later today, but with an intraday move, it wouldn't be great timing.

These are the 1 min intraday Index Futures (SPX, NDX, RUS2K). If I was back in my day trading days, I'd likely be getting ready to put on a leveraged long with a cross of the SPY above the 5 min 50-bar average.

 ES 1 min positive

NQ 1 min is in line, not a big deal

TF after having gone leading negative is now in a weaker relative positive 1 min chart.

The averages...
 1 min DIA positive-leading

IWM 1 min positive, one of the better looking in short term intraday underlying trade.

QQQ is in line here too after an earlier negative divegrence this morning, just like the NQ / NASDAQ 100 futures above.

 SPY 1 min relative/leading positive

Other indications...
 UVXY/VXX Short term VIX Futures, this is why I said I'd wait, but later today this may in fact be a long.

Negative divegrence (trades opposite the market).

HYG very small 1 min positive (relative which is weaker than a leading ) divergence

My Custom TICK Indicator vs the SPY, you can see TICK has improved to a neutral area from a negative trend.

More coming....Remember these are just 1 min intraday divergences