Tuesday, December 2, 2014

Futures Follow Up

As I said, if I see anything interesting.

In tonight's /Daily Wrap , if you had time to read it yet, I ended with,

"I'll check futures before turning in and update if I see anything exciting, but I'm expecting some JPY  or USD/JPY overnight weakness, again the opposite of the overnight session last night."

This is one of obvious levers for ramping the market in overnight trade which it did last night, but I suspect from the looks of $USD and the Yen futures (/6J) that we'd see some USD/JPY weakness, which looks to have been building all day.

Well just as I published and looked at futures, USD/JPY started getting volatile on the downside.
 The USD/JPY which stalled out through the cash market right around the European close is now starting to make some moves to the downside (far right) on this 1 min chart.

The reason I suspected USD/JPY weakness are the individual currencies (futures)... for example...
 Yen positive 1 min divegrence building all day, so much so that it migrated over to the next longest chart at 5 min.

Yen 5 min leading positive divegrence. Since the JPY is second in the pair, that's essentially long USD and short the Yen which causes USD/JPY to rise and most Index futures tag along although over the last 2 weeks the carry trade correlation has been badly damaged, another message of the market as I suspect carry trades are being wrapped up. If the Yen strengthens and believe me, I've seen stranger things, the carry cross starts to become a very big loss at the leverage they trade FX pairs at.

Of course it takes two to tango so looking at the $USDX...
The 5 min chart is in a huge leading negative divergence with no 3C support whatsoever for the last parabolic ramp to the right, meaning it's free to "free-fall" which would send the USd/JPY lower and have ripple effects through the commodity complex, but more specifically to Index futures which I suspect are going to end their 1-day selling climax from yesterday morning or the 1-day oversold condition, especially in light of tonight's internals (Dominant Price/Volume Relationship, The S&P and MorningStar sector performance, all exactly the opposite of last night's deeply oversold suggesting a 1-day (today ) bounce.

As for the Index futures themselves, recent 3C volatility has picked up in certain areas...
 ES intraday 1 min which is not a great chart for the entire overnight session, but as of now it's getting ugly just as the USD/JPY is seeing volatility rise and downside in price.

Also the winner today, Russell 2000 futures (/TF) is also showing a sharp leading negative divegrence in after hours that's moving very fast, there's no doubt these are connected to the FX market action mentioned above.

NQ/NASDAQ 100 futures are still in line, but I suspect tomorrow the bounce ends and volatility on the downside picks up, but as today goes the NDX was the worst performer and of the 9 S&P sectors that all closed green (the opposite of last night), XLK//Tech was the worst performing at a mere +0.02% gain, thus it's likely to see rotation in tomorrow and perhaps that AAPL trade will fire off. I suspect everything starts falling aapart after that and relative performance see's the QQQ outperform tomorrow, although its divegrence is very poor from the start.

Not much has changed in the Index Futures 5 min space, which you can see here in today''s Futures update, Index Futures Update

While not leading negative, you can see the 5 min charts all saw negative divergences/distribution in to today's cash market gains, that is the same, but may deteriorate further as the night goes on.

The Nikkei 225 futures should be effected as well and they look as if they are...
Nikkei 225 futures in line on the uptrend or 3C confirmation (5 min chart), but recent sharp negative 3C action right as the USD/JPY as well as $USD and Yen all signal USd/JPY overnight weakness as suspected today and tonight.

I'll post anything else that pops up. So far it looks like an interesting opportunity to use price strength in the averages on the bounce to short in to, although I and many of you are already set up and just being patient.


Daily Wrap

The charts were telling us an oversold bounce was due, ironically that oversold condition was created in about 30 minutes of cash market trade as well as Futures from the open Sunday.

The SPX bounced +0.64% to reach its 5-day moving average, something people are still enamored with, but is nothing to pay attention to. The fact the SPX was green on the week and lost it despite an expected (posted earlier) late day VIX slam, was notable, but so far as I can tell the bounce is not over yet, but heading that way and in some assets faster than others.

 The daily closing SPX failed to fill the gap from yesterday's open (white arrow), it did break back above the 5-day moving average (yellow arrow), but remains red on the week despite a VIX slam at the close a being in the green briefly (red arrow and small upper wick).

In today's 3 p.m. Market Update I said,  "I would NOT be surprised to see a VIX smack down at the close."

As they tried to close SPX green for the week, that's exactly what happened.
VIX was behaving pretty much as one might expect today when it was slammed at the close. Remember VIX trades inverse to the SPX (green) and as the SPX made a new high intraday (yellow trendline), that "should " have been the lowest point of the VIX for the day, but the closing slam of the VIX sent it to the same level which would normally have been higher. No matter, the SPX failed to fill the gap even with all of today's levers and the VIX slam at the end of the day. This is not just fact, this is a message of the market, when a market needs so much help via levers and a VIX slam on top of that and still can't accomplish the gap fill we have been expecting since yesterday around 10 a.m. as short term capitulation/selling climax was reached.

In fact, they pumped HYG in to the close as well to try to accomplish the same, another failed lever.
HYG which was one of the obvious levers we called out yesterday for today's bounce had near perfect correlation/support for the SPX (green) from the open until just after the European close when HYG went flat and failed to make any higher highs until of course the close as it became obvious the SPX was backing off "green for the week", thus the VIX/HYG levers to try to fill that little gap that was left.

FOR HEAVEN'S SAKE, THEY EVEN WHACKED TLT (FALLING BONDS / BOND FUTURES MEAN HIGHER RATES AND RATES ARE A MAGNET FOR THE MARKET SO THEY EVERN TRIED TLT WITH HYG AND VIX!
and THEY STILL FAILED. AGAIN, THIS IS A MESSAGE OF THE MARKET! (SPX in green and TLT in red with a TLT smack down/yields rise ).

Treasury Yields on the new week are up from 11-13 basis points!!!
As mentioned earlier, I'm not sure if this is a simple effect of TLT being slammed and Treasuries as a market lever to support a bounce, or if there's perhaps a reversion to the mean pairs trade short SPX and short treasuries as they meet each other in the middle.

The other possibility is that crude producing countries (especially Russia with a crashing Rubble) are seeing their currencies decimated since the OPEC decision to leave output where it is, thus they could be cashing in Treasuries, taking the $USD's and selling them in an effort to prop up their own currency. This is why I'm yet to put out a TLT update until I see how yields behave after the bounce has faded and there's no more reason to use T's as a lever to prop up the market. This could be a big trade.

The BIG WINNERS on the day were Small Caps and Transports, but looking at their daily charts, you wouldn't think so at a glance, they were yesterday's WORST performers.

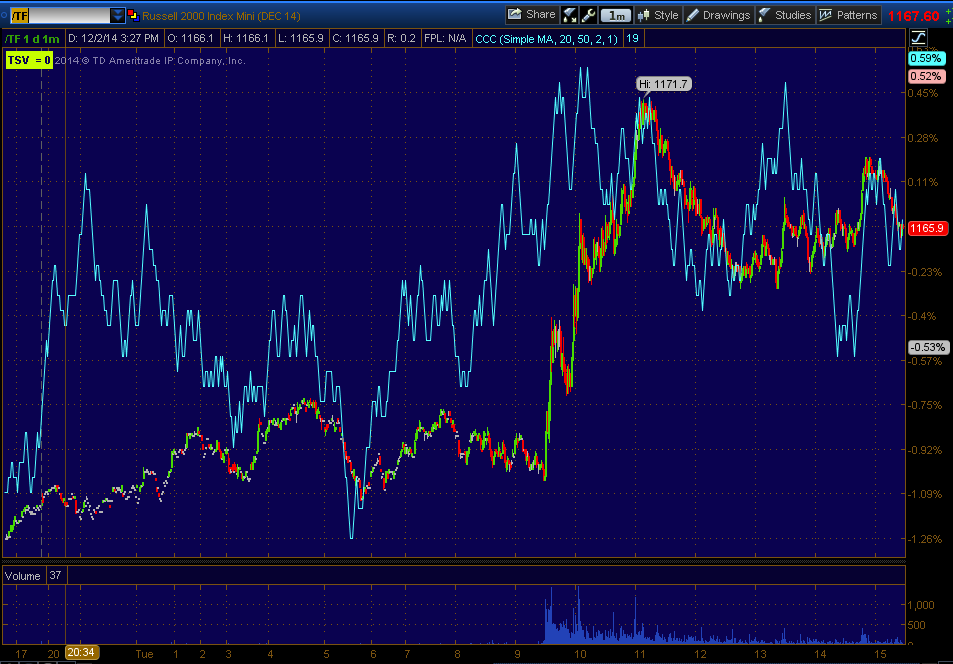
 Russell 2000 (Small Caps) failing to close yesterday's gap and remaining red on the week despite being the leader today with a  +1.25% gain. 

And Transports, the other BIG winner today...
Transports saw a "Tweezer Bottom" ironically (at the white trendline) on the same day HYG was accumulated, the 19th (and 20th) which is a bullish reversal sending Trannies higher in to a bearish Shooting Star (What the Japanese refer to as "Trouble overhead"). This Shotting Star bearish reversal candle sent the Dow-20 down -2.71% yesterday so even today's +1.23% gain, outperforming the NASDAQ 100 by a 3:1 margin, still looks EXCEPTIONALLY weak. Perhaps now the 1-day oversold condition makes some sense in hindsight.

All of this action created a real Hindenburg Omen today. While I've never seen anything (EVER) that requires a Hindenburg Omen as a prerequisite to a market crash/correction, they often do precede such corrections/crashes, but again, are not a pre-requisite. 

Oil dropped by at least 1% overnight as expected after yesterday's short squeeze (both Brent and WTI), however there are some interesting 5 min charts looking as if it might make another short squeeze move higher, perhaps tomorrow.
I meant to post this earlier with Leading Indicators, something just doesn't look right here with commodities (brown) selling off hard vs the SPX (green).

Gold as expected yesterday fell today by -1.24%, so a pretty big move, which is why I didn't panic yesterday and cover the GLD short, but followed the objective evidence suggesting GLD was heading lower after yesterday. SLV barely moved, down -0.19% and Copper wasn't that bad at -0.59%, but oil which I suspected would fall overnight and did saw USO down -2.81% today. The message above is clear, Global Economic Weakness (although I suspect there are more subtle messages within each asset class).

Our professional sentiment indicator closed lower in to the close, the one that sold off in to today's bounce as seen in Leading Indicators. Also HY Credit closed lower in to the close which is important because the pros trade the close.

Speaking of the pros... I had to borrow this chart, but I think it illustrates my argument which was made BEFORE the October rally when we were confident we'd have a VERY strong, "FACE RIPPING" rally, but it was being used as a means to change the ultra-bearish sentiment few probably remember that was everywhere at the time. I made the argument that not only would we have a move that would scare you despite knowing about it ahead of time (and challenged you to bookmark the page to look back on after the rally), but the larger point was that the rally was a means to an end which was a larger drop to the downside.

This COT/SPX chart demonstrates exactly what I was talking about.
If the rally off the October lows wasn't being used not only to change bearish sentiment and get the "Buy the Dip " crowd back on board while teaching them a deadly lesson for the near future, but also as a means to sell in to strength as well as short in to it, then why is the COT going in the opposite direction ?

There are so many hint, clues, red flags, etc. that I simply keep building the case post by post, they certainly can't fit in one post. However I try to add something new when I discover it and tonight I want to impress upon you that to truly make money, you have to see what the crowd has missed. If everyone is thinking the same thing, then no one is thinking.

The market averages are heavily skewed by their weighting, as you probably know the Dow is not the sum of the percentage gain for each of the 30 stocks added together and divided by 30. Each stock has a different weighting, for example Visa is 9.33% of the Dow's weight while GE is a mere 0.94% of the Dow's weight.

The NASDAQ has a proprietary formula and it costs $120,000 a year (membership) to find out what their weighting schedule is, but in the past AAPL has carried somewhere around 20% weight of the average (NASDAQ 100 or QQQ), which is about the same at the time as the bottom 50 weighted stocks COMBINED. Yes, AAPL alone had more weight than the majority of 50 NASDAQ 100 components combined!

For example, the Russell 2000 Equal Weight Index is below it's 200-day moving average while the Russell 2000 is above.
The Equal Weighted R2K in green is below its 200-day moving average while the Russell 2000 is above its 200-day moving average and more to the point, the recent divergence between the two as market breadth breaks down even more so than earlier in the year (click on the picture for an enlarged image).


Or take the world's largest Stock Index, the NYSE, it looks a lot different than the much smaller Russell 2000 or the S&P-500 or the 30 Dow stocks doesn't it? No new highs or higher highs very much unlike the "popular averages".

Take the NASDAQ Composite, all NASDAQ stocks, not just 100 of the NASDAQ 100/NDX (what the QQQ is based on). This looks very impressive until you look at the Advance / Decline line for the NASDAQ Composite.

In red is the Composite, in green is its Advance / Decline line. That's a HUGE discrepancy. The A/D line is all advancing stock less declining stocks so what we are seeing is a hollow market that has gained, but has more and more stocks declining to the point that it's at the worst pivot high since the 2009 rally started. This is a Ginger bread house.

That's why charts like this breadth chart that is hard figures and facts, no interpretation that shows us the Percentage of NYSE Stocks Trading ABOVE Their 200-Day Moving Average are especially important. 

We've hit a new swing low and a new pivot high divergence as more and more stocks quietly slip below their 200-day moving averages while the bulls celebrate the market hitting new highs on a +0.15% gain and no volume. 

You may have heard me talk about my time teaching the Palm Bach County (Florida State Public School System's) Adult Education Class, Technical Analysis and Trading which I did for nearly 4 years. Let me reach around and pat myself on the back as my class for the entire time I was teaching it of some 70 classes was always in the top 2 most attended, only falling in second place to the ESOL, learn English class for immigrants. Numerous times we had to close enrollment because we didn't have an area big enough for everyone. Of course I'm being facetious in bragging about that, who cares!

The point is, teaching Dow Theory is very difficult in the time allotted, thus I used the 200-day moving average to represent the Primary or what we call a bull or bear market, trend as more often than not the trend classification was exactly the same as stocks below their 200-day ma. The point being, under this informal Dow theory replacement, we have just as many stocks in a bear market as a bull market as it's split right at 50!

As far as some of the charts for SPXU and XLF (FAZ) that I mentioned late today, Couple of Quick Trade Ideas here's the XLF charts, thus the reason I mentioned them, SPXU is also looking very interesting (to play XLF short I prefer FAZ long, 3x short Financials)

 XLF 1 min seeing intraday bounce distribution

XLF 2 min far worse...

3 min

The 15 min chart

And 60 min.

There's FAZ and FAS confirmation as well.

Finally, the internals today...If yesterday's Dominant Price/Volume Relationship (among the component stocks of the major averages) was as Dominant as could be in the oversold condition highly implying a next day close green, then tonight's is the exact opposite, Close Up/Volume Down which is the MOST bearish of the 4 possible relationships and it is most often followed by a red close the next day as it is the opposite of yesterday's 1-day oversold and is a 1-day overbought condition.

Along the same lines showing a deeply overbought condition (the opposite of yesterday's 1-day deeply oversold), we have an even stronger 9 of 9 S&P sectors closing green with Healthcare leading at +1.10% and Tech (the weak NDX today) lagging at +0.02%, nearly red. I bet Tech/AAPL rallies tomorrow!

As for the 238 Morningstar groups we track, an equally impressive 185 of 238 closed green, again the opposite of yesterday's internals.

for this reason as well as the other indications, I believe  there's a VERY high probability our bounce ends tomorrow and we'll need to act quickly to slip in to some appealing shorts, maybe AAPL on rotation to Tech tomorrow. In any case, market volatility is insane and the internals are showing it, even if the NASDAQ's close today didn't.

I'll check futures before turning in and update if I see anything exciting, but I'm expecting some JPY  or USD/JPY overnight weakness, again the opposite of the overnight session last night.

Have a great night!


Couple of Quick Trade Ideas.


While I don't think we are at the prime area yet as I don't think the bounce is over yet, the 3x inverse (short) SPY ETF, SPXU is starting to see accumulation and it is confirmed by the 3x long SPY, UPRO which is seeing heavier distribution and distribution that never left.

XLF/Financials is showing sharper and stronger distribution/negative divergences than most assets, FULL HOUSE negatives. I like FAZ, 3x short Financials (long) and as the day passes, FAZ positive divergences are coming alive and building, longer term already very positive. FAS, the 3x long financials is showing VERY clear negative divergences today, confirming XLF and the FAZ long I like.

There are others, but these are moving quickly toward the trade.

Index Futures Update

This is perhaps some of the best data so far. Yesterday I would have never called for a bounce based on the averages alone, most of the data showing a bounce for today (at least before the close and a look at internals) was the flame out or 1-day oversold condition and Index futures.


For a better idea of how long Index futures divergences last (as they are different than the 3C charts on the averages), check out Sunday Night's post in which we could clearly see the trouble ahead in the market and not only near term as in Monday morning, but larger scale which is upon us now, so this post is worth revisiting any way... Sunday Night Index Futures


ES 1 min
 The 1 min chart has been in line all day as we have seen with numerous other assets suggesting we are not done with the bounce yet, however recent negative action has picked up, even worse than this as it is moving pretty fast.

 This is what the ES 5 min chart looked like yesterday and how it was easy to forecast a bounce as there was a clear 5 min positive divegrence. Now the same ES 5 min chart looks like this...

 The same positive is there and there's still fuel in the tank, but there's a VERY clear distribution / negative divegrence in to today's move higher specifically (look at the red arrow/3C and price).

NQ/NASDAQ 100 futures 1 min
 These are clearly in line and probably about time as the NDX has been the laggard all day and still is. I wouldn't expect to see any negatives yet being it hasn't made that much of a move, but they just started setting in and if my gut feeling is accurate, that smart money really doesn't need to sell/short in to price strength because their positions are already set just like mine and many of yours, then it's not surprising to see a more mellow divegrence softly turning.

 The 5 min NQ chart is one of the reasons I said I thought the QQQ would be the laggard today, NO POSITIVE DIVEGRENCE!

However there is a clear negative divegrence setting in on this stronger timeframe.

TF intraday which is about in line, but also trending sideways looks about pegged for the day unless there's a VIX slam.

 This is what TF looked like yesterday making a bounce call pretty easy and a high probability, but now...

Again, the same distribution/negative as ES in the same area as well as the same area as NQ even though it has barely moved in relative terms.

I'd say we are not done with the bounce, but we are at the start of the end of the bounce.

Leading Indicators

From a quick look at Leading Indicators, they are for the most part, NOT buying this move. The only ones that are we already knew about, that would be yields as TLT / Bonds would be knocked lower for the SPY Arbitrage lever, or HYG's support.

I get a feeling that there's an overall feeling of not only not buying this bounce and likely selling/shorting it, but that there's almost a smooth transition from when the bounce ends to a clean move down almost as if they don't need this bounce for anything, THEY ARE ALREADY IN POSITION.

 VXX vs SPX has behaved pretty normal today overall, VIX not much different.

My custom SPX/RUT ratio shows a leading negative dislocation for the broader area

And specfically for the bounce, although intraday it was supportive at first.

And on a macro trend very negative, but note how VERY positive it was at the October lows, one of the many signals telling us a strong move up was coming.

 HYG which had 3C support yesterday and thus morning and is now fading had PERFECT market support seen this morning until just after the European close, then HYG dislocated and seems to be selling of as it's job of supporting the market for the bounce is over and this mirrors in non-manipulative/lever HY Credit...

High Yield Credit which is not manipulated like HYG as a market support lever is just selling off through all of this .

Here it is selling off going in to last week's ugliness and yesterday's sharp 30 min decline causing an oversold condition in a mere 30 minutes.

And the longer trend showing divergences at each top/pivot, they are nothing compared t the divegrence now.

 Pro sentiment is selling off in to today, supportive yesterday.

And here's our second pro sentiment, clearly selling off not only before yesterday's plunge, but solidly through today, so it seems this bounce doesn't have much more time, but I still don't see it as over yet.

The indications above show it clearly as a bounce and nothing more.

 Yields lead the market lower to yesterday's sell off, but they are supportive today which is a function of the treasury /TLT levers being used so this is to be expected, but for now it is supportive intraday.

And the 30 year leading the market lower and now inline, again this has to be expected when the TLT lever/SPY arb is being used.

Market Update

So far everything is progressing, but progressing in a very dull manner considering the Dominant Price/Volume Relationship last night which was incredibly dominant and  it will be fulfilled with green closes as that particular relationship most often results in on the next day.

Otherwise, since the VXX/TLT/HYG update, three's progress, but slow in most cases.

The SPY Arbitrage that we suspected would be in effect as a method of supporting the market is with HYG up, VXX and TLT down on the day.

I'll post a futures update and leading indicators as well as several more assets, but here's where we are now, again painfully slow and dull considering HOW oversold the market was on a 1-day basis yesterday which you can see in last night's post, Daily Wrap Pay special attention to the Dominant Price/Volume relationship which was as dominant as I can remember it being and pointing towards a green close today, also the S&P sectors and more importantly the Morningstar groups (how many closed red). Essentially I'm saying considering the market internals yesterday, today's move, despite the IWM with a fairly decent gain, is much tamer for a bounce than I would have expected.

This move is not over yet, but I do see deterioration.

*These charts are slightly sour as the market just put in a stronger relative move in the last 3-4 minutes)*
 HYG is seeing worsening activity as the 3 min chart digs a deeper negative divegrence.

 However until this 5 min chart is negative, I don't see this bounce as done.

VXX is also showing improvement intraday in underlying trade, but I'd like to see a leading positive divegrence as I drew in with the orange arrow, otherwise action has been dull , but not just here, EVERYWHERE.

I would NOT be surprised to see a VIX smack down at the close.

 TLT may be the one exception, the 5 min chart is putting in a stronger divegrence, so much so it has migrated over to the 10 min chart which is what I was thinking may happen and why I've been holding off on a larger TLT update as this is really the main aspect I've been waiting to see resolve and ironically it is the asset that is seeing the strongest intraday underlying movement.

 TLT 10 min now leading positive this afternoon.

The TICK chart went from a trend to flat between +/- 750 which explains why the+1250 so there's a bit more excitement now as opposed to just 10 mins ago (and all day before that).

 IWM 5 min still has its  divegrence, but has been flat the rest of today.

There's very little movement otherwise in the averages themselves, but they never had very strong divegrences, it was the Index futures that really told us the most and I'll update those soon.

 AAPL is seeing some interesting activity as the 2 min and now...

3 min charts are starting to lead negative.

I won't say that this changes anything as far as the AAPL set up, but if this behavior continues, AAPL may have to be a short where it sits for those who want it.

More to follow...