Friday, June 13, 2014

The Market Into Next Week

Going through the charts, there's a lot today that looks similar to yesterday, which is to say quite a few newly formed divergences have been either run-over like yesterday or deteriorated pretty badly.

Right now, the 1 min charts for the averages and Index futures are negative. There are scattered positives, mostly in the 2 min area, a few out to 3 min and the IWM has been able to maintain a 5 min positive looking signal, but not quite a clean, clear divergence. I mention this to contrast it with the 5 min SPY which is just seeing more damage today. It has been a while since I've seen this kind of activity, but I'd say there's a real sense of fear and the hedge fund herd that usually moves together, seems to be breaking up in to an every man for themselves or "Whoever sells first, sells best" mentality. I believe that's why it has been so difficult to hold together positives that have formed.

HYG is still supportive of a bounce, although the asset itself has seen deterioration which I showed in last night's Daily Wrap; whatever deterioration was on the charts in last night's post, you can pretty much triple that today, yes, massive deterioration in HYG so I am amazed it's still able to hold in position.

Professional sentiment indicators are similar to last night, 1 is showing what looks to be a very short term bounce, the other is pretty much in line with price which in itself is a bit on the bullish side as it's not leading price lower.

Yields and commodities look the same as last night, yields are in line with price, commodities, apparently because of Iraq and perhaps some safe haven gold buying, are leading the market.

The dominant theme among watchlist candidates is a fairly large H&S top like NFLX that appear to be at the top or the right shoulder and close to the decline to form the right side of the right shoulder.

It's my opinion based on F_E_D communication and the way the 3C has acted since SPX 1900 was crossed (along with these right shoulders everywhere) that the F_E_D / F_O_M_C next Wednesday is going to do or say something to pop the exuberance they see in the market, I suspect it will be subtle so they aren't charged with manipulating the market as we all know they do, but they are clearly unhappy suddenly with the lack of respect for market risk.

The bounce I had envisioned considering I used a partial IWM call position with expiration next Friday, would be along the lines of pre-F_O_M_C and looking at the market as a whole, right now I can't say that I would expect much. In fact I am starting to wonder if it is even possible given it seems any kind of underlying strength that builds is so quickly torn down.

This is why I'll leave all shorts in place, add to them where appropriate and essentially have a small IWM call position as a short term hedge that I know the max. risk of. 

I'm not going to make the mistake of chasing small, ill-formed short term moves when there are large, well formed negative divergences and right at an area where there are so many right shoulders.

Last Friday I said I expected the head fake move that began on 5/23-5/27 to start to be resolved to the downside this week, thus far, that's exactly what has happened.

From what I see right now, I'd expect a pre-F_O_M_C relief bounce and the move to really start generating downside momentum, however as to any bounce, I don't think (at this point) you can count on positive divergences much past 3 mins, meaning I think you'll need to be nimble to capture gains and likely need a fair deal of leverage to make it worth the risk, while also pre-dfining that risk to a tolerable level which you can do with options as the premium paid is the maximum risk.

Beyond that, there has been an exceptional amount of damage done this week and I'm talking about damage being done while the market has lost ground as we usually see distribution in to higher prices, this week we have seen it in to lower prices as well, which is what gives off an aura of panic.


BIDU Long Term Trade Set-Up

This is one of those stocks that has generated a lot of interest, but hasn't generated a lot of good opportunities, right up until this week I haven't seen anything that was really interesting.

Things have changed a bit. I'm not sure if BIDU can bounce, you'll see why in a moment, but if it can even a little, this "New Normal" Double Top, looks to be a very interesting longer term trend play.

 A true double top is a large, longer term price pattern like this, they tend to round between the two tops rather than have a sharp "V" shape. It use to be a double top (like bottoms) would fall short of the former extreme (high for a top, low for a bottom) or in this case, resistance, but after 100 years of the same, Wall St. found a way to use TA against traders as it became more popular, thus the head fake move was born and it can be difficult to tell the difference between a real breakout and a head fake move. If you look at the money flow via 3C (Money Stream shows the exact same thing on this daily chart), the probabilities are very high that this is a head fake move, the break above resistance creates demand for longs which creates an opportunity for sellers to dump large positions in to demand and higher prices. 

The head fake move tends to be proportional to the price pattern which is almost a 3 year top in this case.

 On a 2 hour chart you can see the last 3 stabs at resistance look like they have all seen increasing distribution at the top near resistance.


 The 60 min chart shows the same thing with more detail as it should, but we haven't had much to work with beyond these longer underlying trends.

 Now we are seeing 15 min charts start to set up as the same head fake move that saw distribution in the broad market saw it in BIDU as well.

When Wall St. dumps their positions, they are pretty indiscriminate.

 More interestingly, the 5 min chart is showing a divergence set up for an upside run that again was used to sell in to.

This is possibly the break we've been waiting for. Although BIDU didn't see the same market/price action this week, it did see near term distribution which is the same time as the broad market this week. This is why I'm not sure if BIDU can or will bounce, but a little move above the last 3 day's range and it looks like we have a good entry/set-up for a short equity position as well as a put position, we just need to confirm short term chart distribution in to any such move. I've set my alerts.

Ironically, BIDU was one of the best examples of a short trade that we patiently stalked and let it come to use, we entered 1% off the highs and made a nice gain over the next 3 months as it headed lower, it was the perfect example of a low risk/high probability trade, there's a good chance BIDU does it again for us.

Trade Idea: Short Term IWM Calls

This is based on this morning's post which is a carry over from yesterday's and last night's analysis, Opening Indications / Short Term Opinion

I'm going with a half size position, sort of a hedge with next Friday's expiration, (20th) IWM $115 calls.

Obviously with only a week on the expiration and being I like to have at least 3x more time than I think I'll need, I'm seeing this as a short corrective bounce, but one that I think is worth at least a speculative position.


More Op-Ex Evidence

Take a look at the NYSE intraday TICK data, it's about as flat as can be, of course the averages themselves are just about the same.
The entire day between +/-750 that's pretty darn flat.

Market Update

Looking at the charts, I'd guess if there were a bounce (which I'm obviously leaning toward, but I don't know if it's worth the risk to try to trade), it would have to wait until after 2 p.m. at the earliest, the approximate time the op-ex pin which is obviously in effect today, ends.

Perhaps even next Monday or a combo of both.

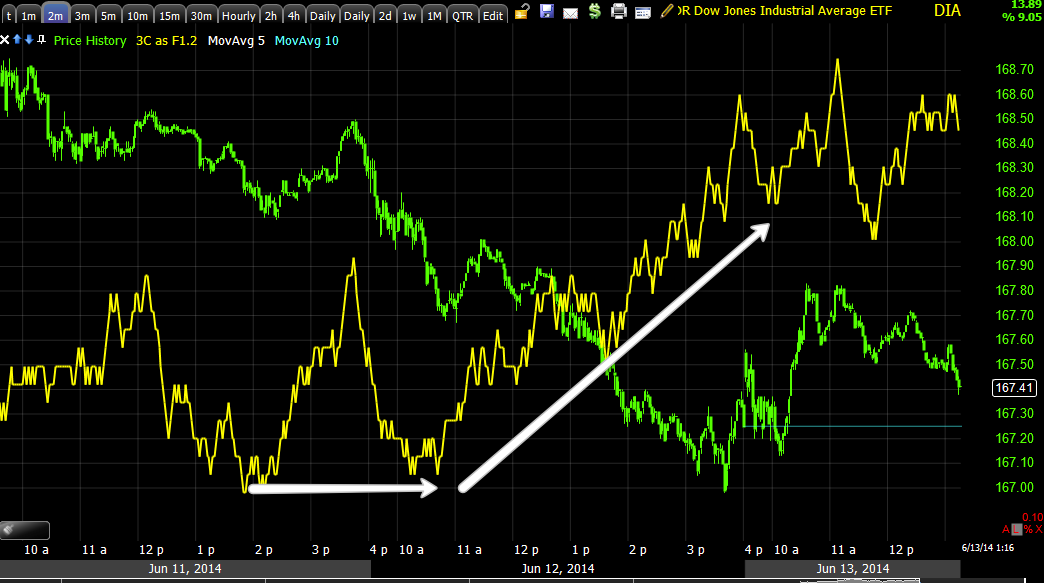
I can tell you the 1 min charts are EXTREMELY unimpressive, I'm guessing that's because they are steering price to maintain the pin, however there are longer charts in the 2-5 min range that are looking pretty decent. Like yesterday, the DIA is one of the best looking, although my least favorite to trade, the IWM is a close second.

 intraday 1 min charts all look the same, like this, either in line or slightly negative, they aren't doing anything positive.


It's the charts after at 2 min that show some clear signals.

Or this 3 min chart.

I'm not sure what to make of this 5 min with a positive that looks like it's getting run over, but we'll check on it in a bit, I suspect 2 p.m. will see a change in market character.

I'll likely decide around then whether I want to play a short term call position or move anything like NUGT temporarily.

For the time being, I'm just finding the shorts I like that look like they could bounce in to a nice set up like the AAPL charts featured last night and setting alerts.


NFLX (Long Term) Trade Set-Up

You might be surprised to hear "NFLX Trade Set-up" since I've put this out as a trade idea and reiterated it probably a dozen times, but just like the market, just like PCLN, just like AAPL, just like IYT, just as my opinion was this morning, Opening Indications / Short Term Opinion. concerning the broad market bounce probabilities (and the fact that about 2/3rds of the market of stocks will move directionally with the stock market), so NFLX looks as if it too will offer another entry if you are interested in a short there.

NFLX is one of my favorite short trades for a longer term position, these few charts probably are more than enough to make the case as to why...
 NFLX Daily H&S Top

4 hour 3C @ H&S top

60 min at H&S top

30 min @ top of right shoulder...

In other words, there are a lot of great reasons not only from an underlying distribution point of view, but from a timing point of view in a major price formation.

As far as near term, I don't expect it will behave much differently than the broad market. I do expect whatever comes of it, it's over by 2 p.m. Wednesday at the latest.

 This is a 5 min 3C chart for NFLX, the 1-5 min charts are positive and you might notice it started around 2 p.m. yesterday , the same time as the market averages as you can see in last night's post, Daily Wrap.

I'd normally go with the X-Over Screen for a target, but it's really meant for daily charts, the X-over is so new in NFLX, the longest chart with the sell signal is the 60 min. Since there's not much room, on a daily chart with a crossover that is confirmed, I'd say the first correction is to the 10 (yellow) and the second to the blue 22-bar moving average. In this case, they're so close, I'd say the 22-bar is pretty much a given. In any case, I'm going to set alerts at $426.50 and a few just above so I don't miss the move and the ability to double check the short term charts and put out the Trade Idea.

Retail Sentiment/Conditioning

I had talked about this earlier in the week, how it would likely effect the shape of the reversal, how Wall St. "would not make it easy" with a clean, clear reversal as they need to keep the "buy the dip" crowd interested, so if they buy a dip of -1% and get a boost the next day, the next time there's a dip of 1.7% which is what we need to get to the start of the head fake move, they'll look at it as, "If a dip of 1% is good, then a dip of -1.7% is even better", this is essential to keeping a bull trap intact so when prices decline into and below the range, the bag holders start a snowball effect as their selling increases supply in a market with little demand which sends price down a lot faster.


In any case, the "BTD" crowd is still very much alive and active as we saw in the Investor's Intelligence Chart showing bearishness at all time lows since they've been tracking it, which means there's little built in demand at lower prices (shorts are an essential part of a healthy market as their covering provides sellers with demand when prices fall), without a healthy short presence, there's no guaranteed future demand (as shorts have to cover by buying at some point to take profits).

We also have sentiment updates from the stream,

Can't believe how bullish twits are everywhere:

"all technical levels protected ,,,,nothing ever breaks down . complete control"


That last part, "Complete Control" is a bit scary as it's this kind of attitude which leads to the market slapping you down and humbling you.

"Decent finish on $SPY ..hasn't taken out last week's low yet, I'm still bullish for now.

I expect $VIX to fail 12.7/13 max

someone trying to protect iwm at key level here"

This is what we anticipated, in a zero sum game, someone has to lose for someone to win.


Trade Set-Up (Longer Term) IYT / Transports

I'm not going to cover too many charts for IYT/Transports as I already did on June 9th which happened to be the near term top that was just put in place, Transports / IYT Are Looking Horrib and Transports / IYT . There are a few concepts here, such as the second post on the 9th that deals with "seemingly" bullish upside Rate of Change in price, however as I point out (often), these ROC's often lead to trend reversals or transitions between stages, the basic concept is "Changes in character lead to changes in trend", which is EXACTLY what you'll see in the Transports / IYT post and subsequent price action.

On the 9th I said I thought IYT made for an interesting position right there and then, especially given the daily candle and the increased volume that day. Last night in the Daily Wrap  I had said,

"6/9 was the absolute top, but if you are still interested, I think we'll get a second chance after today's high volume candle."

The other concept is that of volume, often Technical Traders see a day like yesterday in IYT, breaking support on heavy volume...
 And... assume that the heavy volume is a sign that the next day and near term trend will be down. However, often the heavy volume indicates a short term capitulation event, just like the 4 Dominant Price / Volume Relationships we track for all of the averages, "Price Down/Volume Up", while being bearish, most often leads to a close higher the next day as it is a short term selling climax.

Thus last night I thought there was a good chance we get another opportunity for those who didn't already take it and might want to, to get IYT short and I love the way Transports move, especially given the Iraq/Oil situation.


 This is a weekly Heiken-Ashi (form of candlestick) chart. I'm not going to go over the differences between candlesticks and Heiken Ashi candlesticks right now, but suffice it to say that this 5-day chart close up shows the candles walking the upper Bollinger Band (strong momentum) and as the green bodies get larger, price is more bullish. Unlike traditional candlesticks where a long upper wick is a bearish sign that higher prices were rejected, with Heiken Ashi candles, this is actually a bullish feature.

The red "Star" candle in the yellow box is treated the same as normal candlesticks, this is a loss of momentum and a reversal signal set up and just as important, IT'S ON LARGE VOLUME!

 ON A NORMAL DAILY CANDLESTICK CHART, THE PERIOD IN THE YELLOW BOX IS A REVERSAL SET UP AS WELL, SOME OF THE BEST CONFIRMATION COMES WHEN YOUR LONGER TERM (5-DAY) AND REGULAR 91-DAY) CHARTS BOTH CONFIRM THE SAME THING (A REVERSAL). 

You can see the 9th was the top, it was also the day I posted both of the alerts/updates for transports. Today we have price trying to break above near term resistance which was support until it was broken yesterday.

I'm setting multiple price alerts to look at IYT at each and see if the 3C charts are confirming a SHORT entry (intraday only as the longer term charts are already there as per the link/analysis above from 6/9).

The levels I'm placing alerts at include: $144.35 (resistance), the first area at $145.50-146.10, the second area from 146.70 to $147 and the last area which is where I'd guess price would go on a shakeout above the trendline, 4147.50-$147.90.

Opening Indications / Short Term Opinion

Yesterday we saw several smaller positive intraday divergences get run over and 1 decent 5 min (IWM) positive get run-over, this tends to happen when there's more fear in the air and these smaller set-ups that are in their infancy are abandoned. This is a bearish change in character I've seen in 3C before.

From what I see as of the last two hours of yesterday, the market looks to be trying to set up a bounce again, I don't mean a big one, in fact I have a target in mind, if it can set up without being run over (which an op-ex pin might help), then we can decide if it's worth trading with some leverage, like calls or maybe a 3x leveraged ETF. This is a VERY short term view. I find it ironic that there are so many H&S tops at the top of their right shoulder and turning down just a little over 3-days away from the F_O_M_C in which its board members have come out in speeches declaring their concern about market "Frothiness", a lack of respect for risk and the sentiment that the market will just keep going up forever. Don't think Wall St. doesn't know what the F_E_D is up to or planning (which makes the distribution since 5/23 rather ominous). I've shown you the Home Builders being accumulated for a year and a half as the Tech bubble exploded, WHO WOULD HAVE EVER IMAGINED THAT AFTER THE TECH REVOLUTION, THE NEXT BULL MARKET WOULD BE SUSTAINED BY SOMETHING AS BORING AS HOUSING?

And don't forget the F_E_D "accidentally" emailing 154 Wall Street Hedge Funds and Private Equity firms the minutes from one of their meetings a day and a half in advance, not one of the companies brought this to anyone's attention as they were trading essentially inside information. Since when does the F_E_D have a mailing list when their data releases are supposed to be simultaneous so everyone receives the same information at the same time? Why would they send these firms that information in the first place even if it wasn't a day and a half ahead of the scheduled release? Point being, the F_E_D doesn't want another Lehman and a lot of firms like GS and JPM have helped them out in past crisis', I wouldn't be surprised at all if they (Wall St.) knew exactly what the F_O_M_C intends on doing next Wednesday, again making the distribution since the move above the range and at the top of right shoulders, OMINOUS.

In my experience, a bull market last about 5 years (consider the one ending in 2007, the 1995-2000 NASDAQ Tech bull and now we are at about 5 years (2009-2014), some would call it the "business cycle", but its entirely F_E_D controlled except when things go really wrong like 2007/2008.

The point of saying that was to say this, the vey short term "possibility" or view I have, wouldn't violate the right shoulder and wouldn't last beyond (if even to) next week's F_O_M_C.
 It looked to me at the time of capture that this 1 min chart of the SPY with a positive from yesterday was going to pullback and that's what would be needed (as I said in last night's Daily Wrap) to create a larger divergence capable of making a bounce move, since we have seen a decent portion of that pullback this morning thus far.

 The 2 min chart where there's some migration, but we'd need a bit more than this...

The 3 min chart would likely need to be positive as well which it's not. From the price-pattern, the implied target for the SPY would be about a point, around $195.25.

 On a 5 min chart which is very far from a positive divegrence, you can see that 1 point move would be insignificant, in fact it would be normal, that's how a pattern of lower highs/lower lows is created.

As for the right shoulder of the H&S top, look at the IWM...
$116.50 would be roughly the equivalent move in the IWM, it doesn't mess with the right shoulder at all, in fact it fills it out as I had imagined earlier in the week in this post, Opening Indications from Wednesday morning.

If I'm anywhere near correct, this would also give us a rough timeline to fill out some more positions and give us an idea of when some like AAPL/PCLN would be ready for an entry.

Another Interesting Chart

Considering how many stocks on the watchlist are forming the top of right shoulders in a H&S top like PCLN or NFLX, the confirmation in the broad market (and the R2K is one of the broadest measures, that's why Bernanke use to always reference it rather than the more household Dow or S&P) is not only interesting, it's exactly what you want to see being the market of stocks will follow the stock market with the broad market having about 2/3rd s of the directional influence which is a fact that comes right from the S_E_C's website.

 A H&S needs a prior uptrend and often they are proportional, the IWM is right at the top of a right shoulder like so many other assets we have seen over the last 2 weeks. Volume is huge here considering the IWM really hasn't gone anywhere and is in a stage 3 lateral trend/top.


 Of course the 3C daily chart doesn't hurt to confirm what underlying institutional trade has been during this time...

And my award winning (it was an expensive bottle of champagne) Trend Channel held the uptrend for over a year without a single stop out until the red arrow at the H&S...

Interesting MCP Chart

I would reiterate MCP, but I think I have several times now.

Take a look at this squeeze in volatility, it's typical of a highly directional move on the way and we know that the 3C charts haven't only held up since the post earnings decline (like the RIMM trade), they have improved....

The "Volume at price" indicator isn't so important, that's not the point and those are Heiken Ashi candlesticks, you might be seeing more of them, if I decide to start using them I'll give you a primer and link it to the site.

MCP looks VERY close to a breakout.