I'm going to try to keep this succinct. I have a lot to do in preparation for tomorrow in which we will test the new website's mail delivery system which should be fixed after all of the work Andrea has been putting in to it, but I want to be sure before we transition to the new site, but more on that in a bit.
The F_O_M_C today was what I'd call incredibly bland. I'd also call it dovish on the whole, yet the $USD rallied on the F_O_M_C...
$USDX intraday 1 min with really no strong divergence one way or the other unlike late last week when the $USDX was showing a strong short term positive divergence and the Yen was showing a strong short term negative divergence. This pointed to the probability of a US/JPY bounce early this week which was part of the analysis in the
The Week Ahead forecast that led to the first sentence of the first paragraph of the post laying down the two most probable outcomes for this week...
"There are numerous smaller indications that make me think we either open higher early next week or we try to put in more of a base for a bounce..."
The later of the two was what actually happened so the forecast was pretty pinpoint accurate and the divergence in the $USDX and Yen futures were one of those indications pointing to a bounce early on in the week.
The point is, since that divergence fired off and USD/JPY pulled the market / Index futures higher, there has been no such defined divergence in the USD/Yen.
I suspect that the bounce today in the $USD on the F_O_M_C (
above at the white arrow=2 p.m. today) was meant to help burn off some of the "gas in the tank" I have been talking about as the F_O_M_C statement was probably nothing but dovish which would have meant we would have normally expected the opposite reaction from the $USD, however to burn off that extra "gas in the tank" or capacity to continue the bounce, the market needed higher prices t sell in to and a higher USD/JPY would do that.

For example...
Here we have the USD/JPY in purple and ES/SPX futures in candlesticks at the same point in time today on a 1 min chart with the white arrow being the 2 p.m. F_O_M_C policy statement. Note the USD/JPY moves higher despite the dovish tone of the statemenand note how ES (candlesticks) follows the FX pair nearly tick for tick until the close. Es diverges down a bit after the cash close.
In the mean time, the 3C chart of USD/JPY puts in a negative divergence which isn't surprising considering the policy statement.
ES/SPX futures 1 min are roughly in line with a positive divergence and a minor negative divergence which price responded to pre-F_O_M_C, however once the statement hit at 2 p.m. (white arrow), we see ES move up,
although FAR from an average knee jerk move which tend to be quite parabolic and a bit ridiculous. We also see 3C diverge from SPX futures after the 2 p.m. F_O_M_C.
TF/Russell 2000 futures (1 min) were in a negative divergence all day and most of the overnight session, but they too added more to the downside negative divergence right after the 2 p.m. area at the white arrow.
I didn't like the tone of what I was seeing and the IWM call position that had initially been entered Friday and then added to Monday,
Trade Idea:IWM Calls (SPECULATIVE) which had been down pretty significantly as they had an expiration of this Friday, was closed
I'll Be Closing Out IWM 7/31 $122 Calls.
I didn't take this decision lightly after having sat through yesterday morning's steep sell off of the gap and then some. In other words, I saw a pretty ugly market Tuesday morning and still stuck with the position as I still believed in it, but this afternoon, even though we weren't selling off hard like yesterday morning's opening activity, something was bothering me more about the position this afternoon than Tuesday morning which had been anticipated on Monday as a potential add to area, it was just accumulated too fast to confirm and add to the position.
I would have been happy exiting the position at a small loss, instead it came in at a small gain, but I didn't feel comfortable moving forward with expiration in 2 days and the early action after the F_O_M_C.
As for Leading Indicators, as I mentioned earlier today just before the F_O_M_C,
Futures and LeadingIndicators Update neither were of much help going in to the F_O_M_C, there was very little movement of any kind that would suggest much of anything other than "in line".
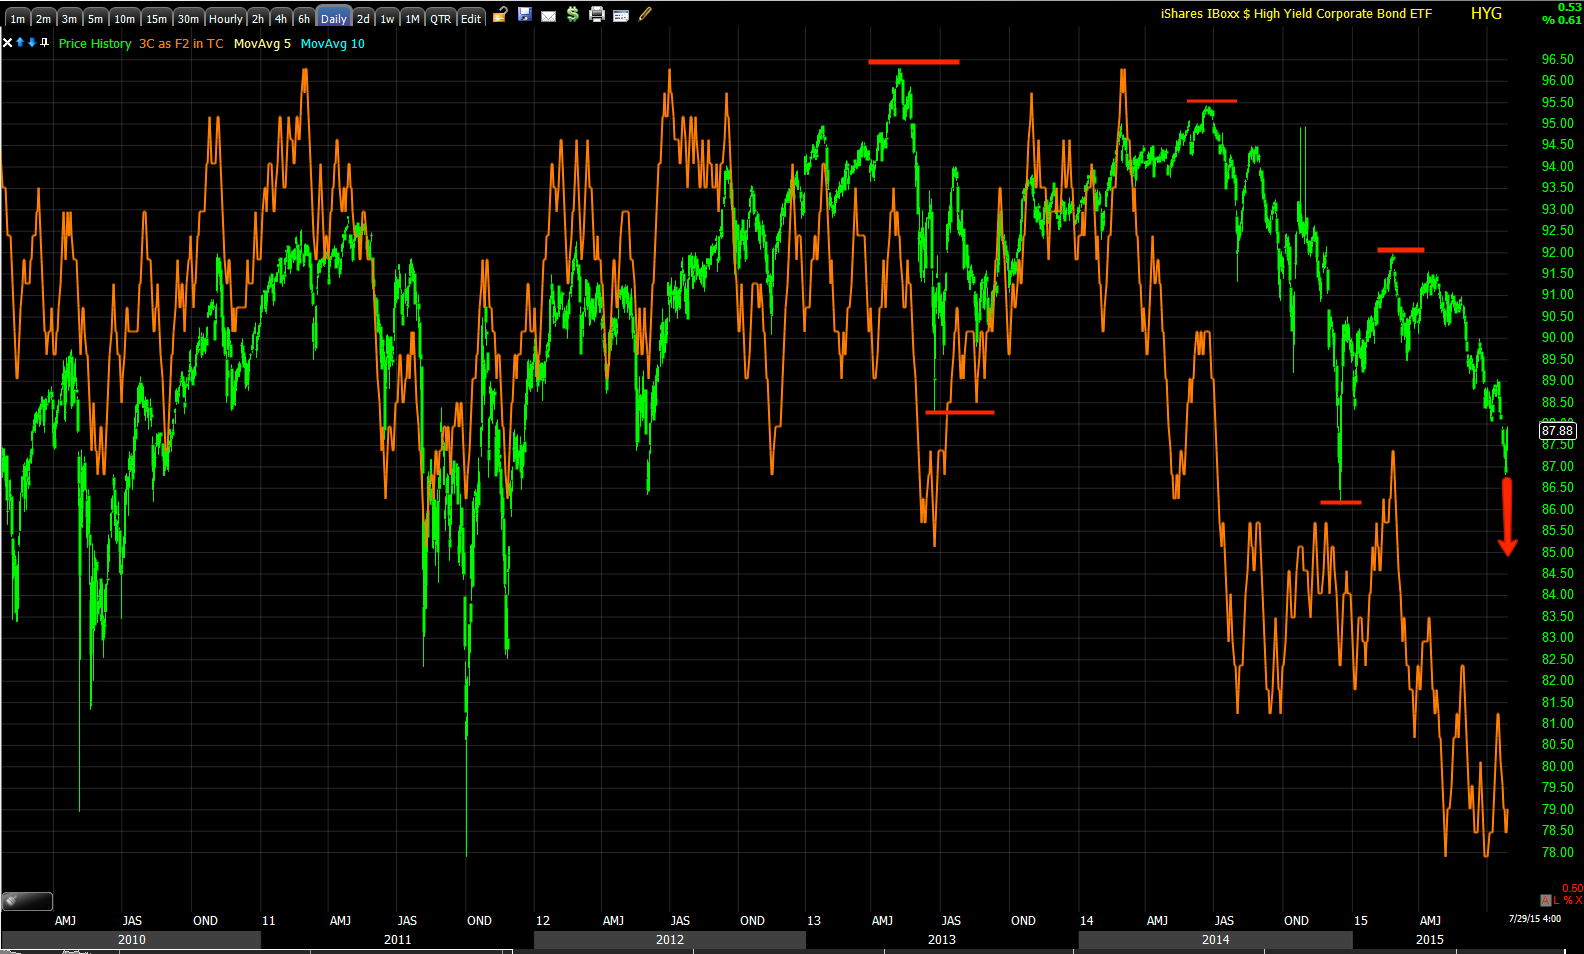
Note how the first lever of manipulation that Wall Street reaches for, High Yield Corporate Credit (light blue) also led the SPX (in green), especially right at the initial 2 p.m. price decline in to early volatility, HYG was leading up and then led the SPX the rest of the afternoon.
VERY near term, I'd say HYG can still be an effective lever of short term market manipulation,
but it's so essential at this stage of the game to keep everything in its proper context, for example you wouldn't know it from the intraday chart above that High Yield Credit which tends to lead the market, is already in a primary (price) downtrend with a strong 3C negative divergence/distribution.
The daily chart shows an extremely strong 3C leading negative divergence and the red hash marks show a primary trend pattern of lower highs and lower lows otherwise known as a downtrend in a primary trend..in other words, High Yield Corporate Credit is already in a bear market and very close to making its next lower low which will be significant.
HY Credit which is not manipulated like HYG because of liquidity reasons put in one of the only positive divergences at the bounce's base area (in white) since it went negative at the May SPX failed breakout/head fake when it started diverging badly.
Intraday it offered no hints other than in line which was the expectation since we have 3C charts of the averages that still had gas in the tank (the capacity to keep the bounce alive a bit longer).
Yields were sold off on the F_O_M_C as you see here with the 30 year yield (in red) vs the SPX. The bond market closes at 3 p.m. which is why yields go flat in to the close, but this is a negative signal for the market as yields have been acting as a leading indicator , like a magnet pulling equities toward them.
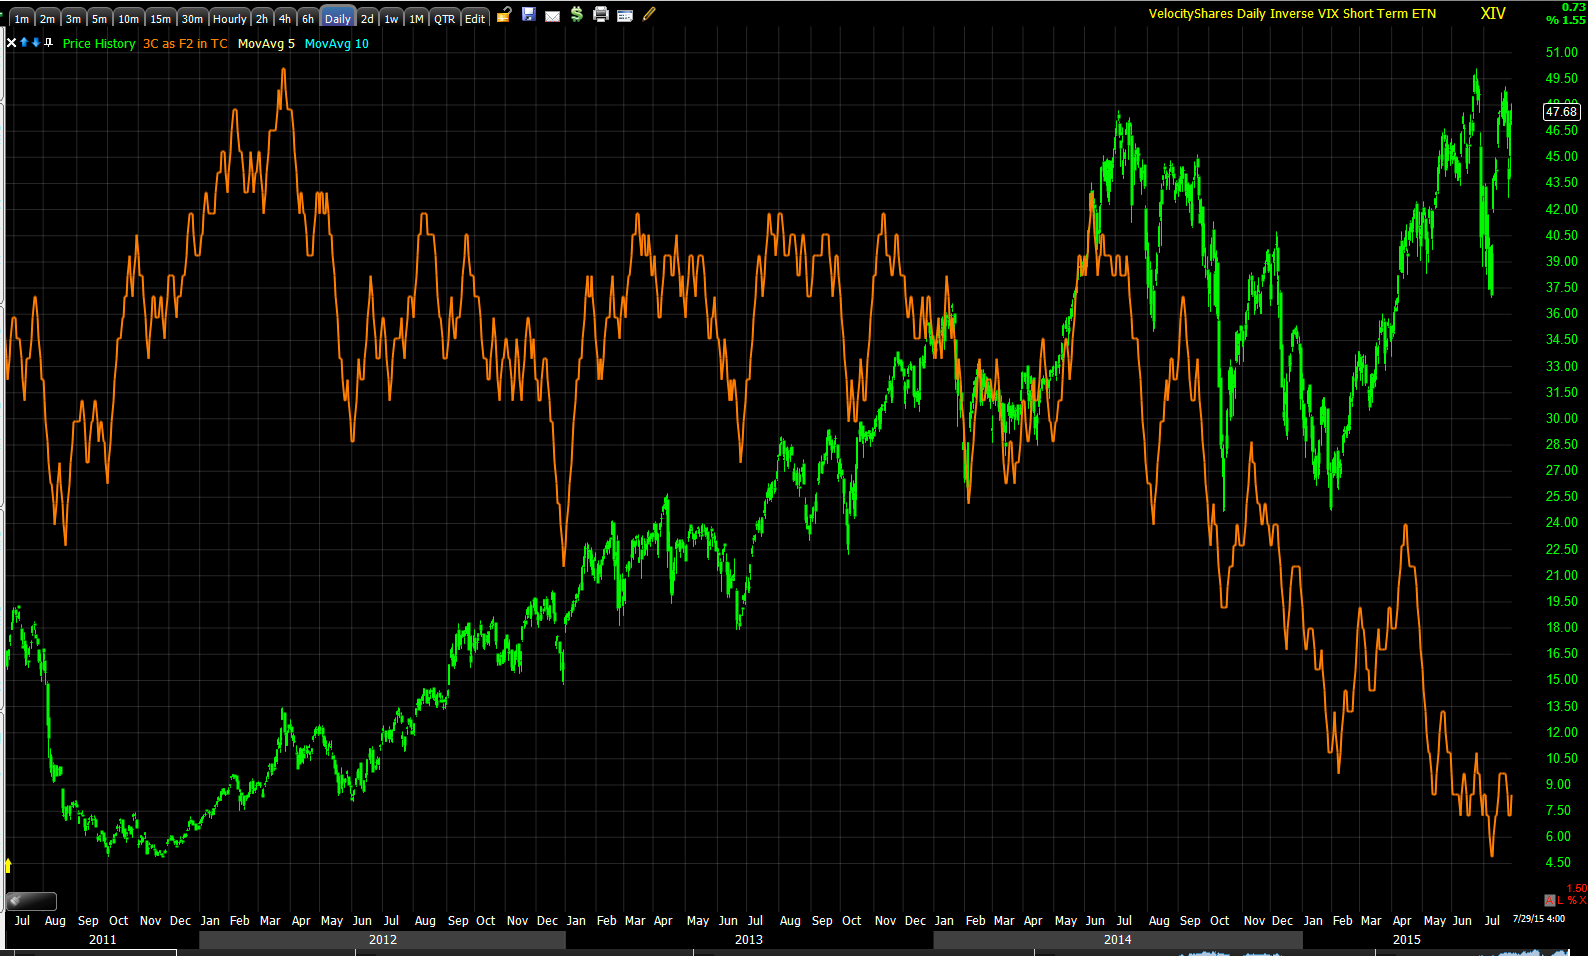
VXX, which I mentioned as a position /Trade Idea today,
TRADE IDEA: VXX LONG (which I left some room to add to or use as a wider stop in case it's needed) , acted a lot better than I would have normally expected. Note the 1 min chart of today with VXX (light blue) vs he SPX and VXX refuses to make a lower low as the SPX makes a higher intraday high.
In fact, at the close VXX "should" have been down at a new low around the orange hash mark. I'd think VXX would have seen an unwind of protection bought in front of the F_O_M_C and thus react worse than its normal correlation today, especially after the dovish statement, but it did the opposite and you may recall that I had some concerns about XIV (
the inverse of VXX which moves with the market), it was putting in worse negative divergences than would have been expected vs VXX's positives.
VXX's (VIX short term futures) intraday steering divergences (1 min) were nearly perfectly in line today as can be seen above .
However XIV which is the inverse of VXX and tends to move with the market (
as VXX tends to move opposite the market) is mostly in line other than a small negative divergence sending price lower this morning, but come 2 p.m. it looks nothing like the confirmation divergence or lack of divergence I would have expected to see based on VXX's chart above, in fact it's leading negative when it should have , or I would have expected it to be in line with price.
This isn't to say VXX did nothing today or recently, it has amassed an amazingly large leading positive divergence.
On the other hand on the very same timeframe and zoom, XIV has quite a leading negative divergence.
On a daily chart, the strongest 3C signal we generally use, XIV was positive to the far left as it moved higher in to stage 2, but has been leading negative at this choppy stage 3 range,
in fact a new leading low in 3C.
As for the HY Credit bigger picture, remember the May SPX head fake attempt to break above resistance from 2015 (yellow)? That's when HY credit started diverging to the downside and its price quickly followed as it has been negative pretty much since which has told us the probability of each and every bounce is that it will fail and on this latest bounce this week, HY credit is in the worst position of the year.
Just some context and perspective...
I showed the intraday 30 year yields, here's the bigger picture of the last 2 bounces, the first being the one off the SPX's 200 day moving average which saw yields lead the SPX higher early on, then went negative in to the SPX's stage 3 top of the bounce and led lower with a VERY small positive at this bounce's base, but not much after that.
Our custom SPX:RUT ratio was one of the signals that gave us early warning a bounce would be brewing this week, but it has completely failed to confirm any upside and has in fact moved the opposite direction.
As shown earlier the ES 5 min chart which was in line to the downside (3C) has seen a negative divergence at this week's bounce, kind of like an alligator mouth wide open to the right in the red box.
This is the prerequisite for any kind of market based short or for instance today's VXX long/Call position. This can become a much wider divergence and overnight it may.
It may be hard to see, but Russell 2000 futures which never went positive for this bounce which is one of the strange things I noted early in the week (the difference between the averages like SPY, QQQ, IWM and Index futures). However post F_O_M_C the 5 min chart is leading negative even worse.
Here's a closer look at the same chart, that negative is mostly after 2 pm today.
And the 10 min chart which is more of the bounce/decline timeframe I rely on is also clearly negative.
I do believe there's still some gas in the tank, but I think we saw some pretty serious churning today in which a lot of distribution can be done in a short amount of time due to the volume.
While churning is not readily apparent on daily charts, there are some hints...
Remember last night I said the QQQ needed to get ABOVE this red trendily to make the bounce worthwhile for Wall Street or effective as that's where retail will see a break of resistance and chase price as I've been told by my retail sentiment source, they were crazy bullish today coming off extremely bearish Monday and very bullish Friday. They just chase price, they have no other edge and Wall St.knows it and uses it to their advantage, but as I was saying, this level had to be surpassed.
However the Star candle and longer upper wick are suggestive of both churning and of a loss of momentum even though yesterday's daily candle was a beautifully strong upside reversal candle. Remember these reversal candles carry no implied target, they just say, direction will change, they don't tell us for how long or how far.
The IWM has the same look with a longer upper wick on the daily meaning higher prices were rejected. Again, yesterday's candle was very strong and I'd expect more on the upside from the candlesticks alone (with volume).
However on an intraday basis as it happened...
The price action and the volume of the IWM (1 min) chart look an awful like bearish churning.
While I'll save the chart updates for tomorrow, I do want to show some basics of breadth to keep things in perspective. I try to show you a couple of different breadth indicators each post. Remember this is hard math, there's no indicator interpretation here, there's no magic of weighting, just hard, pure numbers.
The Percentage of all NYSE Stocks trading
ABOVE their 200-day moving average...
This breadth indication took a serious hit last year,but considering the SPX (red) and the lateral trend, look at the number of stocks that are no longer trading above their 200-day ma, we were around 55% which is already very low for an indicator that is normally around 70% in a bull market and we've moved all the way down to just above 30%. More stocks are in a bear market than a bull market using the 200-day as the Maginot line.
The Percentage of NYSE Stocks trading 2 Standard Deviations ABOVE their 200-day also took a serious hit last year, but as the SPX (red) has trended sideways in a very stage 3 primary top like manner, we have seen breadth fall from near 25% down to something like 7%.
This is the Percentage of NYSE Stocks Trading 2 Standard deviations BELOW their 200-day moving average so not just below their 200-day, but an extra 2 standard deviations below their 200-day and this has gone from something like 2% earlier in the year to an amazing 25% and that's on a bounce. The last time we saw readings this high we had just seen the intense October sell-off, but this isn't a massive October-like sell-off, this is a lateral trend and bounce and we are seeing more stocks fall 2 SD's below their 200-day.
And this is the NASDAQ COMPOSITE'S, not the NASDAQ 100, Advance/Decline Line. Again we saw the breadth indication take a major change of character hit last year, but since look at the falling breadth of the component stocks that trade on the NASDAQ vs. the NASDAQ Composite in red.
As for the gas in the tank charts and the process of 3C chart migration which means as a divergence like distribution becomes stronger, it moves to longer timeframes and diverges there.
I'll show you the strongest gas in the tank chart for each of the averages and then how far the process of migration has gone and how close it is to soiling those "gas in the tank " charts and notice hoow quickly the distribution took place on very strong charts that were once leading positive like a rocket earlier in the week and now... Well you'll see.
DIA 30 min in line
DIA 15 min right behind it with a clear leading negative divergence and look how much was the last day and a half alone on a very strong timeframe. You can look at the chart as of Monday and see it was pointing up like a rocket.
IWM 15 min was in line and already seeing migration infect the "gas in the tank" chart.
IWM 10 min.
The QQQ 15 min was the gas in the tank chart, you can see the damage today.
And the SPY 10 min
With a VERY nasty SPY 5 min hot on its heels.
I'll leave it there for tonight, but in going through the watch lists, I see some bounces that should create some really nice opportunities in some big name companies that a lot of you ask me about often. I suspect we'll be getting ready for the downside pivot that breaks the SPX 200 this week.
Until then, I'd say "We knew when the bounce was coming and how the bounce was coming because of objective evidence which came from patience". Why change what works?
Have a good night.
As a reminder, tomorrow we'll be re-testing the new website and that means I'll be posting on both, first here as normal and that will be the first delivery /email alert and then on the new website,
www.Wolf-on-WallStreet.com If all goes well, you should receive a duplicate email from the new website shortly after the original post goes out. There's nothing you need to do, we'll activate your email categories for you, just let us (Andrea who has been working tirelessly to get this new site up and running or myself) if you are not receiving the second/duplicate email within a reasonable period of time. Remember I have to copy and paste the original post to the new site and publish it, so it will lag this site and Groups email delivery for now. If all goes well, we'll be in our new home this week.
If you have questions or issues, please feel free to send emails to
Support@Wolf-onWallStreet.com