Friday, August 24, 2012

The 3 Pillars- Financials, Energy, Technology

If you recall this Market Update from this afternoon, the confirmation that wasn't there Tuesday/Wednesday as the market put in some strange and fractured positive divergences that weren't confirmed in the traditional assets I look to for confirmation like volatility or the flight to safety trade, Treasuries, started to show up yesterday and confirm.

This led to a look at one of the best kept secrets in understanding Wall Street, market makers and specialists and how orders get filled, the VWAP. I looked at these this morning and came up with  theory based on what I saw, what I've seen the last few days and what I've learned about how the mechanics of the market work and what we might expect;  you can find those posts right here and here.

So there were certain things to look for as this move not only started, but was underway. In reality there's no way to tell ahead of time how much a move may be marked up before they start selling/shorting in to it. We saw the signs that not only confirmed the theory put forth in the second post of the day, but also would seem to indicate that any strength is being used, there doesn't appear to be time or patience to wait for mark up, of course you have hundreds if not thousands of hedge funds all underperforming the benchmark SPX and they aren't concerned with following the herd right now, they are concerned with redemptions hitting their funds as soon as next month. As I mentioned before, why pay 1.5 - 3% a year in management fees on top of the average 20% incentive fee that can run as high as 50% for a fund that can't outperform the SPX when you can buy  simple Vanguard SPX fund and skip all of the fees and still have better performance than 89% of all hedge funds?

So today the theme seemed to be, "He who sells first, sells best".

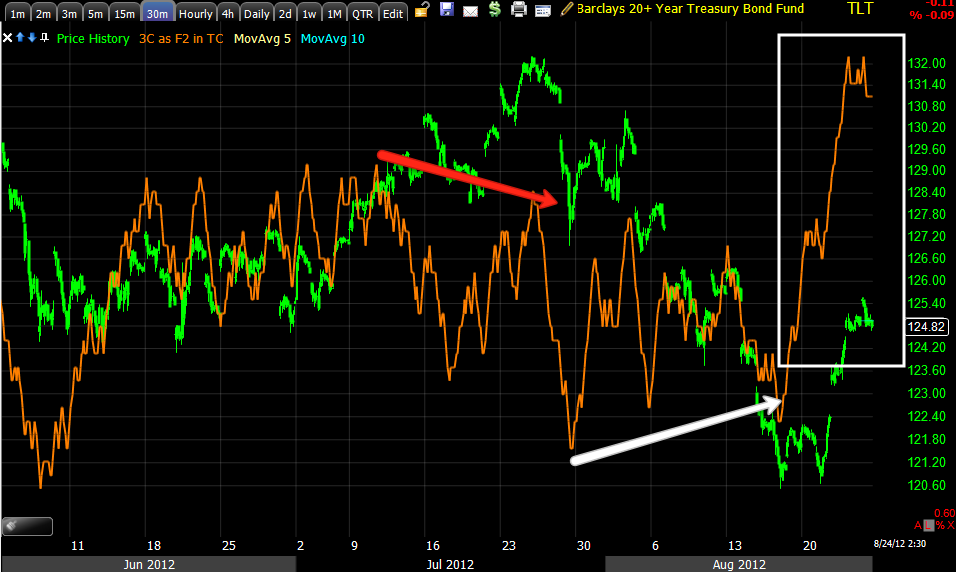
What I found from looking at the DIA, VXX and TLT in the first post linked at the top was that there seems to be solid distribution that is working its way through the timeframes as it should in a normal scenario with VXX and TLT confirming the same. In fact, the other major averages are confirming the same, that's a big difference from 2 days ago when the first signs of accumulation were there, but they were very sloppy and there was little confirmation.

Now the Tech, Financial and Energy sectors are confirming as well as the major averages and Treasuries/volatility. Confirmation is key.

In general what I've found is that the distribution that should start on the fastest timeframe (1 min) and if it is strong enough, should migrate to the next timeframe and the next, did exactly that and at about 5 mins where the positive divergences reached or maxed out at for the most part, were starting to lose their momentum and show early signs of the migration from the 3 min chart to the 5 min chart, in fact, by the close the SPY/QQQ 5 min charts were also starting to go negative, not just lose momentum.

 QQQ 5 min leading negative

SPY 5 min leading negative.

As the 5 min charts turn and start to get ugly, we should see the end of this move.

Here are the 3 most important sectors in my opinion.

*Continued below charts*

 Energy/XLE 1 min negative in to the afternoon and the close.

 XLE 2 min from the positive divergence to a closing negative

 XLE the same on the 3 min chart

 And even the 5 min chart

 The bove charts are basically what I would call noise, they are there to cause movement, they are there to cause doubt, hope and confusion, these longer term charts are the real trends and at the 30 min mark, Energy has obviously been distributed (selling/selling short) heavily in to a rounding top and probably a clear head fake area if I were to look for it.

 Financials 2 min XLF leading negative

 3 min XLF leading negative

 5 min perfectly in line, but no where near the positive seen 2 days earlier.

 Financials at 30 min in a deep leading negative divergence after confirmation, now well below the June lows.

 Technology/XLK 1 min positive quickly went leading negative, while I think stocks like BIDU do have some decent upside left that will likely take this sector as well as others higher, the damage is clearly being done and I'm not so sure that ALL tech stocks will follow the industry group.

 XLK 2 min leading negative

 XLK 3 min from relative negative to starting a leading negative

 XLK 5 min in line, the nature of this move and the importance of it in the big picture can clearly be seen when comparing the negative divergence at the head fake top on the 21st and the relative positive divergence after that. While I do expect more volatility and more upside (however at the rate things are moving it could end abruptly mid-day), I also think it is VERY likely that the top has already been put in and as I tried to show you with a section of the SPY chart vs the full chart, it is often not clear until after when you are looking back.


Finally XLK 15 min is horrendous. When the short timeframes and the longer timeframes all meet in negative divergences it will be hard for the market to do anything but panic.


3 Major Industry Groups Confirming

If you recall the DIA/VXX/TLT post, I'm just finishing capturing Tech, Energy and Financials, they are following in the same footsteps.

Charts will be up in a minute.

ES Update

If I haven't responded to your email yet, forgive me, but my first priority is to all members and this looks to be a pretty fast moving market, I don't want to miss  key signal. I will get to your emails if I haven't already, ASAP.

Here's an example of an important asset giving an important signal, ES the S&P E-Mini Futures.


Opened AAPL Puts

I'm trying something different because a few members have been having great success and when I'm making 100% on a put they are making 250%, so the first half of the position in AAPL September Puts is OTM at $650.


Want to see what's happening in AAPL?

I may just have to take a 1/2 position Put in AAPL here just because of how bad it looks, I really wanted to be patient and wait for a break out to short in to, but with a 1/2 position I can have coverage and add to on a breakout.

AAPL is unique in that it is the largest hedge fund holding, if hedge funds are needing to raise cash to meet redemptions, they have to sell positions, AAPL is their biggest and 89% of hedge funds can't out perform the SPX.

So as I have said many times with AAPL, there's a lot of funds in the room with huge positions, when the door starts to slam shut there will be a stampede to get out even if it is at a loss.


Here's AAPL today.
 Remember this price pattern alone is a bullish pattern that traders will buy, more will buy a breakout above, we already saw the head fake shakeout below, the red trendline is where the upside breakout and had fake would be.

 However even in to this minimal strength, the 1 min is showing distribution.

 same w/ the 2 min

 3 min


 5 min, especially at the intraday highs.

 15 min

And WOW-look at the move in the 30 min.

I try to be patient, but I have good signals here, I have a plan to leave room to add and lets face it,  WE GET PAID TO TAKE RISKS, CALCULATED AND HOPEFULLY MADE WITH OUR HEADS, NOT EMOTIONS.

ES is going very negative intraday-

Market Update

It's working, the last two days I saw the accumulation, but it was strange looking, until yesterday there wasn't confirmation in the volatility indices or Treasuries, yesterday that came.

Now today, early this morning I put together a composite picture of what I think is going on and thus far everything is moving exactly the way I'd hope to see to confirm that early theory.

Take a look at the DIA, as mentioned earlier, a bullish move in a bear market atmosphere is one of the strongest bullish moves you'll see whether a 1 day bounce or a 40% counter trend move like we saw on the first bear market rally after the 1929 crash, there would be at least 4 more, each weaker than the last, but still very strong moves. They aren't strong because a textbook says they are or because that's what history shows, the market is all about perceptions and as Cramer said very candidly, "You never want to do anything that resembles the truth, you want to create a fiction", so look at today's strength as exactly that, not truth, a fiction and if you think about what institutions that have millions of shares to sell or short, think about what they need to do that without losing money, they need demand that create higher prices so these counter trend moves must inspire longs to take the chance to go out and buy and guess who is selling to them (remember a short sale and a sale both come across the tape as a sale)?

 As I mentioned this a.m., the trend line would be the first thing traders key off, the 1 min chart refuses to confirm price strength meaning there's distribution in to price strength.

Just look at the candle sticks and volume as that trend line was broken.
The line isn't drawn perfect, but candles are large, volume is up and fading as we move higher.


 2 min chart was positive this a.m., it is progressively worse through the day, the strength of distribution on the 1 min chart is bleeding through or migrating to the 2 min chart meaning the distribution is more serious.

 The 3 min chart...

 The 3 min chart was absolutely positive this a.m. before the move through the trendline, now it is seeing migration of the negative divergence. This is perfect for the theory I put out this a.m., which was based on the way Wall St. works, not a wild guess.


 The 5 min chart is still positive, but I can tell it's losing momentum, soon it will turn negative

If you are having any doubts about the tactic (because the strategic outlook is already clear, now it's about the tactics of putting trades together to match the strategic outlook), then look at this very long, very important 4 hour chart, there's a positive divergence right at...Can you guess? The June 4th low which was also a head fake move and now a leading negative divergence in to the DIA at this top area.

I have no problem positioning for this, this is exactly why the core shorts were so successful, we've only had 3 really good opportunities this year to get in at pivotal moments and a 4th minor one, the rest of the time we have been killing with short trades waiting for this moment.

Now, here's your confirmation, TLT and VXX, they should look roughly the exact opposite of DIA, remember DIA short term timeframes are turning negative, the important strategic ones are already negative, TLT and VXX should look the exact opposite for confirmation.

TLT-Treasuries, the Flight to safety when the market goes down.
 TLT 1 min, as the market averages like DIA were turning positive, TLT turned negative, but not nearly as negative as the averages, just enough to complete the arbitrage opportunity, not enough to really be selling the accumulated position in any size. Now as the DIA 1 min goes negative in to the move up, TLT goes positive in to the move down-PERFECT CONFIRMATION.

 TLT 3 min is going positive as the DIA is going negative, in effect as the positions are being sold/shorted in the DIA/market averages, new positions are being opened with the short proceeds in the assets expected to benefit from a drop in the market.


 TLT 5 min, as DIA went positive, TLT went negative, but the TLT divergence isn't nearly as strong and now it's turning positive!

 Look at this SPECTACULAR Leading positive divergence in the 30 min TLT, just the opposite of the long term negatives in the DIA. That's a new leading positive high!

VXX
 VXX 1 min goes negative as DIA 1 min is positive, and recently as DIA is negative VXX 1 min goes positive

 Same with the VXX 2 min

 The DIA 5 min is still positive, but VXX is NOT negative, it is in line, it is moving toward positive faster than DIa is moving negative.

Long term 30 min VXX at a new leading high positive divergence.

I absolutely love when the market shows its hand, it makes it so much easier to plan and to have confidence in those plans.

FB Update

I filled out the equity model portfolio FB position this week, I had entered it in 1/3rds to get an average price of $19.60 and I have 2 positions in the options model portfolio, 1 in the green 1 in the red. I have leaned toward an equity/non-leveraged position because FB has done exactly what I expected and formed a base, but I don't know how big the base will ultimately be. If I see a great options entry, I'll probably take it, but I have no idea what that will look like until I see it.

Our first FB position returned well over 100% for many members as we entered calls while EVERYONE hated this stock. I feel it's going to make a nice move up and the equity position allows me the room to wait for it as a 2% position loss there doesn't even amount to a half of a percent of a portfolio loss.

Here's the FB update, while the base looks excellent, we may have a little near term weakness, I'd personally use it to build a position, but I'm already done with that.

 Probable targets for FB, although a new high or at least a high above the June/July highs is certainly possible. I have patiently been waiting to enter FB for almost 2 months after the initial long position was closed. The volume alone makes it very east for smart money to accumulate without raisin any suspicions, that's all supply and very cheap supply, someone has to take the other side of the trade, the only difference is 3C gives us an edge in figuring out who took the other side of the trade.

This price pattern also shows a double bottom, but most if not all textbook technical traders would never see it. Over the last 12 years double bottoms have changed from making a shallower second bottom as they did for nearly a century to making a deeper second bottom that acts as a shakeout, this has been going on for years. I noticed this in double bottoms long before I understood the concept of the head fake and how often it is used.

 It almost looks like they are trying to get retail interested in FB, either that or they will run a head fake breakdown below the triangle as it is perfectly formed with volume and everything. Technical Traders going by the text book would read this as a bearish consolidation/continuation triangle because of the preceding trend being down, so to lock those traders in, they will likely run a move below the support of the triangle as technical traders like price confirmation before entering a price pattern like this, that will be the head fake and the spot where I'd consider buying calls as it would be a great timing tool. As you can se by the maturity of the triangle, we are close.

 Short term charts show some recent price weakness, I'll set alerts for a break of triangle support.

 This is the same chart as above, just zoomed to intraday.

 The 15 min chart can't be ignored, look at the lading positive divergence and look where it came together.

 Now look at the same timeframe through all of FB's trading history, an all time new leading positive high while we are near all time lows, that's strong accumulation. I don't know how anyone who even remotely trusts 3C can't get excited over this chart.

Even the 60 min, for those of you who were here for the first trade  (most of you), do you remember how strong the 60 min divergence was at the small white arrow? Also how strong the leading positive divergence was at the white box, it was a no brainer. Now look at the size of the arrow on this base, look how it is much higher in a huge relative positive divergence as prices are lower, this is exciting stuff.

I'll set the alerts for possible call positions, but if I wasn't already at full equity position size, I'd be using any weakness to add to the position.

BIDU Update

This week I closed 2 PUTs in BIDU, 1 for 1 102% gain and the second for a nearly 90% gain, the first one made that in 3 days, some members made 250%, but it's because we were patient, we waited for the trade to come to us, we/I added when the signals were there.

There's a bus every 30 minutes, so what if you miss a trade, there's another one coming. I'd much rather miss a trade than be greedy of fearful and enter a trade that I don't feel has strong probabilities. The market is weak, yes it could break at any moment on a comment out of Germany, this is why I have been spending the last several weeks realigning positions, now I'm just looking for the cherry trades and BIDU will be one once again, but I don't think it's there yet.

 Remember what I say about head fake moves? They tend to be fast and deep moves. This head fake in BIDU lost over 14% in 4 days on a closing basis, on an intraday basis it lost over 18%. Also note the note quite bullish candle yesterday, but it did reject lower prices combined with high volume, this is the VERY typical reversal candle we see on tops and bottoms and in every timeframe. There's no time/length for the reversal, it could be a day, it could be a month, it just tells us we hit a brick wall for the moment.

 BIDU 2 min looks like it ha more to go, that's great because I want to enter another put position at much better prices.

 3 min agrees

 5 min agrees

 even the 15 min agrees, that's an important timeframe, but don't get nervous that BIDU is suddenly turning in to a bullish stock.

 The 30 min divergence is really nasty here and right at the head fake area.

 This 60 min chart should convince you that BIDU is a lost cause, it's in big trouble, but if that doesn't do it...

How about a daily chart that is leading negative below the 2009 lows?

Just be patient, we'll get a chance.