Monday, March 21, 2011

Price/Volume Relationship

I don't even have to look, it's Price Up/Volume Down. This is the most bearish of the 4 relationships and suggests traders have an unwillingness to aggressively pursue higher prices. I'd like to see a strong volume day tomorrow if 3C looks set to confirm a market reversal, but we'll let the market tell us which way to position ourselves for very short term traders or those making tactical entries.

It's pretty clear that the accumulation/distribution cycle is still in play and full control as news just bounces off the market. The locals have invested in a bounce and a bounce is what they are going to make sure they get, which has already been assured.

However, as you may have seen, it doesn't look like much more then a bounce and we should see a renewed leg down. If the next leg down can close below $125 and move a bit further south, trading will get a lot easier as we will have moved far enough away from the top that manipulating these head fakes into support and resistance of the top will become a much more expensive and risky prospect for the HFTs and other locals. At that point, we'll have entered a fairly smooth sailing stage 4 decline.We'll still have our bounces and such, we may even get a decent bounce off the $120 level as the 200 day moving average should be in the area around that time. Technical traders will make that a self-fullfilling event.

When the 200-day average is broken, support will be difficult to come across. There are a few zones that may still act as support, but many trading programs will go completely bearish upon a break of the 200 day average.

In fact, it's useful if you don't want to get into the intricacies of Dow Theory, to use moving averages to define the trend objectively. As they say, "Trade with the trend". First you need to know what type of trader you are to determine which timeframes will be most important to you. Moving averages are a good way to objectively know where you are in a market's life cycle or the 4 stages that I've talked about (Accumulation, mark-up, distribution, decline) and the neat thing is, they are fractal so whether you are an investor or a day trader, the same 4 trends in the series play out over and over again. To know where you are going, you need to know where you are.

So I'll suggest keeping track of at least the 3 major trends: Primary, Intermediate and Short-Term. The moving averages you'll want to use respectively are (all simple averages) the 200 day, the 50-day and the 10-day. Identifying the trend is as easy as that. Understanding when the trend is changing is where the science and art come into play, but in general, you want to be on the same side as the market's trend or a particular sector or equity's trend.

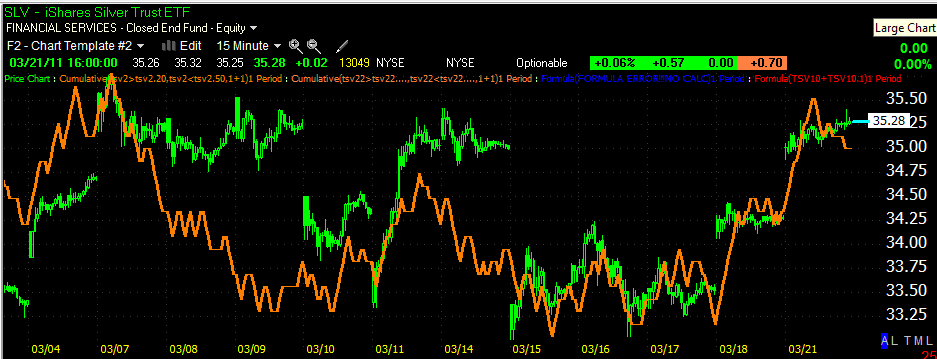
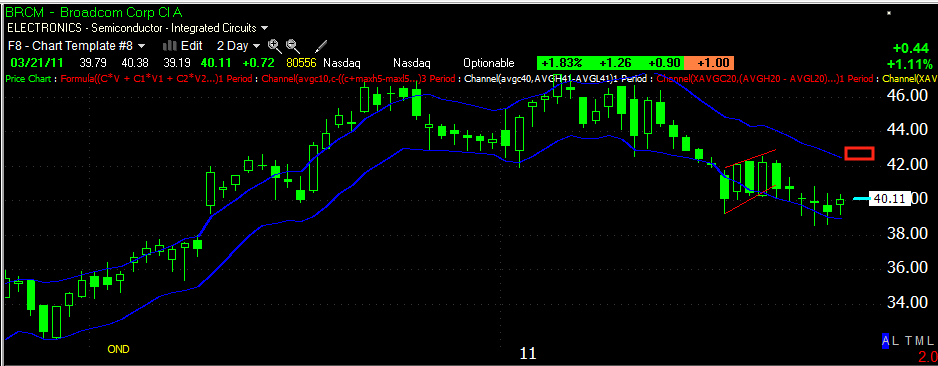
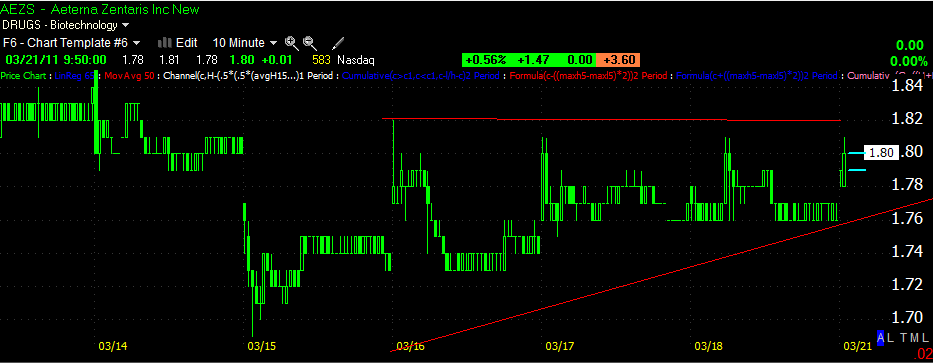
Here's 3 charts showing the trends for a 200-day, 50 day and 10 day moving average.

200 day moving average

50 day moving average

10-day moving average.

Looking at the above, you can see the 10 day average is down, the 50-day is moving down while the 200 day is still up. While there are many combinations, this one suggests the market is moving from an uptrend to a downtrend.

And Now Israel

From Reuters

Israel Launches AirStrikes in Gaza

GLD/SLV

My analysis is little changed here, to me it looks as if GLD is ready to reverse down and SLV maybe has one more day.

 GLD 1 min continued to deteriorate today

 The 10 min chart is in a very steep negative divergence

 And the 15 minute chart took an afternoon turn down.


 SLV's 5 min deteriorated today into rising prices, exactly what I'd expect to see

 The 10 min showed no confirmation whatsoever. I feel the 5 min will make the 10 min look worse tomorrow and that will finally tip the 15 minute chart into a reversal.

Note the 15 min chart has a slight negative bias into the afternoon today.

I'd be a little surprised to see GLD move down and SLV not follow, or to put it better, to see the PMS not move in tandem, but that is what the charts seem to suggest.

Don't Forget About Today's Earlier Trade alerts

I have a feeling from the action in them today that they are getting ready to pop tomorrow, the longs were:
EEE, MVIS, AEZS and TRID

Libya and the Problem with MENA

In my Alternative Energy post last night and several other posts, I talked a bit about why despotic autocrats have led the middle east for so long. To sum it up, the middle east and the borders that were seemingly drawn up arbitrarily by th UN (League of Nations) created enourmous ethnic, tribal and religous tensions and only "iron fist"rulers that essentially terrorized the population by violence could keep these countries intact.


Well today our Defense Secretary, Robert Gates, threw the Europeans another curveball. The inconsistincies within the US administration are stunning. His statement, "US Defence Secretary Robert Gates says getting rid of Gaddafi is 'unwise'".


We know why, but this has got to be getting old for coalition members.

USO Pullback

I think it's coming, which is also to say that USO is one of the few stocks that is acting somewhat normally and is not getting ahead of itself in upside excesses that are sharply corrected to the downside. A pulback here is normal activity and healthy activity. We want our stocks to trend with pullbacks and not go parabolic creating nasty surprises.

 My moving average screen that helps prevent false crossovers is still flashing a bullish but signal. The first pullback area is to the blue 22-day moving average, although I don't think it's the most likely.

 Here we see 1 min 3C negative divergences in USO which hasn't done much today since the gap up. The 5 min chart here is showing a bit of a leading negative divergence. Thus far USO has been pretty stable in its accumulation/distribution cycles despite world events; I count this as bullish for the upside.

 The 15 min is showing a negative divergence so this is a high probability correction and my guess is that the gap in red will be filled.

 Looking at the more important 30/60 min charts above and below, you can see there was a good deal of accumulation in USO and these charts remain positive.


So my best guess is USO pulls back for a day or two, at that point it will most likely offer a good entry/add to set up.

Bounces Are Scary

And that's what they are meant to be. There's little reason to move the market higher right now fundamentally and globally. These cycles of accumulation and distribution have become increasingly new-resistant.

So that brings us to afternoon trade and a trend I've been watching unfold wondering if it was going to spark an intraday move-it hasn't thus far, so I'm assuming that it's being coiled up under pressure for another move up tomorrow and why not? It's not at all out of character with the market's behavior, in fact it's  so increasingly common, you can just about assume and trad off the notion that it will happen. I'm talking about these volatility moves up and down that tend to be right before a reversal.

In fact, the 4 C&D trades released earlier this a.m. have all shown to some degree that they are seemingly pulling a downside shakeout into some accumulation (AEZS, MVIS, TRID and EEE) which would fit well with a pop higher in the market tomorrow.

Here's what I'm seeing and while I'm just showing the SPY, it's evident in all of the averages.

 Lateral trade in the SPY throughout the afternoon with rising 3C indications; accumulation typically happens in this type of price environment.

 The 5 min chart is showing the negativity that I expect to see, basically selling into higher prices and demand is what distribution actually is.

 However, our typical turning point, the 15 min chart hasn't given that signal of a clean ad clear reversal. Positive divergences are mounting, but not moving the market. I have to assume it's for tomorrow unless we get a real big move at the end of the day today. That would increase the reversal chances of being today as we'd probably be very close to a dominant price volume relationship that creates a 1-day overbought event, which typically is also a reversal signal with some credibility.

 Here are the zones of resistance in general, red being the most likely target and yellow of course being a more difficult achievement, but not impossible and with these volatility moves, the market almost always moves further then what you expect.

On a daily chart, this zone would certainly accomplish a lot as far as shaking out shorts, that's the goal before a downside reversal. I don't know if anyone remembers the mistranslation of that Japanese game "All of your bases are belong to us", in this situation it's "all of your shares are belong to us"

So unless 3C changes dramatically before the close and/or the market puts in one heck of a vertical move up, I'm guessing we aren't done with this particular bounce. The more you start to doubt whether this is a bounce or something real to the upside, the more successful they have been. THAT IS THE INTENTION.

A Member's Question

I received an email from a member asking my opinion of the Supreme Court decision that will force the Fed to hand over hundreds of pages of information sought by Bloomberg under the Freedom of Information Act regarding borrowing from the Fed by banks. Here's my reply and initial thoughts....

Whats your take on the supreme court ruling and do you think it hints at “NO QE3”?

"One, I'm not sure how Mark Pittman died, but if you do some research on Fed whistle blowers, you'll find some uncanny suicides, etc throughout their history. That' just a side note. 

Back in 2008/2009 there was a real stigma from borrowing from the Fed discount window, they set up some private facility (I guess that's what this is about) so banks could borrow without the stigma from the market. This much further down the road, I see no reason that the banks would object some vehemently to the release. There's got to be something in there that is very damaging beyond opinions that will be drawn based on what the banks "did", the market is forward looking, it doesn't care much about what happened so there' something there.

As far as QE, that's tough, if for no other reason then Congress itself and the debt. That's why I call it a Chinese Finger Trap. They (Congress) have figured they can spend and spend and the Fed will just continue printing. I think the issue of default on our debt will take precedence as far as Congress is concerned. Bernanke will scare the hell out of them about what will happen if we default so I think some form of QE will continue, but it may not look or behave like what we've seen in the past.

The real question is whether there will be a grassroots campaign led by the Paul Family that does some real damage to the Fed's autonomy. People in the US are getting Fed up, seeing what the banks got and thinking about what they've lost may very well create a Fed backlash. So it may be that the banks were actually a proxy acting in the interest of the Fed, unless like I said, there's some ongoing events that will severely damage the banks and cast doubt on the banking system causing banks runs or something like that.


BRCM Chart request

BRCM is a Trade Idea originally from 2/28/2011 and is at a profit at this point, there have also been several follow up posts. A member wants to know if this may be a good time to add to BRCM. Lets take a look-you could also initiate a position in BRCM if you missed the original trade.

 Here's the intact downtrend making this a less volatile trade then many that are still in the top region. BRCM has acted pretty well since we entered the trade and this is the trending type activity I prefer.

The candlestick today looks as if there's a total loss of upside momentum.

 The 1 min chart is telegraphing an intraday decline here

 the 5 min chart is inline which is good.

 The 15 min chart is slightly negative, I'd like to see a more defined negative divergence before jumping in too deep.

Because the 15 min chart is not a clearly defined divergence, there remains the possibility that BRCM may make a price move to spook shorts out, much like the broader market today. The fact that it hasn't done so today is good for shorts, but it still can't be ruled out with a high degree of confidence. This is the stop tat I'd use if I intended on adding here just in case there is that type of head fake upside move.

12 of 13 Long Trades Are All Up

Last night I laid out the reasoning behind my theory that the next bull market (at least sector wise) would be in alternative energy sources. I have an extensive watchlist that is growing, but in glancing at 3C last night, I listed 13 trades that I thought would take off today, 12 of the 13 are up and the one that is down is only down by less then half a percent.

We are very early in this possible emerging trend so we want to watch for the leaders and those that fall under heavy accumulation. If you entered any of the trades this morning (many would already have you at a decent profit) then be sure to email me for any trade specifics. With so many I can't do them all proper justice in analyzing them.

As for the shorts listed, they are up with the market, but if you are interested in them, let me know as they are looking pretty good for a short position, especially CAT which may be setting up a nasty bull trap today.

If there are stocks in alternative energy (any part from manufacturing, storage, transportation, etc) that you would like to be included for ongoing analysis, just email me your favorites and if they aren't on the list already, I'll include them. There are many different forms of alternative energy and they are each at different levels of development. The companies that provide materials, analysis, transportation, etc will be important to watch as well to put together a composite picture of which forms of A.E. are being most seriously considered.

USO Update

Here's Friday's USO Analysis

The important points from Friday' analysis and recent analysis of USO have been 1) that the majority of the charts are strong and suggest USO will make nw highs above the March highs and 2) that any downside momentum we have seen thus far has been weak, meaning the downside divergences haven't shown a lot of commitment and don't seem to amount to much other then average market action.

 A negative 1 min divergence on the open today, thus far USO is not confirming on the 1 min chart, but on the other side of the coin, once again, the negative divergences aren't looking that committed.
 For example, the 5 min chart is in perfect confirmation, there's been no bleed over from the 1 min negativity.

Tuesday of last week was the day the reversal call was made, which was accurate to the day. Here we see a fairly strong hourly positive divergence in leading position. This is part of the reason, technically, that I believe USO will accomplish a breakout from the early March highs.

Market/PMs/Currency

Here's the charts so far and what I've been expecting.

 DIA 1 min very negative divergence-with a 1.72% gain today

 IWM going negative into a 1.88% gain today

 The Q's negative @ a 2.19% gain today

The SPY starting to go negative into a 1.64% gain today.

As I mentioned last week and late Friday (as posted earlier this a.m.), I was looking for that "scary" move up that would shake out shorts, today's gains achieve that effect and we are starting to see the distribution cycle underway; it's a little more developed in certain averages, but we want to see them all hit negative on the 15 min chart to say a reversal to the downside is coming. The entire point of a bounce these days is to create volume and shakeout traders which go hand in hand, this is the way High Frequency Trading makes money so the moves tend to be even more volatile then what we've seen in the past decade. I've compared the market to a pendulum which swings way too far in one direction and then way too far in the other. Being we are also in what I'm fairly certain is a top, the volatility increases as well as a matter of historical fact so that compounds the situation. However, all in all, this is exactly what was called for last week and what has been expected. This behavior can be very good for us as it allows us to enter or add to good short positions at a better cost basis.

Now we are on watch for the divergences to all meet up and confirm around the 15 minute chart, then we'll know we are at a high probability reversal.


As for precious metals...
 Last week I noted the bear flag shaping up in GLD and SLV and that we could expect a false breakout from the very obvious technical price pattern in two very heavily traded ETFs/commodities. In red today, we have what we were looking for. As I mentioned in the last GLD/SLV update, GLD looked to be the weaker of the two and prices today show that to be accurate (+.77% for GLD and 2.25% for SLV)


 GLD, I believe is closer then SLV to a reversal. There's a negative divergence on this 15 min. chart so today may see a bearish candle on the close. This is hard to reconcile with all of the news stories we see about the demand for Silver and especially gold, but usually when I argue with a chart, I come out on the wrong side.

 SLV bear flag in white and today's destruction of the technical price pattern with the gap up, again, exactly as expected.


In SLV we are seeing a negative divergence forming this morning on the 1 min chart. The 5 and 10 min chart also fail to confirm, but as I also said in the last update on SLV/GLD, "SLV looks stronger and may have another day in it beyond GLD" so again, we'll see if and how quickly the negative pile up into the 15 min chart. As far as today's price action, much like Fridays SPY calls with heavy open interest at $129/$120 were pinned and today we saw what was expected, a move beyond $129, we are seeing the same head fake action in GLD and SLV. For traders wanting to short either, this gives you excellent positioning, lower risk, higher probabilities and the ability through risk management to take on a bigger position, so if you are trading on the short side of wither of the PM's, today's action is a market gift. We just want the high probability aspect and that will occur when our negative divergences on both are complete at the 15 min charts or beyond.

Currencies....

As mentioned this morning, this is a make it/break it point for the $USD. Things have changed rapidly for our currency with the catastrophe in Japan and several other unexpected/un-discountable events. However, the heaviest weighted component of the Dollar Index is the Euro at 50%. So far this week the Euro has traded relatively flat with some volatility taking shape this morning, that could be a precursor to weakness in the euro, pushing the dollar Index higher.


As for the Yen below, it remains relatively safe from intervention like we saw last week in the red box so long as it doesn't threaten the $80 level. Last week it came very close, but has since recovered. I'm not sure how much weight the USD/JPY has on the Dollar Index, but so far it seems that conditions are fairly stable for the dollar to try for a recovery to the upside.


Here we see UUP (used as a proxy for the Dollar Index as I don't have intraday data for the Dollar Index). We see the positive divergence gaining a little momentum this morning. We will see if that continues to carry through. If it does and we get a technical breakout above the $21.87 level, there's the possibility of a short squeeze there which may make for a decent long trade.

USO Update

Here's the last update on USO from Friday afternoon

USO is up today, the Libyan action taken by the coalition has gone well so far as should be expected. The initial destruction of command and control is usually a fairly easy task without too much risk. However, as I've stated many times, it's the longer term outcome which will drive oil higher as the operation gets more complicated including a possible insurgency which would force the coalition to make some very difficult choices. I still see nothing on the chart or in the fundamentals of the situation that would deter oil from making a new March high.

It's a bit early for 3C on this one today as the locals are still dealing with overnight retail orders.

And Another-AEZS (Long)

 A small ascending triangle. Again, this s not a position trade, it's a quick hit and run, if you get a double digit return, you should be taking some or all off the table.
 The hourly chart shows the recent head fake breakout to be a false one, but the decline since has seen a positive divergence.
I'd be considering this one on a breakout above $1.82

Another C&D Trade-MVIS Long

Remember, these are speculative, quick trade. Any double digit gain should be taken partially or entirely as they are market gifts.

 MVIS should break out and volume hopefully will rise at $1.36-$1.37

The 15 min chart strongly suggests an upside reversal. This is not a position trade, more like a hit and run.

TRID-Another Speculative Cats and Dogs Trade (Long)

Take a look at TRID

 There's a very small triangle th last 3 days with a Harami reversal (bullish) formation from Thurs./Fri. of last week.

The 60 min chart has a positive divergence. I'd suspect somewhere slightly above $1, possibly $1.03 could trigger some buy side volume.

Check Out EEE (Long)


The next few days will be important for the Dollar

Sometimes we have events that smart money can't discount, such as the Japanese Earthquake/Tsunami and the resulting monetary policy. It's not often that we see these kinds of shifts, but lately we've seen quite a few.

 A false breakdown is very common these days as are false breakouts, determining if this is a head fake or the real thing will have important implications for many commodities.

 The 5 min chart shows several days of accumulation suggesting this may have been a false breakdown, but they occur at the same time the G7 came to an agreement with regard to Japanese currency, so the chart remains in question.

The most recent information shows only a small positive divergence, not big enough to make any kind of call on yet so watching the dollar this week will be very important.