Tuesday, August 20, 2013

Daily Wrap

Because of Friday's "blah" intraday signals and even the opening of futures Sunday night, I didn't expect much to happen Monday unless it was late in the day, I expected action to pick up Tuesday, but I must say in front of tomorrow's 2 pm release of the F_O_M_C minutes, I'm surprised at some of the action even though charts have been pointing to that.

What is also strange is how fast some divergences (positive) developed, but how tight they are, as if smart money was buying in to higher prices as if they knew something in advance about the minutes or had a plan of how they were going to shake things up, it just was not normal, perhaps increased market volatility, but I think the first option is more probable.

Credit acted a lot better today than one might think, especially because there was no real tell or build up, it just popped much like some of those linger term 15 min 3C charts did.

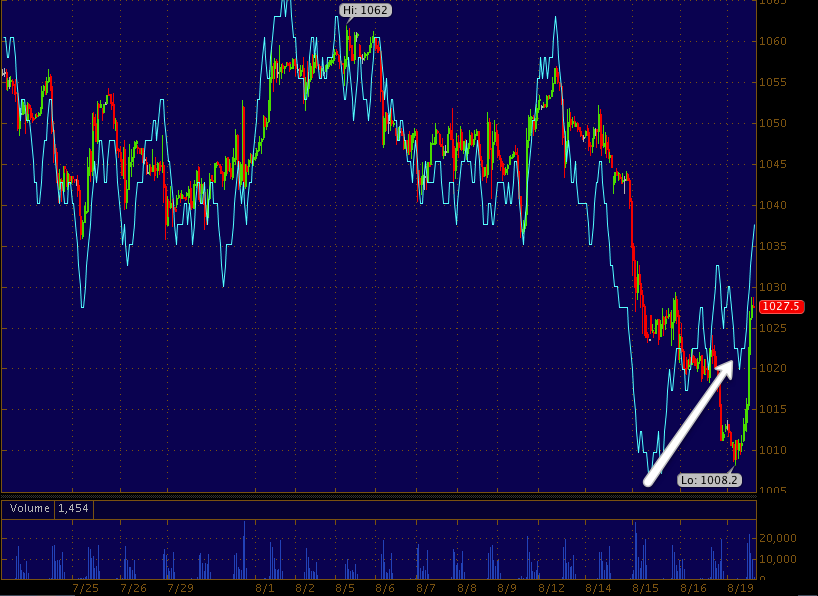
Gold and Silver got smacked down overnight around 1 a.m. but recovered, however this makes me wonder about the two assets and a real pullback in both.

 Gold 6 0 min chart so the smack down doesn't look as dramatic, but it was around 1 a.m. as you can see, the 60 min, negative divergence is in place, this is what makes me wonder how long they can hold up, I don't think too long.


Silver 30 min 3C chart also has a sufficient negative divergence and saw a sharp move down around 1 a.m.

Credit jumping back in to the fray was probably the biggest news other than divergences for a bounce.

 HYG Credit vs the SPX, that's an odd transition

HY kept up, but looked like it was suggesting a pullback for the SPX.

And Junk Credit also made an odd transition.

IF WE DO GET OUR BOUNCE, BE SUPER CAREFUL AND DON'T GET GREEDY WITH LONGS BECAUSE THESE MOVES IN CREDIT REALLY DON'T HAVE GOOD SUPPORT, THEY SEEM LIKE LAST MINUTE, "SOMEBODY KNOWS SOMETHING" AS WELL.

I've been showing USO a lot and looking to get in there short, it got smacked down today as well at the close so I'm hoping I didn't miss a chance.
USO today in the red box selling off during afternoon trade.

Currencies were quiet again, this is getting strange, I wonder if they're waiting for the F_O_M_C minutes?

For the first time in what seems like week, TLT finally not only moved higher, but resumed a "Close to normal" correlation, this is a long I put out a specific post about last night so I'll be looking for opportunities there.

As I said though earlier, one of the strangest things to me was some of the 3C signals today...

 SPY 15 min

IWM 15 min- this was a horrible performer just yesterday!

Financials 15 min.

Just like the "V" reversal in credit today, the 15 min leading positive divergences look very rushed, I'm quite sure there had to be buying in to higher prices to get that done and I can't think of many good reasons they'd do that without knowing something in advance. It's just too out of character, too strange.

I'll keep an ee on over night futures and I feel good having some calls in XLF and some other places, but I wouldn't want large exposure to this VERY strange environment that took place today.

One last thing, tomorrow the F_O_M_C minutes are released, they are typically more volatile than the policy statement, as I ALWAYS do, I'm reminding you to beware of the F_E_D knee-jerk move, it can be exciting, it's also often wrong.

I'll report back if anything else pops up, other wise I'd play it safe and any longs should be quality like MCP, at least as of today's close.


BIDU Trade Idea / Set Up

BIDU is one of my favorite shorts of the last few years and if I ever wrote a book about how Wall Street uses Technical Analysis and Technical traders' laziness against them, BIDU and the posts from that period of Late March/mid-April 2012 would be textbook.

The chart itself may not look that impressive, it was mainly the posts days and weeks ahead of time saying, "OK, watch for this to happen" and why and then the next part and the entire thing went down as envisioned and the trade came right to us on our terms with hardly any risk in the position.

A) is a large triangle that first caught my attention as 3C was clearly negative and in my experience I don't think I've ever seen a large triangle that wasn't a top (proceeding an uptrend), as a matter of fact, GLD did the same exact thing (large triangle) in 2011 when we called a top in GLD. ADM was another that gave us a head fake move too in 2008 (ADM is probably where I first really started understanding what they were and how they worked.

The key with large symmetrical triangles is understanding that they are NOT to be treated as a consolidation triangle that is so popular in Technical analysis that typically lasts a week or so to a month) those are corrections through time rathe than price. Technical traders love them because they are the easiest to remember,  descending and ascending (bearish and bullish) triangles can get confused easily by new Technical traders, but a sym. triangle is the same every time, all you need to know is the direction of the preceding trend, if it was up, then it's a bullish price pattern (according to Technical Analysis). The misidentification of what the triangle actually is, is the first mistake, but traders see a triangle and, "A triangle's a triangle is a triangle. What grabbed my attention was the distribution already present, I knew all we had to do was look for a head fake move that lined up with out market analysis.

B) The triangle breaks out to a smaller consolidation triangle and 3C gets worse, this was obviously going to breakout to the upside and the market was close, but not quite there.

C) Is the Breakout that we shorted, a dollar or so off the highs for most of us and again 3C looked even worse so we were able to confirm the breakouts that technical traders were chasing and buying were distribution, we just had to wait, we actually phased in to that position in 2-3 parts because there was a rectangle range forming and we weren't sure if there would be a head fake above that which there wasn't.

D) Is the first place we or I covered half of the position which was already at a 30% profit with no leverage.

E) Is where I covered the second half after adding a little at higher prices.

F) Was a bull flag that had negative divergences that we shorted and made a quick buck there too.

The magic of the trade wasn't the gain, it was how smoothly everything went, understanding exactly what traders would see and how Wall St. would react and being able to use those "Concepts" to our advantage.

BIDU now... Psychologically I already know that I have to be careful because the last few trades in BIDU just came together so perfectly and it was such an easy trade, I don't want to let my guard down even a little because I had good experiences in the past.

 We've had plenty of buy/sell signals and we just got past a sell signal

This negative divergence to the far right on a 4 hour chart is something I haven't seen in BIDU before.

 The same with this 2 hour chart, BIDU is in a lot worse shape than it was before.

 The 30 min chart tells me were are already close enough to the major damage, what we need to to get lucky with a bounce/head fake move.

Like the original trade in BIDU, we already know that any head fake move or bounce is going to fail because of the depth of distribution, that makes it a lot easier to short in to price strength when you know this stock is not recovering from this damage any time soon.

The 10 min chart shows us something that looks like a bounce is setting up, but we don't have much more than that at this time so it's a matter of watching it and looking for that opening as well as setting some alerts.


I'd like to get a shot at BIDU in the $140 area, the higher the better, but at least above $138 would be a decent entry, you may want to keep BIDU on your alerts.


MCP Update

Last Friday I posted about GOOG and MCP for trades, each a little different, here's the post. And Here's the link to the positions, MCP was a September $6 call. GOOG was up Monday 30+%, but because of the longer term nature of the divergences, I decided to hold GOOG a bit longer, MCP hasn't fired yet, but it really looked good as I was skimming through charts late in the day.

 Like URRE, MCP is a long position that I believe has legs of its own, the market will always exert influence over all stocks, but I think MCP could be one of the few that can buck the market's primary trend, like URRE.

Above the 4 hour chart shows 3C in line with the downtrend which is something I like to see, confirmation, 3C should only diverge when there's something going on, as MCP makes some capitulation like moved, 3C starts to go positive and builds a large 9 month base.


The 1 min chart's trend has tracked price, then went negative and price responded shortly after, now has gone positive, the 16th is last Friday when the position was entered so it has added nothing but base since then.

The 2 min chart just kind of drives the point home as this has been a position I've been patiently waiting to get involved with again.

The 15 min chart is really the magic here, not only did it really start making headway last Thursday, but the length of the leading divergence is well above anything even at much higher prices, I find it to be very impressive and would have entered the trade again today.

It's not often we get a 30 min chart like this either, that's nearly pure accumulation.

If you are in MCP, I'm happy for you, I think you'll do very well. If you're not, I would urge you to take a closer look at the position, although I have a call, this could easily be an equity long, perhaps even a core long position.

MCP Looks Like it will move up SOON

I was wondering how long this would take

There's something definitely in the works, the distribution in the market and futures has been strong and evident for quite some time, I don't know why, but I had a git feeling there would be an afternoon slamfest, but I suspected it start around 3:30, this is a bit later than that and I suspect there's a reason, perhaps to create some panic and loosen up the grip on some shares?

Es (SPX Futures) 1 min

AAPL Update

This is just because so many people are asking for it.

I can see a few potential scenarios that open up trades here, but I just see the potential now.

 The intraday charts were showing weakness yesterday in AAPL and the Q's I pointed this out several times and at the EOD in how much each had given up from intraday highs.

2 min shows the same.

2 min trend

5 min shows some weakness, this has been popping back and forth, if anything on the short side is going to come of AAPL for more than a quick trade, it needs to start here.

AAPL 5 min trend, you can see the recent changes from the chart above.

10 min with a relative negative, one of the weakest divergences, but the fact it follows that 5 min is interesting, although not actionable.

I'm not sure whether to make much of this 30 min beyond consolidation, I guess it depends on the 5-15 min.

Right now the 4 hour chart shows a solid trend and base in place which is at a stage 2 breakout.

AAPL should be traded from the long side for anything more than a quick trade, there may be some short opportunities like yesterday, but I think you really need to have signals that are screaming, not just negative divgerences.

Until then, I'd assume AAPL continues to trend up to lateral, I suspect it is in transition to turning in to a MSFT, both charts as I have mentioned dozens of times over the last year look almost exactly the same and MSFT lost the growth power after declaring a dividend.

XLF Sept. $20 Call Update

Financials have looked similar to the SPX since late last week, really not much has changed.

I'll show you the charts, my ideas for playing this and ideas that I won't use, but still like.

 1 min went positive at yesterday's lows, in fact quite a bit before as this Call position was opened yesterday around 2 p.m.

 The 1-3 min charts on the SPY and most other averages are negative for a pullback, they are positive on inverse trading instruments like VXX/UVXY, FAZ, etc.

I'd consider playing XLF $20 puts here, but I think it's very speculative and you need to be on top of it. Otherwise a quick long trade in FAZ (3x short financials) would also work assuming we haven't had a big move b the time this gets out..


 The 5 min XLF trend showing confirmation on the rally to the far left, distribution at top #1 and heavier distribution at top #2 as we's expect to see, but look at the change in trend recently.

 This is a close up of the 5 min chart above, it remains quite positive.

This is the 15 min chart, I've rarely seen a 15 min chart with such a quick and large lightening bolt divergence in virtually a day, the size is enormous, so it seems like there was buying in to higher prices so whatever set this off must be important and all I can think of is the minutes.

However, I want to use that upside strength to short financials. This 4 hour chart is everywhere, this is like the F_E_D, don't fight it.

You could use FAS (3x long Financials) for a bounce, I'd prefer to see a pullback near the $19.75-$19.80 range (XLF) before entering any more long.

You can use FAZ 3x short Financials as the bounce ends and you need a quick short on Financials although we'll be covering GS, JPM and others.

***Market Update

I'm thinking right now that the market behavior and cycles are all the same, just volatility is about to go through the roof, things that seemed like real time are going to seem like a blur.

Because of the number of charts, you'll understand why I didn't include more assets, but they;ere all looking roughly the same except for the Q's which still look like they are lagging/weak.

I'm using only 2 (really 3 ) assets, SPY, VXX which trades opposite the SPY as a flight to protection and VIX futures which VXX are based on (also trades opposite the SPY).

 SPY 2 min (but 1, 2, 3 min, ) look like the SPY is going to see a quick retrace of today's or part of today's gains.

VXX in the same timeframe all of the sudden comes up with a positive divegrence at the same time and a nice flat price range.

What was it, 24 hours ahead of schedule that the F_E_D leaked the Minutes to Wall St.?

This is the 1 min VIX Futures, also showing a VERY short term positive divergence.

So far all of this is in line with a market pullback which I have expected to create a bigger foot print to sustain a stronger bounce move and create more accumulation, but in a rare show today, it looks like there was even accumulation in to higher prices which would suggest the need to act quickly, as in "If you got the F_E_D minutes a day before they are marked for release.

 SPY 10 min is adding a strong leading positive divergence today, that couldn't happen if there wasn't some buying in to higher prices which is not seen often, I can't remember the last time.


 The 15 min chart looks even better.I can't imagine we have a positive like this and only get today's move out of it.

VXX in the 10 min timeframe looks the exact opposite of the SPY (as it should) suggesting a decent pullback.

However, just like the SPY positive stops dead at 30 minutes, the VXX 30 minute is hugely positive.

This all looks very much like a quick pullback in the market, a stronger base, a strong bounce that is sharp, but quick and a renewed downside move with even more power.

The VIX Futures 15 min looks amazing, I didn't expect to see a negative divergence like this here, but like VXX, there it is, this suggests the market DOES in fact bounce.

However at 1 day we have the largest positive divergence in a year and a half and that's because that's all I can see, meaning the market, is in serious trouble after this.

So how do we want to use this?

Try to ride a bounce? Wait for a bounce and short AMZN and others in to some price strength? It depends on you, I'd like to see some of our near term expectations to fill out.


VXX / UVXY Looking even Better for a trade

Likely a short term trade, but long.

 VXX 2 min

VXX 3 min

This is as far as the divergence goes.

ES 1 min, looks like it will come down (SPY) sharply (hopefully to our lower range), but in the mean time, although VERY speculative, this looks like a great quick trade.

Tough Nut to Crack

I'm struggling with two concepts, the first is what I see with my own eyes such as (none of these were cherry picked, just pulled them straight from the watchlist in the order they were in)...

 XLF Financials with a VERY sharp 15 min leading positive divergence, I'd like to see price come down and form a larger footprint for the base and a stronger divergence although it's already pretty amazingly strong.

 However move over 1 more timeframe longer to 30 min and the very sharp nature of the 15 min's positive divergence seems to make sense, almost like a sharp upside move, which bear market rallies are known for), leading in to a cataclysmic collapse.

That's the way we have roughly envisioned it and planned on playing it.

 FAS 2 x long Financials 10 min with a VERY strong 1-day leading positive divergence, very impressive, but also very sharp.

 FAZ 3x SHORT Financials with the same 10 min chart, but a mirror opposite, very sharp negative divergence confirming the Financials charts above.

 However jump to FAZ 60 min and tell me, if you had to make a purchase right now and not touch it for 6 months, would this not be near the top of your list?

 SPY 10 min large relative divergence to a sharp 10 min leading positive today so far.

 TF 60 min Russell 2000 Futures are now positive out to 60 min, but again, the divergence is unusual in how sharp it is.

 ES 30 min finally catching up and positive at 30 mins, leading today in fact.


NQ 15 min is actually positive on 30 min charts, but this 15 min really shows the strength that built up quickly and what looks like a pretty solid base/footprint.

 VIX Futures seeing a negative divergence, not large, but a definitive change in short term character, VIX moves opposite the market.

 AMZN 15 min positive

GS 5 min positive...

I could keep going.

On the other side, why would a bounce start to form just in front of the much feared F_E_D minutes released tomorrow?
2 pm tomorrow.

We of course almost always have the F_E_D knee-jerk reaction, but these are the minutes from the last meeting where I noted a distinct, yet subtle change of tone/words and if the last minutes were damaging, I imagine these would be worse.

Unless, there's no September Taper or the amount is much less than the market imagined as the market has a September Taper priced in. Perhaps there's something else, but that would suggest that Wall Street knows what's in the minutes, who could they know that? Well the F_E_D themselves sent out 154 emails containing the minutes to some of the largest institutions and private equity firms, NONE OF WHICH REPORTED THE 24 HOUR EARLY RELEASE, plus ...

Since when does the F_E_D cater to Wall Street by sending them an email with the minutes when these firms have algo's that can scan and trade off the release faster than you can blink your eye? The only reason is to give someone a head's up more than 24 hours before the official release, think about it, a private email list, why would the firms even need it if it the minutes were released all at the same time? They could get the information off CNBC faster than opening the email and their computers do it in microseconds.

How do I get on that list, THAT'S THE TRUTH OF WALL STREET IN ACTION, EVEN THE F_E_D GOT CAUGHT WITH THEIR HAND PASSING OUT COOKIES FROM THE COOKIE JAR.

The question remains, why build a positive divergence and a sharp one that may indicate a fast move or may indicate they just needed to get it done quickly? I think the way today end and overnight trades will tell us a lot. I just wanted to let you know what I'm wrestling with in looking at hundreds of charts.