Thursday, January 27, 2011

Time for Another Check of Market Breadth...

Market Breath is defined as: "The fraction of the overall market that is participating in the market's up or down move. Looking at this parameter allows investors to reduce the impact of the large cap stocks which influence market indices the most, and instead examine price trends of a diverse range of stocks. This parameter is important in the context of technical analysis, as a measure of market sentiment."


Because market averages are weighted differently, looking at the average alone only gives a very narrow view of the market of stocks, which is more relevant to the economy when using the market as a leading indicator for economic health. Because the averages are so easily manipulated by weighting factors, a study of market breadth can reveal the true underlying trend, sentiment and even reversals. There's no way to properly judge the market's true vitality without studying market breadth indicators. Telechart and other Worden products have a wide range of market indicators that are second to none. If you are looking for a platform for charting, I highly suggest a Worden product. Click the links for more information.

All indicators will be in green, the comparison to the market average will be in red. For most comparisons, the NYSE universe of stocks is used, unless specifically noted otherwise.

 % of Stocks Above Their 40 Day Moving Average . As you can see, while the red NYSE gained since October 13, the % of stocks which trade above their 40 day moving average has fallen significantly. While the S&P gained 10.29% since October 13th at the indicator's high, the indicator itself has fallen by nearly 21%. In a healthy market this indicator should keep pace or out pace price gain, not slide with far fewer stocks able to trade above their own 40 day moving averages.


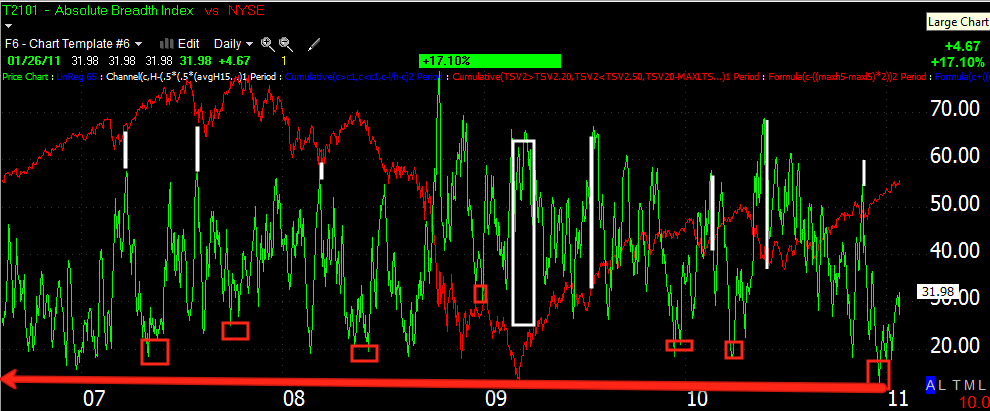
 % of Stocks Trading 1 Channel (Standard Deviation) Above Their 40 Day Average. As mentioned above, the indicators should keep pace with price. At the green arrow we see the indicator making higher highs with price, at the red arrow we see a negative divergence in this breadth indicator. Trading 1 channel above their 40 day average indicates a very strong stock. From the October 13th peak, the indicator has fallen 34.7% while the S&P has gained 10.29%. Again, this is another indication that market participation into higher index prices is falling way off and more stocks are falling then previously. The trend remains ugly.


 % of Stocks Trading 1 Channel (Standard Deviation) Above their 200 Day Moving Average.  Obviously the 200 day moving average is a longer term average and shows the longer term trend. Stocks are not as fast to fall below this average as the shorter duration averages. Still we see another negative divergence with the market rising and the indicator falling. The indicator fell from 11/05/2010 -11.85% as the market gained 6%.

 % of Stocks Trading 2 Channels (2 Standard Deviations) Above Their 40 Day Moving Average. Note the higher highs at the green arrow and the current negative divergence at the red arrow. These are likely to be stocks that have trended up very well. From November 5th at the indicators high it has fallen an amazing 55% while the market has gained only 6%. 


 % of Stocks Trading 2 Channels (2 Standard Deviations) Above Their 200 Day Moving Average. As you can see, confirmation until November ended and turned into a negative divergence.  From November 5th, the indicator has fallen 33.57% while the S&P has gained 6%.

 Absolute Breadth Index. As defined by Investopedia, "A market indicator used to determine volatility levels in the market without factoring in price direction. It is calculated by taking the absolute value of the difference between the number of advancing issues and the number of declining issues. Typically, large numbers suggest volatility is increasing, which is likely to cause significant changes in stock prices in the coming weeks." 


As you can see, spikes (in white) in the indicator have led to advances in the NYSE, while low readings have often signaled tops. Recently we made  new multi-year low.


 McClellan Oscillator This indicator is most useful when looking for divergences, similar to MACD. I've pointed out several negative divergences in orange and a positive divergence in white. This is an example showing the 2007-2008 top in the market. Note the negative divergences into all the major tops of the top pattern.


 Here is the current McClellan Oscillator. There was a powerful 2009 divergence at the market lows and several positive divergences in white after market pullbacks. The orange arrows indicate negative divergences that all pulled back. Note how big the current divergence is and how the Oscillator is nearly below zero.

 NASDAQ Composite Advance / Decline Line. Since April 22nd 2010, the A/D line has fallen 10.34%, the Composite has gained 9.38%

Finally the Russell 2000 Advance Decline Line. From April 26, 2010 until now, there has been 0% movement, at the same time the Russell 2k has gained 7.62%.

It should be obvious now from looking at these breadth charts that the market lack internal vitality, that more stocks are trending down as the easily manipulated averages continue to grind higher. Intellectually, there's a falsehood to the averages' standing as it is not supported by the same majority of stocks that it was at much lower levels. This is a very dangerous market and you should now be aware that there are many investment opportunities on the short side and while it may seem you are trading against the trend, you can see above the overall market is not trending in a healthy direction.

MSFT Beats, AMZN Misses

Both in spectacular fashion and while I don't put too much into after hour trading, it's interesting that both are down, MSFT marginally and AMZN by about 9+%.


Tomorrow we have the big rally in Egypt with Mohammad El-Baradei leading the popular protest for the people. Again, as I mentioned this morning is the military. Every modern leader of Egypt has come from high rankings in the military. As you may know, Hosni Mubarak is getting on in the years and is having health difficulties which has put the succession process into motion before the protests broke out with the Tunisian revolution perhaps being a spark in Egypt.


Egypt is the biggest Arab country by population and is the bedrock of US foreign policy in the Arab world and arguably one of our closest allies. What comes of this is the type of unknown that the market doesn't like.


Also we have advanced GDP coming out tomorrow. Between AMZN, a possible "Sell the news" in MSFT as we saw in AAPL, the disappointing jobless data today, the Egyptian and Albanian situations, we could see selling toward the close no matter what direction GDP goes in as traders may be reluctant to hold anything over a weekend like this.


Many seem to think that QE3 is a foregone conclusion. As I wrote last night, the Paul family is a wildcard that could upset the entire apple cart at the Federal Reserve. Transparency is not something the Fed likes, a full audit of the Fed without any protection from the Dodd-Frank reforms may produce some very provocative stories that may finally force the American population to come to terms with exactly what the Fed is and how their best efforts have led to little more then a melt up in the equities market-and what goes up, will come down, especially when it's built on a house of cards.


Major transitional events are the ones that drive people from the market, but they're exactly the events that smart investors make their fortunes on. A quick read of famous traders and you'll find they didn't make their money riding the market up long-everyone else did, they made their money when things got turbulent and they were short-they made the money that all other lost. 


I can not pretend to know the date of a black swan event, but you should prepare yourself to embrace it, not run from it. 


Sorry, that's just some random thoughts I wanted to share with you. Until then, we keep looking for the opportunities now and keep that risk management air tight.

Here's the Theory

This is just a ild guess threory that I floated when  saw accumulation building for a bounce up in the averages earlier in the week. I thought, "If GDP is going to be bad, then this week leading up to Friday would be the time to set up a bounce and to set any shorts" because if there's one thing that seems to be clear after looking at charts for more then a decade, these reports are often leaked. You can see by the JPM action -there's a lot of quid-pro-quo .

Take a look at the charts

 DIA 1 min

 DIA 15 m

 IWM 1 min


 IWM 15

 QQQQ 1 min


 QQQQ 30 min

 SPY 1 min


SPY 30

If you look at the short term some are starting to turn, the longer term showed the accumulation and now they are turning. It's almost the perfect set up if tomorrow were to be a down day. Still just a theory.

GLD Update

This could also effect much of the commodity complex. I was looking at these charts trying to decide if we just saw a 1 day pullback, in which case I'd issue some tight stop trades or whether there's more to go on the bounce that started yesterday as I expected. Here's a way we may find our answer and it's another tool for your box.

Here's GLD.
If you look at today in yellow, we have a very negative candle with almost no lower wick and volume is increasing. This can be a panic sell or it can be a form of capitulation for a bounce higher. Now start from the left of the chart and work to the right. Note all the candles in white have longer lower wicks, some are even hammers, also note they have increased volume and they were reversal candles to the upside. the one in red that wasn't didn't have a very long lower wick. So the probabilities are if GLD rallies into th afternoon, we'll see more upside on the bounce. That should hold for silver and various other commodities showing the same type of behavior today. This is one of the more reliable ways to determine an oversold condition.

Market Update and Market Education

Hopefully this post will give you both. First we know the Primary dealers saw a poor acceptance of their issues. There's the idea that the Primary Dealers enter trades in anticipation of POMO as well or in anticipation of free money. A poor showing at the POMO can cause them to pull those trades, sometimes when we see positive divergences into falling or lateral price, it's possible we are seeing such pre-positioning. In any case, the market fell after the sub/accepted ration was announced. Here's a chart I grabbed from Zero Hedge showing JPM bidding up the Russell 2k-so now you know who else is in the loop of back scratchers.

Note the time that buying began-at least on this chart, there may have been significant trades not shown. Also look who the buyer was at the far right under "Broker". Those are some pretty big blocks.

Now lets look at the charts of the DIA, SPY and QQQQ

 Of the 3, the DIA is the only one showing a positive divergence into the 11:30-12:00 lows, this in my estimation has more to do with keeping the Dow above $12,000 as the Congress-woman so notably mentioned yesterday during the hearing on TARP/HAMP. As if things in the US are better because the Dow is over 12k-this is right out of the Fed's talking points.

 While the Q's have been doing well today, I'm guessing NFLX earnings had something to do with that (up 15% today) the fact is, there was no positive divergence at the lows, just confirmation of the price trend.

Finally the SPY, again, no positive divergence, just near perfect confirmation of the price trend. Note how much 3C fell in all 3 in keeping with price.

Now, the Russell 2k's IWM
The IWM fell, 3C went higher, this is a positive divergence and that buying by JPM was most certainly accounting for it. As I've said before the Fed has a fascination or obsession with the Russell which I can understand as it is one of the broader measures of US equities.

No conspiracy theories here, you just saw it for yourself.

More about POMO

Well we know that POMO is a scheme in which the Treasury issues debt, there's virtually no foreign interest in our debt anymore (read China) so the Primary Dealers have obviously worked out a deal with the Federal Reserve which will buy the debt bought by the PDs at an obscenely high mark-up and the Fed just prints money to do that. In return for an obscene amount of risk free money, the Primary Dealers such as Goldman Sachs, bid up the market to keep this infantile notion of a wealth effect going. Yes, the Fed thinks if the stock market is higher, people will be more comfortable spending money they don't have-if they even have a job. It' one of the most ridiculous notions ever, so much so that it is obviously a cover for the banks to make more money via their trading desks and an attempt to slow the pace of domestic equity fund outflows so 1000 mutual funds don't crash and burn along with hundreds of hedge funds.

Well it's been tracked fairly extensively and found that a high submitted to accepted ratio of each operation tends to keep the PDs from sending their free money into the market. Today after the conclusion of the POMO, we saw no positive divergences in the market as we have seen in prior days. Take a look

In fact we have no divergences except the recent negative. The horizontal line shows what the market did right at 11 a.m. you know why it went down? Because results of the operations are announced and the submitted to accepted ratio was high (5.8x), traders in the know, knew that the PD's wouldn't be throwing their free money at the market today. The median is about 4.1x what the dealers submit compared to what is accepted by the Fed. A ratio coming in below 4x you will most likely see the surge in stocks at 11 a.m. and probably  green close. Even if this were not what was happening, enough traders are trading this formula to make it a self-fulfilling prophecy.

Just put that bit of knowledge in your trading tool box.

JAN. TRADE LIST IS UPDATED

I've added some current stops on the shipping trades and some recent trades. I have some more to do, but it'll have to wait until after market. If you need updates, email me.

Returning to the Shippers.

On January 5th, I added 3 companies, all shippers to the short list, HERE'S THE ARTICLE  . The companies included DSX, GNK and NMM. This was based on the normally very volatile Baltic Dry Index, which you can always look up from Trade-Guild.net or this link, showing a quite smooth a direct trend down. Now a lot of this has been blamed on an oversupply of ships ordered years ago as they take time to build, more supply lowers price. However that doesn't account for it all. Economic activity certainly accounts for much of the dip in shipping prices and now with regime change coming about in Egypt with the wild card being the military (who is in Washington right now supposedly giving assurances that they will back the successor to Hosni Mubarak and not exploit the situation to reestablish the military's lost standing) we now have grounds for concern over the control of the Suez and its possible effect on shipping. There's been rumors that Mubarak's son has already fled the country, some strange statements out of Saudi Arabia and a vocal hillary Clinton. Obviously the US and Israel are very concerned with what shape Egypt, as the largest middle eastern country transitions to a new political faction with so many splinter groups and possibly the army all looking out for their best interests. The US badly misjudged the Lebanon situation which gave Syria an iron grip over Lebanon, could the same happen with Egypt?


Here's our picks and how they've fared since January 6th.


 DRY Index-Shipping Prices for Dry Goods...


 DSX a near perfect entry... nearly down 7%


 GNK a perfect entry -23.63%


I had this to say about NMM, "NMM is showing heavy daily distribution in this wedge, the breakouts from wedges can be volatile, so even though I like the trade in this area, I placed the stop up a bit higher to account for that volatility."


As I suspected, there would be a false breakout and that's what we see here. Lesson to be learned here is these common technical patterns nearly always see a false break before they move in the implied direction.

NMM is still in good position for a trade here. GNK really needs a bounce to better it's position and R:R ratio. DSX is not in bad position, although I might phase into this one.

Here are the updated stops for the trades:
 The box is the trending trade stop, the line is the stop if you wish to hold profits and reenter after a potential bounce. Here's DSX which is quite volatile.

 GNK

NMM

I'll be looking at some other opportunities, if you have a chart you'd like analysis on, just email me as usual.

Just Trying to Catch Up

There's a lot going on in the world today and recently. The Egyptian Crisis threatens to block the Suez Canal as reports are coming in that the police/military are refusing to crack down on protestors and the police station there at Suez has been taken over. There's about to be another round of violence in Europe, specifically Albania where 3 were killed in last week's protest, another protest to commemorate their deaths is already in the works.

Here at home Jobless claims hit an amazingly high print (don't be surprised if that's the reason we saw such a week 3C showing in the market yesterday-I even said yesterday that it may be coming from a surprise to come). And Durables came in showing strong signs of inflation. I'm looking forward to the U6 unemployment rate from the BLS.

There's food riots breaking out everywhere in the world it seems. The Baltic Dry Index is falling apart, Japan was downgraded.... And the market, well it just keep whistling past the graveyard.

There will be some updates soon, I'm trying to sort out as much information as possible. I'm not trying to be an alarmist, but certain events will effect the market, trying to sort out which ones and how/where is important.

Anyone with a subscription to Stratfor

I'd like to hear from you and what they have to say about the Suez Canal

TIA