Monday, July 29, 2013

MCP Long Call Position

As I said earlier, I'm not thrilled about going long much at this point, however MCP has been a ;long position we've been interested in and have traded several times, but even here it looks like if this sets up it will be a short term trade, thus the reason for the ;leverage, it does not look like the ;longer term continuation of the next leg higher.

 The last long equity position in MCP was closed Monday, July 22nd for a +14.25% gain with no leverage, here's the P/L "After Action" report.

June 21st was the last significant long call for MCP, "For a new position or even an add to... MCP" which should sound familiar to you, "June 21st", in MCP's case it was the day just before the final low and MCP's run higher of nearly 50%.

I do think MCP will make for a nice, trending long position, but I don't think the pullback is sufficient or in the right p;lace for that trade yet. MCP is still in a stage 1 base, unlike one of our other longer term favorite longs, URRE that broke out to stage 2 "Mark Up" and closed up another +28% today for approximately a +113% 7-day gain, but most importantly it has shown good follow through on a stage 2 breakout.

I think MCP will make it to a similar stage two breakout and even in URRE's case, this is VERY early in stage 2, it should have significant upside ahead of it, just like MCP.

However, once again I DO NOT see this as a longer position trade in MCP and will likely approach it with leverage (calls).

 This isn't a textbook, "Bullish descending wedge", the volume is not correct, but this is how bullish descending wedges have been behaving over the last several years and bearish ascending wedges have been acting the mirror opposite which is not at all like what Technical Analysis textbooks will tell you.

A wedge like this "Should" break out to the upside once the apex (point) is reached, we see a number of different head fakes, sometimes a break below the apex as technical traders will see that as a failed move and they are taught, "If a price pattern fails, reverse your position", in this case, go short. Then we get what would be a "Crazy Ivan" with a head fake breakout to the upside which knocks out the shorts and brings in new longs. At that point we typically get a move back down below the apex knocking out the new longs as well, they are very nasty price patterns, but because technical traders are so predictable, it's so easy to take advantage of them.

The real behavior we have seen time after time in either variation of wedge is after the head fake moves are over we get a base in this case and a top in the case of a bearish ascending wedge, rather than an immediate breakout in the correct direction, we see a longer term base with a breakout eventually in the correct direction and that's the base MCP has been working on.


 This is the long term daily chart, also one of the strongest 3C divergences we see. Note the confirmation of 3C and price on the downside move and then the leading positive divergence during the base, that's a large divergence for a daily chart.

 While the 15 min chart is interesting and looks decent, it's only the last few days I'm interested in, charts beyond 15 minutes show that MCP is not ready for the next significant leg to the upside which should be a stage 2 breakout.

 The 10 min chart and again, I'm only interested in the most recent day or two of activity, this is also why I'd be using a call rather than an equity long, the divergence just isn't squared away for a longer term position.


 The 5 min chart is the perfect time frame for today's leading positive divergence, other timeframes confirm, but this is about what I'd expect to see all things considered.

 From the shortest chart, the 1 min is leading positive today

As is the 2 min which shows migration, also the break below the red trendline hit stops as you can see by volume making that a suitable head fake move as the stops were accumulated, a quick way for smart money to pick up quite a few shares on the cheap, quickly and without anyone paying much attention as someone has to take the other side of the trade.

The 3 min chart is also leading positive, so we have migration of a positive divergence as we should, we have several decent timeframes out to 15 minutes, a head fake move and what most technical traders would consider a bear flag.

The ideal entry would be a break tomorrow below the bear flag with accumulation, a call bought in that area would be ideal in my view, the downside momentum creates another head fake, it reduces the premium on the call and sets up a high probability/low risk position.

Again, I do not consider this to be the start of the next ;leg up in MCP, just a short term move, which I believe also says something about market expectations if we do indeed get an upside move tomorrow as many charts from tonight's "Daily Wrap" indicate.


Daily Wrap

After looking at the market last night with fresh eyes, the feeling I got was there were several intraday lows on Thursday or Friday (depending on the average) that saw a pretty decent positive divergence, more importantly HYG (High Yield Corp. Credit saw a positive divergence and we know if HYG runs up it can take the entire market with it.

At the same time, any bit of strength whether it be a green close like the Russell 2000's +0.99% close Thursday or a recovery off intraday lows like the Dow's 151 point drop from Thursday's close on  Friday to intraday lows that recovered to a 2 point / +0.02% gain, it seemed like no matter the scenario, whether daily price strength like the IWM on Thursday or the Dow's intraday price strength in the recovery of about 150 points to close just barely green, underlying trade in any scenario where there was some form of price strength saw negative, distribution signals.

As I said, the positive divergences at intraday lows, whether Thursday or Friday seem to have given the market a few days which is interesting as it coincides with the F_O_M_C meeting and policy statement this week (Tuesday and Wednesday) as well as GDP this Wednesday at 8:30 a.m. which will include annual revisions. Furthermore we Non-Farm Payrolls Friday morning with a whole bevy of other macro economic reports out this week including Chicago PMI, ISM Manufacturing, as well as some other odds and ends.

We found out late in the trading day today that the Treasury (as expected) sees a 30% decrease in annual funding needs. Whether you think the F_E_D may be considering a taper or early end to QE because of the cost/benefit analysis at this point, the difficulty in exiting policy and diminishing returns, the F_E_D sucking up quality collateral of which there is about to be a bunch less according to Treasury forecasts, or whatever reason, the fact is banks have seen yields rise and the value of "Unrealized Gains" in their AFS portfolios (Assets held For Sale / Treasuries), which are assets that are not meant to be held to maturity, nor are they assets held for trading, but somewhere in the middle, decline to unrealized losses. 

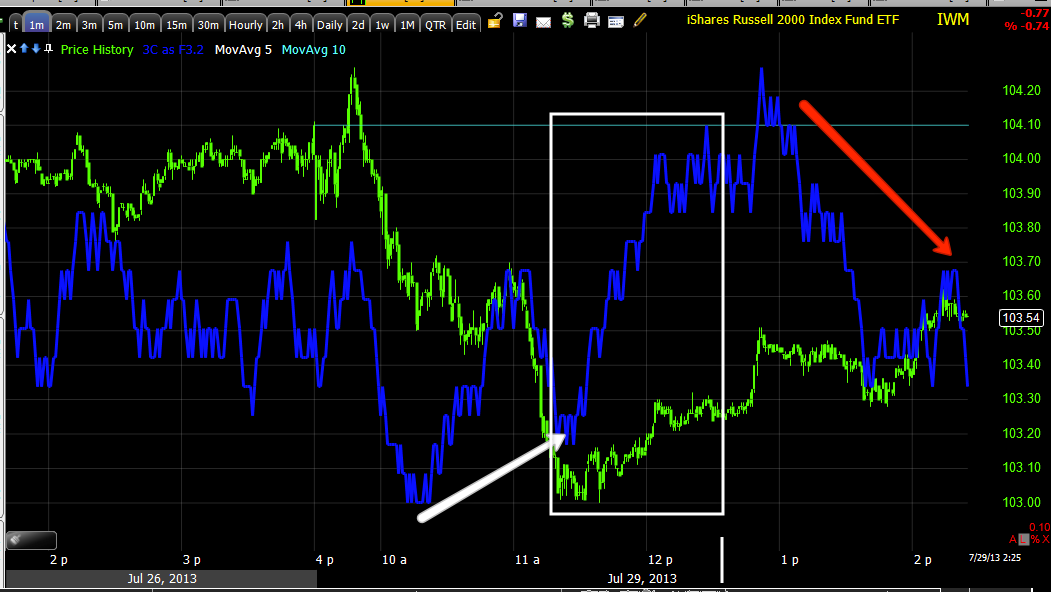
With the Treasury projection today of approximately 30% less issuance, there's an even greater reason now for the F_E_D / F_O_M_C to taper or cut short QE. Some say the release of this report caused the market to trade ugly at the EOD, but the fact is we were already seeing that well before the report was released, as in this post re: the IWM... "Distribution in to any strength", unless there was an early leak.

Here's a generalized look at the market scenario using the SPY as an example.

 This is the positive divergence on a 3 min chart in to the 11 a.m. lows of Friday as well as a current slight leading positive divergence.

This isn't a significant divergence by any means, but it's enough to make a market move higher over a short period, especially if HYG helps out.

 The strength of the divergence from Friday did not make it to the 5 min 3C chart which is generally considered the first or earliest timeframe of significant institutional activity. In fact the 5 min is still in a leading negative divergence.


 The big picture 2 hour chart in the SPY has a huge and very sharp leading negative divergence and at a slight new head fake high as would be the expectation and as was our expectation for this move. The 24th is highlighted, but it was the 21st of June when we saw the unmistakable signs of a positive divergence ready to reverse price to the upside as noted already.

The interpretation of these charts would be the big picture or large trend is showing significant weakness that the SPX will almost definitely not be able to recover from unless something amazing like a new round of QE were announced. The positive divergence in to Friday's lows give the market the ability to hang on, if not make some upside gains, but the divergence wasn't big enough (5 min is negative) to do much more than that.

As we have seen through Thursday, Friday and today, any bit of strength seems to be used to sell or short in to, not by retail, but smart money.

This is the kind of market atmosphere in which (as I said last week before I left for vacation when I said, "Stay on course") the highest probability trades are to short in to price strength and underlying weakness. There are very few long positions I would consider and I'd usually take even short term longs in a scenario like this, I think it's just too dangerous at this point.

As for some more familiar indicators applied to the SPY...

In yellow the indicators are showing positive readings in to the June 21st/22nd lows that 3C caught with beautiful accuracy. In red these same indicators are going negative, I use these as momentum indications on every timeframe, but they are significant on a 60 min like this chart. I have Momentum at the top, Wilder's RSI (period 6) below that, MACD Histogram (periods 26, 52, 9) below that and finally Stochastics (period 50) which I use to look for embedded signals and divergences.

As far as High Yield Corporate Credit (HYG) goes, as it is one of the most significant assets that can help move the market on a short term/arbitrage basis, and one of the more significant finds from last night, there's no doubt large "risk on" positions have been abandoned in HYG, there seem to only be smaller trading positions that can be exited quickly.

 A slightly longer term 1 min chart of HYG vs the SPX (always green unless otherwise noted) shows HYG positively  leading the SPX in white, negatively leading in red and in yellow it has formed a range where we often see institutional activity.

Intraday (1 min today) HYG is pretty close to in line with the SPX, however JUNK (High Yield) Credit which normally trades almost identical to HYG, but is not an arbitrage asset...

looks a lot worse intraday vs the SPX today.

 Here HYG on a 30 min chart shows the 3C positive divergence in to June 21st that leads the SPX/market higher and we see strong distribution that pulls HYG down (which is far from over, but seeing something more like a typical market movement/correction).

Here HYG's 10 min chart shows more detail and an obvious/strong leading negative divergence in to recent highs, HYG losing ground typically leads the market as credit traders are much more sophisticated than equity trades, hence the say, "Credit leads, stocks follow".

 HYG's 3 min chart has much more detail, a strong leading negative divegrence to the left and a strong (for a 3 min chart) leading positive divergence on the right during that flat range as is often the case.

Intraday it looked like HYG was going to lose some ground and fall apart a bit, but it turned things around in the late afternoon and produced a short term positive divergence, I WOULD NOT BE SURPRISED IF HYG MOVED UP HIGHER TOMORROW BASED ON THIS 1 MIN CHART, this should take the market up or at least give it some support.

High Yield Credit...
 HY Credit or "Risk on" credit moved in lock step with the SPX (green) for quite a while, note around April Credit diverges significantly with the SPX to make a new low for 2013 (currently below previous 2013 lows in the first quarter). This is a VERY significant dislocation, one of the largest I've ever seen which should tell you something about the volatility and size of the move coming- "Credit leads, stocks follow"

Intraday HY credit was in line with the SPX at the green arrows, it was underperforming at the red and then showed much better relative strength at the EOD, to me this looks like the market will see some upside tomorrow, at least in the early part of the day.


Other Indications....

Sentiment...
Intraday our institutional sentiment indicators held up well, in fact they support the idea I just floated above re: HYG/market seeing some gains tomorrow, however these must be kept in context, the charts that really matter are below as far as sentiment goes...
 FCT 60 min chart vs the SPX (green) shows sentiment is very negative vs the SPX, this is the worst I have seen since we've been using these.

HIO 60 min is just as bad, actually worse, so the intraday sentiment readings not only should be kept in context, but used as I mentioned above to the best advantage which I believe is shorting any price strength, I can nearly guarantee if we do indeed see any upside strength, it will show much worse negative 3C divergences which will make it easier to time good entries for our positions.

Carry Trades

 This is a daily chart going back to the 2009 lows, it's clear the $AUD as part of a carry trade has been closed out.

The same with the Euro except the Euro also had significant pressure from the ECB as well as banking regulations. Either way, the carry trade is pretty much dead and just about any market breadth indicator can show you that.

In green, "Percentage of all NYSE Stocks Trading Above their 200 Day Moving Average", in red the SPX.  In January the percentage of NYSE stocks > 200-day was 81%, during the peak in May, 71%, during the last peak, 61% and today 58%, this is the 200-day average, as the market moves higher a healthy market would show increasing breadth, not declining. A large part of this in my opinion is the closure of FX carry trades, the equity position must be closed out to close out the carry trade.

Other Arbitrage/Safe Haven assets... TLT (20+ year Treasuries) and VXX (VIX Short Term Futures)...

As I showed last week, my DeMark Inspired indicator gave its second buy signal in the VIX this year, the last one was at the low as the buy signal fired and lifted the VIX.

 The last VIX buy signal on my custom indicator was the low for the VIX and it made a run shortly thereafter. Last week's buy signal in the VIX, thus far has also been the low for the
VIX.

 This is the long term or "Big Picture" view of VXX, first a negative (2 hour) divergence brining VXX down which was seeing confirmation of price/trend on the way down, then a large leading positive divergence. It seems someone has been accumulating significant protection in VIX Futures.

TLT (20+ year Treasuries) is also a form of protection or "Flight to Safety" trade. As you know I've been interested in TLT for a while and have started a core long position in TLT, I'd like to add to it.

TLT shows a negative divergence and when we saw this at the time, I speculated that this was being done to help lift the averages to new highs which did occur, but I think more importantly a large TLT / Treasury position has been quietly accumulated, I think few people know this and this makes for an appealing long. I would prefer to leverage this position, perhaps TBT short, but I don't think that would be an easy one to get and keep borrowed shares for and I don't want to keep rolling calls, but I do think TLT WILL see a significant move HIGHER over the coming months (perhaps year). I wouldn't be surprised if today's Treasury news didn't send TLT higher alone.

As far as sector performance, Transports (IYT) which I have an open Put position in, were down significantly today.  ES/SPX futures saw a -.40% loss, which is the worst loss in a month for ES. As I demonstrated last night, Financials again were among the worst performing along with Energy, the Flight to Safety sectors, Utilities and Staples (again as seen in last night's charts) were among the best sector performers.

As far as my feeling that we have plenty of assets suggesting tomorrow see better market performance, the 1 min $AUD futures do look like they are seeing short term strength, this is very young as far as a signal and very small in terms of length, but if it keeps up, it would help the market tomorrow (remember HYG and other indications like Sentiment intraday as well as others above).

Single Currency $AUD futures seeing a positive 1 min divergence, if this holds up overnight it should help the market on the upside which should open up some opportunities fro us.

The Yen futures aren't as developed, but they are pretty ugly so that would help as well.

The Index futures aren't showing anything special that will last overnight.

As far as tomorrow goes, I think our best bet will be to look at interesting short list shorts for well times entries.

Some of the shorts on my watchlist include GS, GOOG, IYT, AMZN, XLF/FAZ (long), DE, IBM, XOM, COST, NFLX, PCLN, DDD, TJX, COF, HYG, HPQ, FDX, possibly AAPL, XLK (Tech related), JPM, USO, and others.

Some longs include: VXX/UVXY, TLT, MCP, URRE, Certain Inverse/Leveraged ETFs, Precious metals/miners, and numerous other ETFs.

Finally, also looking interesting as far as tomorrow's action is tonight's Nikkei 225 futures...

That's not a large positive divergence, but it is a nice looking one which formed in a flat range.


If anything exciting changes with futures I'll let you know.


QQQ Update

Not that the Q's are a direct correlation to TECS or TECL (Technology Bear 3x leveraged  and Tech Bull  3x leveraged respectively), but the Q's have a large exposure to Technology, so much so in fact that I'd be careful in choosing positions in Tech if you have a position in the NDX/QQQ because of the high degree of correlation. I mentioned TECS because it is a position some of us picked up on July 16th and through the volatility and chop, it's held up well for us, not at a big gain, but it's green because our timing in picking it up was pretty darn good (one day before the recent lows.

This is the timing I'm trying to hold out for to give you the best shot at a successful position, in essence I'm trying to put these ideas out as I see underlying trade moving in to them or said another way, following smart money in the assets they are moving in to at the time they are moving in to them.

This is our entry in to TECS long on 7/16, *note it is just making a head fake move below support which is something I'd say occurs on every timeframe about 80% of the time JUST before a reversal. 

We had 1 day of draw-down in TECS and that's why I strive to get the best timing.

As far as leveraged positions, whether options or 2-3x leveraged ETFs, I view them as different tools for different scenarios. In most cases I don't like to use leverage, but when we have a good signal, but not so great profit potential, then options are a useful tool to take advantage of that signal and allow us enough profit potential to make the position worthwhile or I like them if there's just an outstanding signal.

I actually prefer non-leveraged, Trending trades, however in a new bull or bear market I'll often see a sector that looks good, but until we get a strong bull or bear move, it can be difficult to choose the individual stock that looks to be the best longer term position. Also the initial moves tend to be larger and the added 2-3x leverage is nice to take advantage of that.

I digress, this is actually more about the QQQ, but it's also about entering the position at the best area/time (which is sometimes a compromise).

The IWM started showing some pretty nasty distribution intraday today as I posted around 3 p.m., but that doesn't necessarily mean its the best entry. The topic of a lot of discussion the last week or two has been weighing the best entry vs. micro-managing the entry too much and missing the forest for the trees which is usually not that big of an issue, but when a market starts acting like this one has been, it becomes more of an issue and that's why I'm pointing out intraday action like the IWM and QQQ today.

I'll cover the market a daily wrap, but I thought you should see the Q's.

 This is a 2 min intraday chart, resistance was hit twice today at Friday's close, but the afternoon 3C signal was by far the worst and this tends to be when institutional money is most active.

On the 3 min QQQ intraday chart we can see confirmation, this wasn't a fluke signal, it too saw a leading negative divergence develop quickly in to afternoon trade. This is also called "migration of the divergence", as the divergence gets stronger it migrates across longer timeframes. I wouldn't expect this one to go too much further considering the time of day it formed.

 The 5 min chart (and quite a few charts I've posted recently have highlighted June 21st, that's because that was the day we saw a lot of positive divergences and suspected a move to the upside was starting, the 22nd was the low before that move started.

You can check the archives for June 21st, but here are a couple of market updates that show you what we were seeing.

11:15 a.m. Market Update
Hints From VIX Futures
HYG Hints
Afternoon Market Update

On the chart above I show the gap down from Friday the 19th, there were many posts last week that this gap would be filled. The distribution before that caused the gap was heavy, the distribution filling the gap was even heavier.


Here we see the same on a longer chart as well as the small positive divergence that sent the Q's in to the gap.

However the real information as far as today goes is a continuation of the increasing distribution in to any price strength, even if it is a red close and just off intraday lows. When this kind or action is prevalent in the market, there's always an increased chance that the Hedge Fund herd will split up like we saw in AAPL before it lost 40+% as a few hedgies  (like Dan Loeb) break from the herd and decide, "HE WHO SELLS FIRST, SELLS BEST", which creates a stampede and we get moves like AAPL in which everyone is trying to fit out the same small door all at the same time.


Put DDD (Short) on Your Radar

This one looks like it's setting up. I'll get an updated [post of DDD up tonight

Like the IWM, the Q's just got their dose

GS Trade Update

Earlier today GS saw some intraday accumulation, it was fairly strong for intraday, but still only so much can be accumulated in a day.

The point being, like so many other assets including the major averages (like we saw with the IWM), GS is seeing distribution very early on in the move, it's like the impression I had last night, "Sell in to any kind of strength, even if it's not very strong" meaning even if it's not a green day on the close, as long as it's off the lows of the day.

I'd absolutely consider GS as a core short position and already have a position started there. I'd also consider it as a put position for a quick momentum move, I think it's very close, but I would show just a little more patience, it may be a day, it may be Wednesday, but I would think the market would front run anything they suspect might be coming from the F_E_D/F_O_M_C.

Here's GS a bit later today after it had seen earlier accumulation that I though would send it higher intraday today.

 Earlier intraday accumulation (1 min) which is already seeing distribution on that small move to the upside intraday. I don't think this is heavy enough to open a short or at least not a put position here, a short position is probably something that could be done here if you have enough risk tolerance to deal with some probable drawdown, the problem we are seeing is the "probable draw down"  that we'd normally see on signals like this, is getting to be more and more of a slippery slope.

GS 2 min which was leading positive earlier at the lows, but already seeing some distribution in to higher prices intraday.

The 3 min chart is also seeing it so we have migration from the 1-3 min chart all in half a day.

The larger 5 min relative (but weaker) divergence is still relatively intact, I'd want to see this start falling apart before considering a put option, but with the speed this is already falling apart, it could be there very soon.

Right now HYG and whether it can hold together and whether it can fire to the upside are going to be big "Ifs" for the overall market.

GS's longer term which has kept us from any short trades here kis clearly falling apart and badly off the base in June.

I'd prefer to see GS above $166 for an entry on the short side, not at $166, but above and of course the charts above looking worse.

The point of this post is to show how fast they are deteriorating intraday and I just used GS as an example as you already saw it when it was looking better earlier this morning, many assets look like thing INCLUDING HYG TO SOME EXTENT.

Distribution in to any strength

The same theme I was pointing out last night and today continues, I don't think this is the end of the pre-F_O_M_C move just because of the position HYG is in to fire off to the upside and help, if HYG's  shorter positive fails, the market will be in trouble very fast.

Today the IWM (as shown in one of the last updates, is seeing more distribution than the other averages.
 IWM intraday positive to send it higher to only see higher prices (even intraday and relatively weak ) see distribution, same theme as last week, especially Thursday/Friday.

This makes SRTY (3x short Russell 2000) one of the more attractive inverse leveraged ETFs and it just so happens to have a nice reversal "Process" already in place and fairly well developed.

This is the dichotomy I was discussing last week, between getting the best entry or chancing missing the move, but having to likely sit through some short term draw down, it's becoming a decision that each of us has to make and I don't think there's much time to make it.

SRTY 2 min intraday.
 As the IWM is seeing distribution on the move higher off intraday lows, it's inverse, SRTY is seeing positive 3C accumulation signals.

This is the big picture in SRTY (60 min), a nice rounding bottom, the only thing missing is a head fake move to shakeout stops, but that 60 min leading positive divergence is very hard to look at and say, "I think I'll wait" until timing is perfect.


Market Update

This move we are seeing now is from the same intraday positive divergences I posted around 12:30 in "Quick Market Update"....

This is part of a larger update that started last night with  the odd or out of place HYG positive which is, as you probably know, 1 of 3 SPY arbitrage assets and it moving up is often used as intraday (or longer) SPY manipulation.

The larger market update I'm trying to get up will probably have to wait until after the close because everything is moving so quickly, but I'll try to give you an idea.

First the positives that have been gathering intraday since the post above from 12:30.

 ES (SPX Futures) 1 min - they were leading positive at the time of the above market update around 12:30 today and have remained intraday positive, that's not the same story on the longer 5 min chart.

NQ 1 min (NASDAQ 100 futures) with a large relative positive just at the regular hours (a.m. low) and continuing in to the 12:30 update as a leading positive (intraday) divergence.

TF (Russell 2000 Futures) 1 min. - After seeing heavy distribution just before the open, the intraday low started with a relative positive divergence and by 12:30 it was starting to lead and continues to do so.

As for the averages, the DIA has a larger positive divergence from Friday's 11 a.m. lows, this is very similar to the advanced planning that is seen in HYG (HY Crp. Credit) from last week and I believe all meant as the same move.

IN ESSENCE, THE MARKET MOVE I BELIEVE IS STARTING AND HAS BEEN IN PLAY SINCE LAST WEEK COULD BE DESCRIBED ALMOST EXACTLY THE SAME AS THE GS UPDATE FROM TODAY (AS FAR AS FORWARD LOOKING/NEAR TERM EXPECTATIONS).  In fact, the GS move I expected to the upside has already begun.

 The SPY 1 min intraday positive -I marked the 12:30 area from the post above so you can see the leading positive that was in effect at the time and how it continued to grow.

The IWM I also mentioned as leading positive in the above update and I marked the 12:30 area, however since then the IWM has seen some negative distribution in to higher prices which was the theme of the update last night.

HYG I believe is the final push being held in reserve and I think this is all connected to the F_O_M_C Tuesday/Wednesday meeting and policy statement as well as the Wednesday GDP and the new "Upside GDP revision" that is about to make everything look so much better in the "MOTHER OF ALL BS ADJUSTMENTS" which may sound positive at first, but it just gives the F_E_D that much more wiggle room to abandon QE and save face.

I'll get to the main market update AFTER the close as there's too much, I'm going to focus more right now on positions we can enter and whereabouts.


GS Update and Trade Ideas

GS has been one of more popular stocks and one of the stronger looking of the Financials, I see two probable trades here, one is probably good right about now and that would be an options call.

However, this shorter term bullish position is like a means to an end and that is a larger GS short. GS has been in good shape as far as 3C goes and it's been hard to call out a short trade or put because of that, but that is changing and I think GS will gain some upside and in doing so, set up a low risk, high probability short position.

Here's the update, when I get the larger market update out, I think this too will make sense, at least the longer term short position, but because of the popularity of GS and the  shorter term long/call position, I needed to get this out now.

 GS 1 min intraday going from a slight negative to a leading  positive divergence today. To me this looks like it will fire off sooner than later which also means the base in GS won't be very big, therefore won't support a very large move, but it can be significant for the short period of time and in fact I think it needs to be significant, I think that's the idea, a sentiment change.

However because of the shorter term nature of the position, I'd use calls personally to get some leverage on the profit potential, this also fits very well with the market update and stocks making a move before the F_O_M_C policy announcement Wednesday.

 GS 2 min leading positive divergence today alone.

 GS 5 min leading negative sending it lower and a larger relative positive (although a weaker divergence than a leading divergence, the larger size says something for the position).


Now the longer, more important charts and why I'd want to short GS in to price strength....

 GS 10 min leading negative and very significant. The white area is about where I think GS would need to break out above to shift sentiment, that's also a key area to set up a head fake entry (short) in GS that is low risk and high probability.

I'd set some price alerts.

The larger, more powerful GS 15 min chart shows the initial base to the left, an in line status at the green arrow and a recent leading negative divergence, as I said, GS has not been an attractive short lately, that's starting to change.

The long term (Big picture) 2 hour chart shows the initial negative and now a much faster developing, much more serious leading negative divergence, this tells me there has been VERY strong and recent distribution by institutional money (remember distribution can show up as either selling or short selling as both re selling).

GS intraday has that flat range that we so often see with accumulation and distribution, it looks like today we are seeing short term accumulation to make that move that brings the GS short to us.

I may enter a GS call if I have time and it makes sense, but the stronger trade is letting the short set up come to you.