Thursday, December 13, 2012

AMZN Short Trade Follow Up

Yesterday I brought the AMZN short in the equites Model Portfolio (which is mainly used to track positions) up to a full size position,  I added

" I think AMZN could hit or make a head fake move  above and would be an even better entry, that is at the $256+ area because there is a fairly obvious range or resistance level there, but I don't have time to watch this stock that closely with everything else  I have to do for a model portfolio position."

Then I posted the charts...

There's a possible better entry for AMZN short, but it didn't come today, it may come tomorrow if we get a market move to the upside as several indications today are pointing to (Leading Indicators, Volatility ETFs, Futures divergences, Market Average Divergences, etc.). So there's not much to add to yesterday's charts and explanation, the only changes would be these...

 Daily chart, the red trendline is obvious resistance, traders will be watching that area and are likely to buy AMZN if price can break through that resistance, remember, traders always want to buy confirmation which often lead to them chasing a trade and ultimately starting a trade off from a bad area. If you saw all the charts from yesterday-linked above- then you know AMZN's highest probabilities are for a deep pullback or trend reversal so any breakout is almost certainly going to be a failed breakout and 3C should tell us in real time whether it's being sold or confirmed. We want the move up in yellow, short there and wait for the ride down.

I put small lines below the daily candles, the red lines are an established downtrend believe it or not, the 2 orange lines are noise as they are insignificant to the trend and don't damage it.


 AMZN 3 min saw a relative positive divergence at point A and the same leading positive we saw throughout the market at point "B", this is a short term timeframe, short term moves.

I included the SPY's chart today in the exact same timeframe and it has the same leading positive divergence in the afternoon so AMZN probabilities of the trade coming to us on the plan outlined yesterday and above, look pretty good.


AMD Trade Management

For now this is a trade management post for AMD which is a long position we took on and it's at a little profit so we want to keep that and potentially even more on a quick move, but you'll need to pay close attention to it or set a price alert if you can.

For those who may want to get involved with AMD long, just be patient and I think you'll get your chance.

 AMD 60 min is a classic set of market manipulations that are used against technical traders because they don't adapt. Technical traders believe in strict discipline, many think if the trade went wrong it was because you didn't show enough discipline. With that much blind faith in T.A. it's no wonder these guys are so predictable and so easy to take advantage of. If you pay attention to the market, you'll see these things I'm about to point out, over and over again and on all timeframes and every asset.

First AMD has a very clear range, it's a rectangle which is a basic T.A. charting price pattern that represents consolidation and continuation, the rectangle has no inherent bullish or bearish bias, just like a symmetrical triangle, their bias depends on the preceding trend which was down. So Technical traders see AMD's rectangle and they expect it to break to the downside and because discipline is so important to technicians, they will most often wait for price to break below the support of the pattern, telling them it's time to go short AMD. As you can see, shortly after that there was a spike that would have taken out and triggered ANY  "Buy to Cover" orders or "Limit Buy' orders placed on the books (with your broker).

I never place orders or stops until I'm ready to physically place the order myself. If you put your orders in with your broker they are there for everyone to see and you might say, "Who cares? Why would they care about my small order?" I can only tell you that the last time I put a stop order in with my broker was when I went on a cruise, it turns out that my stop was the low of the day and the stock went on to close up over 5% that day and nearly 20% over the next few days and I took about a -15% loss! Also never put your stops/orders at obvious places like support/resistance, moving average, price pattern levels and especially NEVER at a whole number or even an even number like $8.50. There's a reason stores always uses $.99 rather than $1.00, the human mind gravitates toward whole numbers.

So after all the orders were flushed from AMD and it broke to the downside drawing in shorts, it trapped them as it went above the rectangle and as they were at a bigger and bigger loss, they cover which sends price up more which causes more to cover and more to buy, it's a momentum snowball and it i as predictable as you can get.

Now we have a bullish ascending triangle which is a consolidation/continuation pattern, it has the preceding uptrend which confirms the pattern and it has the correct diminishing volume as the pattern is traced out. The white arrows in the price window are how technical traders believe AMD will move, that's pretty simple to manipulate, even though I still like AMD long a lot. However, you can use this manipulation to your advantage.


 This is the long term trend in AMD (4 hour chart), from distribution to a confirmed downtrend to a leading positive divergence/accumulation, so I think AMD has a lot more upside to go eventually.

The 60 min chart shows the accumulation at the base and the relative negative divergence suggesting a pullback which may just be a move with the market as most stocks do follow the market.

Here's the plan,

To get downside momentum going for a pullback a bull trap would be most useful. Since this bullish price pattern is complete, all it needs is a breakout that is strong enough to attract traders'  attention and get them to buy. We should see a negative divergence in to this buying, but price should make a very nice move on the upside, as long as there's negative divergences in to the breakout, we want to sell in to that breakout, maybe 5%, maybe more. You can use  trailing stop or 3C, but using the manipulation should get you the best exit price.

Then the longs who bought the breakout will be trapped at a loss on the pullback, their selling will move the pullback with increased momentum and for anyone wanting an AMD long position we just need to watch for accumulation of the pullback and buy AMD at a lower price level.

If this goes right, AMD's price pattern should look something like a "Cup and Handle" and we should be able to re-enter at a lower price, less risk, higher probabilities and with an excellent exit on this leg of the trade. So set some price alerts to let you know when a breakout starts, then we watch for negative divergences to know when to sell.

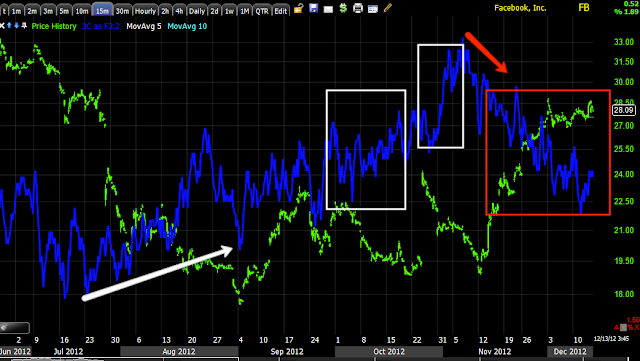
FB Follow Up

Earlier today in this post I said,

"If you are long FB still or are considering taking partial profits as FB is a longer term trade, I would strongly encourage an intraday trailing stop, but make sure it's wide enough to allow for consolidations."

Personally by now, whatever I wanted to take off the table in FB, whether a partial position/profits or the entire position and look for a better entry, I would have done that by now.

I said in the FB update the other day that was specific to a short trade that a member asked about, that shorting FB was not something I was very keen on even though I do think it sees a decent pullback. However if this one scenario does play out, then I would be much more interested in a swing short on FB, I still like the stock over the long term as a long position, but everything needs to pullback and be shaken out.

 Since this morning's nice move up, this is what happened to FB, pretty ugly, thus the trailing stop.

 Here's the 2 min chart with the reason behind the ugliness...

 3 min chart, note where it is most negative-at the price highs.

 5 min neg. suggests a decent pullback

 15 min overall trend suggests a decent pullback, but the uptrend looks like it will survive.


 It is the positive action recently on the 1 min chart in that volatile downside mess that interests me, this could lead to the move in which I would be interested in a FB short.

$28.88 is the level that needs to be broken with a negative divergence confirming the head fake move which should be no problem, note the ugliness today has turned in to a triangle suggesting a highly directional move. If that move is a head fake move up above resistance, then I'm interested in playing FB on the short side just for the pullback.


Futures market update

Just because these are faster to get out...

 ES (S&P e mini ) 1 min leading positive divergence

NQ (NASDAQ E-mini) 1 min leading positive divergence-huge by the way

AAPL Charts -January $525 Calls

I only like options for short term trades, I don't like holding them any longer than I have to. I also tend to like in the money and a further expiration than I think I'll need, they don't make as much, but overall I've seen much better, more consistent success.

 1 min going leading positive from a relative positive divergence

 3 min leading positive

 5 min leading positive

10 min is in line.

I expect a short, probably strong move up in AAPL, the Q's need it! Then I expect AAPL to make a new low for this leg and then there's a longer, bigger base in place for a longer term long trade, but that's still a ways off.

AAPL Trade-Calls

With the signals we are getting, I think a short term AAPL Call trade for maybe a day or so would be an excellent choice right here.

I'll post charts shortly.

Volatility Indicators

Yesterday in several posts I used 3C signals in Volatility assets like XIV, VXX and UVXY to predict intraday market movement, the first time BEFORE the F_O_M_C statement and I said the indications are that the market initially moves up, and then around the press conference I posted again that these 3C signals on these 3 assets had flipped and to look for intraday downside, that came about 10 minutes later and the 3rd post said the divergences remain, so I expected price weakness to remain, it did and it has so far today.

Here's last night's post in which I linked to all of the posts above and also included charts and exact times so you can see how we predicted the market BEFORE the policy statement and after.


We have some more interesting developments, I would summarize them as short term positive for the market, perhaps in to the close, maybe part of tomorrow (we'll have to let the signals tell us) and a longer term set of signals that are market negative (this is exactly what our expectations have been, this is exactly what I have summed up so many times " A fast/strong move above resistance followed by a fast reversal and a longer, stronger move to the downside".

I don't usually like these for analysis as they can be tricky, but these signals worked 100% yesterday and they are there now confirming other things I've already seen.

UVXY (VIX Ultra Short Term Futures) These move opposite the market like the VIX so a move up in UVXY correlates typically with a move down in the market if there's feat.
 We have a 1 min negative divergence, the same timeframe I used yesterday as nothing else was giving signals, I stumbled on these just as they were moving fast just minutes before the F_O_M_C statement, someone knew which way the market was going to move initially right after the statement.

This suggests UVXY comes down short term or intraday even, that should support the market to head up over the same time period.

 UVXY 3 min is showing migration of the negative divergence from the 1 min chart so there's confirmation, but it's also not such a bad negative divergence here so right now it doesn't seem like it will last very long, through the close easily and in to tomorrow's opening trade, probably, but beyond that we don't have any signals yet that would suggest more. That may be enough to make the QQQ breakout.

 UVXY longer term 15 min which is leading positive, this would suggest confirmation of my theory that the knee-jerk move up is quickly reversed and we see some VERY SCARY downside, this is indicating someone is betting on a lot of fear in the market and there's only 1 good reason for that.

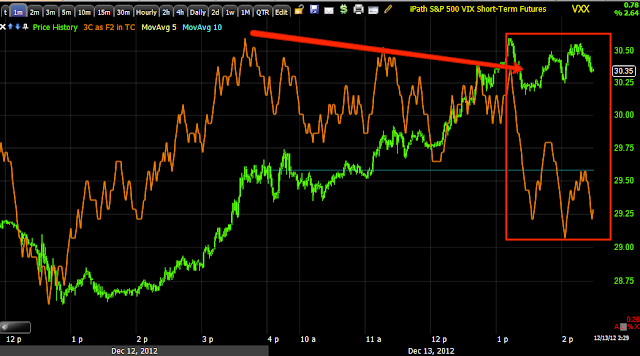
VXX (S&P VIX Short-Term Futures)-not leveraged.  These are essentially the same as UVXY above, they carry the same signal/meaning and they were used yesterday as well to predict market movement.

 VXX 1 min negative leading divergence, short term it comes down, market goes up.

 3 min chart sees migration of the divergence, but again, not that bad of a divergence.

 Longer term 15 min is also leading positive suggesting after a move up in the market (along the time period mentioned above) we will see a nasty reversal and downside move.

XIV (Daily INVERSE VIX Short-Term Futures)- These are the exact opposite of UVXY and VXX, so the signals are opposite, in effect XIV moves with the market.

 1 min leading positive divergence suggesting intraday move to the upside in XIV and the market.

 3 min chart also leading positive so there's migration of the divergence.

60 min chart is deeply leading negative , this suggests that XIV will see downside after the move above is complete and the market will see the same nasty downside.

That's 9 charts among 3 different assets, 2 different correlations and 4 different timeframes and all confirm each other and this is suggesting the exact move I suggested we would see not only last night, but the last 2-3 days in addition to the move predicted that already happened in the IWM and others.


Get ready for a sharp intraday reversal up

Overview of Leading Indicators

This is interesting and again, this is exactly why we don't chase prices and we look at everything we can because you never know where you'll find that piece of information or maybe even just a passing glimpse of that information that the crowd missed.

For example, when I was watching Bernie speak on September 13th at the press conference after the F_O_M_C unleashed QE3, I heard the question (paraphrased) "What happens to asset purchases you undertake if inflation rises?"The answer (paraphrased) was, "We'll make adjustments to the size and composition as well as policy to get the desired effect within the CONTEXT OF PRICE STABILITY".

That was the very top of the market for September 13th, that exact minute for every single average, I think I even remember the time as being 2:24 p.m.

The market did not like the fact that the F_E_D may adjust the amount of MBS they buy according to incoming economic data, rather than previous programs that had a set schedule, you knew what was being bought, how much, what day and how much and how long, this new approach that was being roughed out took away all of that certainty.

OK, so last night I looked at leading indicators and said the following,

"I find leading indicators today interesting as they are in better position than the SPX, which is something new on the day for most of them, the only one that stayed negatively divergent in the intraday timeframe was High Yield Credit, but HY Corp. Credit and Junk both showed better relative performance as did yields although longer term they are massively negative, even the Euro held up better than the SPX today, this in some way suggests to me that the upside the QQQ charts are still flashing in 3C positive divergences, as they HAVE NOT clearly taken out resistance, may in fact not be coincidental when looking at leading indicators intraday, the take away being we get more knee-jerk upside before the longer term/stronger negative market divergences finish taking the market lower from the 11/16 bounce."

"Taken with leading indicators, I wonder if the QQQ won't try to breakout. I still feel strongly we will see a very sharp reversal to the downside before this is over."
_________________________________________________

I just looked at Leading Indicators again and for a second day guess what? They are stronger than you'd expect, stronger than the correlation with the SPX. This to me means the same thing it meant to me last night, so don't be surprised if volatility picks up.

Futures Update-Think the Q's can't hit that area?

You might want to think again, I'm not saying they will, although it is like a magnet for market makers & specialists with a nice reward just above for both, I'm just saying there's enough gas in the tank here to do that.

 ES (S&P)  1 min 3C futures showing a leading positive divergence.

NQ (NASDAQ 100 Futures) 1 min 3C chart with a leading positive divergence.

Remember the post questioning whether to pick up TECS and "If you have the aptitude and patience, you will get the best position, the least risk and highest probabilities".

I don't know what any of you have done, I haven't done anything partially because of gut feeling and mostly because of time, but this is an excellent example of: The rewards of patience and especially the motivation and emotional component that forces us to act. This last part, the emotional one is so important that I think all traders should keep a trading diary, not a journal, a diary and write down the emotion of the trade.

Did you feel fear that you might miss TECS? Greed maybe? Was your decision balanced and based on the best choice with the information you have? Does it reflect a position you are comfortable with?

All of these things are very important for us to understand about ourselves and then we can understand the market better, we can reduce mistakes, create rules, learn to make decisions for the right reasons, learn to use creative problem solving that fits our style-such as phasing in to a trade .

Just something I thought I'd throw out there and see if it stuck.


XLK-Technology

Here's Tech, similar to the NASDAQ 100 as you'd imagine due to the number of Tech components in the NASDAQ 100.

While the issue is whether to start a position in TECS (3x short Technology) or add to an existing one, I prefer to use XLK because it has better liquidity than TECS, you just have to remember whatever you see in XLK is the opposite in TECS.

 Like the NASDAQ 100 / QQQ, there's a range that "could " be used in a head fake move as a reversal catalyst, but as you will see, I think last Tuesday's accumulation was a set up for the market to actually complete a head fake move, notice I said complete and that opinion is born out of some charts I see below.  The break out level would be above $29.40 in XLK.


 Here on a 1 min chart it looks like we have a positive divergence and a decent chance for an intraday reversal to the upside. I'd prefer if 3C which is in positive positive was also trending up or at least pointing up, but that may happen before I finish this sentence.

 The 2 min chart is not only negative intraday, but this is part of the evidence I mentioned that we already saw the head fake move which was above $29.30, as you can see this is where the 3C divergence is the worst, implying the heaviest distribution and validating that as a head fake move.

 3 min chart from the 16th's positive divergence at the lows to the negative divergence at $29.30 and then another at the breakout above $29.30. Last Tuesday happened so fast and was very confusing, I only knew it wasn't big enough to change the general trend, but it was positive action and it seemed to be to shakeout shorts; now looking back it seems that is exactly what it was. As I often remind, when you see a 3C signal you will never know why, you'll just see what they are doing. If you want to know why they are doing it you can find out, but by that time there's no more money to be made.

Yellow areas are head-fake moves.

Below is the XLK 5 min chart showing the longer trend since the 16th when this began, note that accumulation began before the 16th, in fact several days before, but  if you average that accumulation from the $28.25 area down to the $27.20 area, you get some average position cost in between, however notice that distribution didn't even begin until price in XLK was well above where accumulation first started, THIS IS A VERY IMPORTANT CONCEPT IN UNDERSTANDING 3C, INSTITUTIONAL BUYING AND GETTING IN TO POSITIONS AND TRUSTING THE INDICATOR EVEN WHEN IT'S VERY HARD TO DO SO.

Intraday reversal looking very probable

NASDAQ / QQQ

Here's the Q's, they are deteriorating, there's a 1 min positive divergence left, but remember my gut feeling this entire time was this was going to be a fast reversal, I'm not 100% convinced we don't see the Q's attempt to take out that range mentioned, but the reason for that is because I haven't had time to look at some assets/leading indicators so I don't have the full story to feel comfortable making that determination, but this is why we phase in to positions and build positions as we were doing yesterday and many are doing today.

 60 min  QQQ, the range is at the red trendline-$66.37

 1 min QQQ is positive, there's a decent chance for an intraday reversal here.

The 2 min chart though has fallen apart so deterioration is picking up fast as I said it would, but even faster than I thought. This doesn't mean we can't still get that move, it just makes things more complicated, but that's the way Wall St. wants it.

Tech next

FB Note for longs and potential shorts

I think I mentioned this in the post yesterday responding to a member who wanted to short FB for a pullback move, I'll look at the post later, but the area that would set up a head fake move before a reversal is above $28.88. FB's 1 min is pretty much in line with today's intraday move, but everything beyond that is negative so I would watch very carefully for a break above that level as it is probably a head fake and a warning of the downside move to come. If you are long FB still or are considering taking partial profits as FB is a longer term trade, I would strongly encourage an intraday trailing stop, but make sure it's wide enough to allow for consolidations.

I'll get charts up ASAP, after the other ones I need to get out.

TECS -Short Tech?

I didn't like the idea very much yesterday compared to some of the others, I felt we would get there, but with that area in the NASDAQ and a similar area in the Tech Sector, I've been hesitant to add to or initiate a Tech short here.

As I look at the charts and see how on the edge this market is, I think about the phasing in solution. In essence you could pick up some short Technology ETF (TECS-leveraged short tech) or short XLK, but do it either in speculative position size, allowing plenty of room for a wide stop in case the NASDAQ  and Tech can make it to those areas which would cause a Tech short some draw-down. Then you have exposure to the sector, if that move comes, your position sizing/risk management has so little risk that it's not a problem and you can then look at adding to the position so long as the charts are in your favor which I'm confident they would be, this is the phased in approach and it requires you to set up the plan before you enter even a partial position.

If you have a totally different aptitude and don't mind possibly missing the trade or having some exposure to the trade, then you have the best edge as you can just wait for that potential move (the break out in the QQQ above resistance-same for XLK) and you can enter a normal size position there with an excellent entry, very low risk and very high probabilities. That takes patience, it takes the willingness to possibly miss the trade if it doesn't come to you exactly on your terms, but if you have the aptitude for that kind of thing, that's the best alternative.

Since I'm getting so many emails about TECS and short Technology, I'll put together some charts and get that post out next.

Market Update

You lose 1 divergence or so it seems and you find that it's just part of creating a bigger divergence, the DIA is a decent example of that, but the DIA is also a good representation of the "Razor's Edge" we are on. I want you to see first that there's a small divergence in place that could lift us from here, but the larger divergence, the most serious trend and the highest probabilities are down and we are sooo close to that area that I wouldn't be long the market here at all and I do feel comfortable adding to short positions or initiating new ones which I will cover. I'm only using the DIA just to sped this up.


 DIA 1 min which was leading earlier went to a small negative divergence at this top  and price making a new low without 3C means this is a larger 1 min positive divergence.

 The DIA 2 min was leading to the upside, the pullback to new lows didn't pull 3C out of leading positive position so it adds to the size of this intraday positive divergence as well. This is where it stops for the DIA for now, these are intraday moves only.

 The 3 min is not seeing migration of the divergence from the 1-2 min. charts, it's negative at yesterday's F_O_M_C top and in line since, that's price/3C confirmation.

Here's where it gets dangerous for the market...

 This 5 min leading negative divergence is a stronger signal than any above, it is in to higher prices from the last several days so the move up that was set up starting late Tuesday of last week has been sold in to the entire time, but passed some areas where bulls would buy, making it easier to sell in to higher prices and demand.

 The same 5 min chart in scale since the bounce started on 11/16, the white box is where we saw that positive short term change in the market, you can see what it did with price, lifting it above local highs and the 50-day moving averages, that creates buying demand, but look at what smart money was doing with that demand from retail, they were selling or selling short in to it the entire time so we now have a leading negative divergence at a very deep low, below even where 3C was when price was at the lows of 11/16- VERY DANGEROUS as this market is right on the edge.


Not that we even need it, but the longer 15 min chart which carries more significance/stronger signals/distribution is also leading negative sharply, again in white the area of accumulation that built last Tuesday and Wednesday, you can see what it did to price, you might want to go back in the archives and read the market updates from that Tuesday, 12/4 just for some perspective.

Again, a VERY DANGEROUS place in the market, a ripping move to the downside could be right around the corner.

Market Update

A couple of the averages have lost their divergences completely which is not hard when all you have is a 1 min in place, the SPY and DIA have lost it, the Q's and IWM are holding some, but all of those negative charts that have been in place and have grown worse during the move up this week are very close, it's almost a "Razor's Edge" kind of deal, this is why I had no problem adding leveraged shorts yesterday.

I wanted to get that out to you and I will put out some of the important charts, not all of them, just the key ones at this point.

I'll also look at Tech as that was the one area I didn't feel comfortable adding shorts to yesterday.


EIA Natural Gas Report / UNG

Thursday's EIA Natural Gas Inventory just came out...

Released On 12/13/2012 10:30:00 AM For wk12/7, 2012
PriorActual
Weekly Change-73 bcf2 bcf

Natural gas in storage rose two billion cubic feet in the December 7 week to 3,806 bcf. A small withdrawal was expected.

It's not always the news, it's the reaction to the news. I would consider this report slightly negative as a draw was expected and we saw a gain in storage instead, but the initial reaction in UNG has been favorable, price has also been sitting in a favorable area for such a reaction (we do have to remember it is very early and these reactions can change).

 UNG's Ascending Triangle Base. Since Technical Analysis became popular during the late 1990's as more and more people started managing their own portfolios through the internet and cheap online brokers, it has changed a lot; the reason is with all of these people using Technical Analysis it became very easy for Wall Street to predict their behavior, to actually influence their behavior. One of the things that changed was how bases and tops form. For example consider a "W" bottom base, according to Technical Analysis handed down nearly a century, the second bottom of a "W" base should not fall as far as the first bottom in the "W", in effect the second bottom is stronger. This changed with Technical Analysis becoming popular and now it is most common to see the second bottom in a "W" base to make a new low, this is because Technical Traders have not adapted to Wall St. using T.A. against traders. The net effect is, traders believe the "W" base is a failure and sell their positions right at the bottom, some even go short only to see the base breakout to the upside from there and this is only possible because technical traders follow the handbook to the letter and Wall St. knows that, they know how to get those shares cheap.

Essentially the same thing appears to be happening in UNG, although the base is an ascending triangle so support is a rising diagonal line.

 After a few failed breakout attempts (that were too early in the base's formation, the last failed attempt caused a fast move to the downside that broke support just like in a "W" base. Remember the head fake rule, "From a failed move we get a fast move/reversal), so with the pattern being very close to finished, a shakeout move here is not unusual.

Recently it looks like the downside momentum has been stemmed and UNG is ready to either make a small base before reversing to the upside or it could treat the break below support as a head fake move as well and just move up quickly as it moved down quickly from the last failed upside breakout.


 Here's a 5 min chart of today with the 10:30 EIA Inventories report, you can see the movement and volume at the report's release, I don't think it was an especially bullish report, but initial reaction in UNG has been favorable. Remember this, "It is not the news, it's the reaction to the news that is important".

 The 2 min chart very positive in the area where downside momentum has been stemmed.

 This is the intraday chart and positive divergence at the lows on the EIA report.

This is a 60-min modified Trend Channel, basically to change the dynamic and character of UNG we need a move above the $19.90 area, it may be a little lower if it takes more than half a day. Once this change of character appears we can expect a change in trend.

Bottom line: UNG was always meant to be a long term long position, it was always understood to be in the process of creating and now finishing up a base and bases as well as tops are always the most volatile stages among the 4 stages of a trend. I still love UNG , even here.