The market is obviously in need of some help,
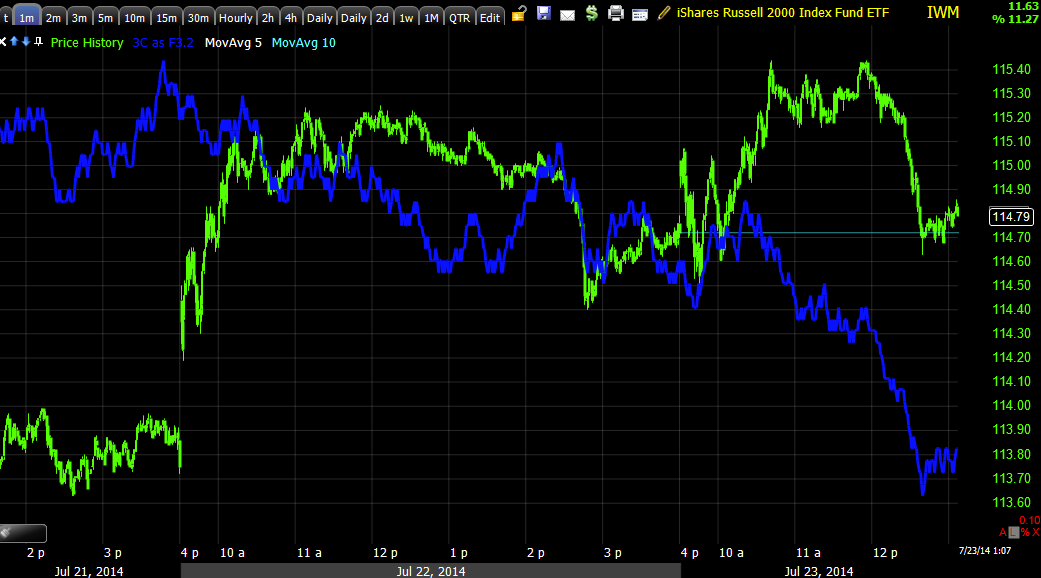
Our Most Shorted Index has been squeezed 3-days in a row on the open, but can't produce anything beyond that (you probably know what a short squeeze looks like, low volume, almost diagonal price action with almost no pullbacks). *Remember this index is severely dislocated to the downside, see last night's Daily Wrap to see just how badly.
Intraday the MSI had trouble even keeping pace with the market which I suspect weighed on the intraday action.
Of course we knew this last week with HYG positive 5 min divergences which are being eaten in to, but still have some gas in the tank. To see how dislocated both HYG's 3C chart (long term distribution ) as well as the price dislocation largely since July 1st, also see last night's post.
High Yield Credit however (HYG is specifically used to move the market is the SPY arbitrage) is acting a bit differently, not as enthusiastic.
This borrowed chart from ZH points out HY credit's decline after the European close and after POMO ends, I'm not sure I believe this is anything more than coincidence as at least the second decline is counter intuitive.
The market largely tried to follow AUD/JPY after a hot inflationary print down under overnight, but had some trouble. Earlier this morning I could already see distribution in $AUD, although not in $AUD/JPY at the time, interestingly in to the close the negative divegrence built and AUD/JPY has dumped...
AUD/JPY vs ES (SPX futures purple) since 4 a.m. to present, ES had some trouble making the higher highs with the carry cross and...
The negative divegrence in $AUD seen earlier today finally manifested in the carry trade in to the US close and dumped just after. Hmm...
Bonds have not been drinking the Kool-Aide that stocks are, however this isn't surprising in a set up cycle/bounce...
*These are the yields which move opposite the bond, however yields typically move with the market, in this case SPX in green
30 year yields want nothing to do with this move, this suggests a flight to safety, although there has been a notable decline in rates since the CPI print Monday morning.
10 year yields also not buying what the market is selling.
And 10 year yields near 2014 lows.
10 year yields since CPI was released...
And the 5 year yields I like so much as a leading indicator as they tend to pull equities to them like a magnet, I imagine on a larger, bigger picture basis, that's likely exactly what we'll see (regarding the longer term charts above).
I pointed out yesterday the VIX'x bullish Rising 3 Methods candlestick pattern, that held today...
The daily pattern is still holding implying a move significantly higher in VIX which moves opposite the market.
Earlier today I pointed out the VIX futures outperforming their normal correlation, in fact closing green on the day despite SPX new highs...
VIX (spot) yellow vs. VXX (Short term VIX futures) green and above yesterday's close (trendline).
Of the 9 S&P sectors I track, 6 closed green, however...
Healthcare which has been acting like a Flight to safety trade, often #2 on the day when Utilities are number one, was right at the top.
Even more interestingly, of the 239 Morningstar Industry and Sub-Industry groups I track, only 119 closed green today.
There was no Dominant Price/Volume Relationship today except for the Dow which was Close Down/Volume Down (these are the component stocks, not the average), which is the most benign of the 4 possibilities with really no next day indications like yesterday's that suggested a lower close, we did see significant weakness if not the lower close (except the Dow-0.16% on BA weakness, shaving off about 20 DOW points).
Finally, while not a smoking gun, this is significant. The NASDAQ Composite closed up +.40%, the Russell 2000 + 0.17% and the Russell 3000 +0.18%, all 3 averages saw their advance /Decline line tick DOWN today, which is interesting especially for the Composite which already has a huge dislocation from May, but especially from July 1.
If anything significant pops up in Futures I'll let you know, otherwise it's just patience until the next strong signal comes. Speaking of which, we "may" have a DUST or JDST trade, confirmation across the 6 assets has been difficult the last several weeks which is good seeing as they've gone nowhere, but we may be getting a workable signal developing now.


