This is what we expected and I wish I had bookmarked some of the many posts in which I tried to be clear that what is expected in trend #1 as far as being the shorter of the trends, did not apply to the intensity and another post talking about how it's likely we can't even imagine how strong the move will be-ALL TIME NEW HIGH FOR THE R2K!!! Something like 70 points in ES! This wasn't because of the signals, although they were helpful as our call positions up 200-300% prove, it was more based on market behavior. You've heard me say it many times,
"The market doesn't do anything like this without a reason" and today the shorts were shaken out hard, plenty of longs are in position for a trap, the snowball effect of a head fake move, and on and on. However the point being, thee move are always more extreme than you'd think is reasonable because they need to accomplish something like squeezing the shorts out and that can only be done by touching a nerve that hits emotional extremes-thus these moves and the reason we need to chose the right tool for the job.
Another record was set today, the biggest 2-day percentage drop for the VIX ever. It was just last week (before the end of the year, before T+3 settlement and before the Fiscal Cliff vote) that we were talking about the extreme momentum in the VIX as it walked the upper Bollinger Band.
The daily VIX was walking the upper 20/20 Bollinger Band which is a rare sign of extreme momentum as institutional traders with a lot of long exposure found themselves in an very illiquid market with no way to reduce that exposure without driving their prices way down, so they hedged and VIX shot up.
My guess is 2 things have happened with VIX, 1) Institutional traders have removed hedges that were in place for the Fiscal Cliff and any potential end of year decimation (they are one in the same really) and 2) Hedges that remain in place were rolled out to March or so when the Debt Ceiling becomes the next huge Congressional problem, but I'm guessing more just took off their hedges.
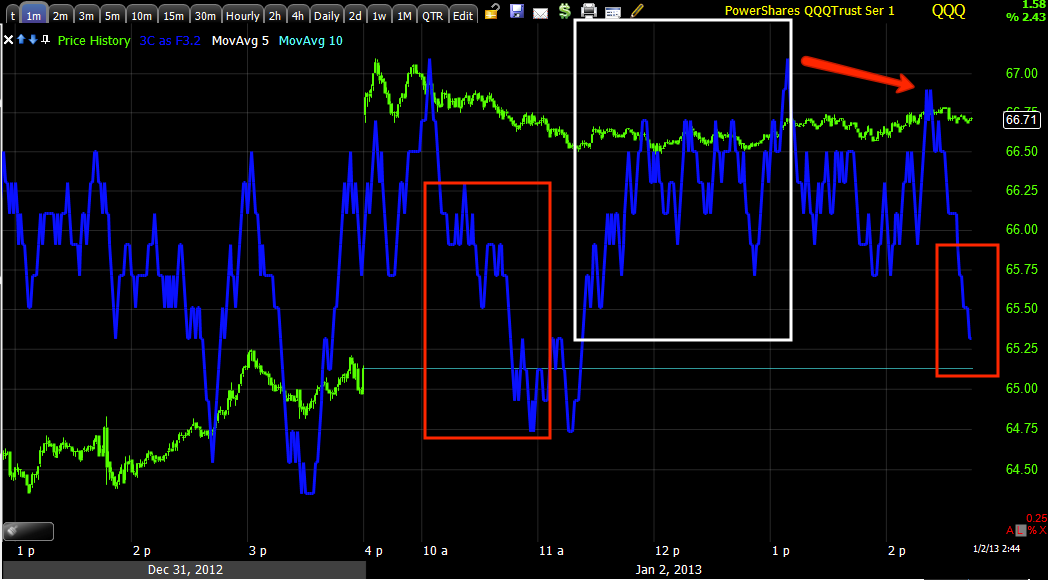
As for the red arrow, that's the modified "Clear Method" I use, that's not a yellow arrow noise candle Monday, that's a reversal candle- from one extreme to the other.
If you really want to go back to one of the seminal moments, it was the downdraft on Friday where a lot of hints were given away-
"Early Closing Take" . This is when it was apparent something was going on, the market had plunged, but nearly every other risk asset refused to budge, that means to me (as I believe there are charts in the post showing it too) that the "blood in the streets" Friday was an accumulation period in stocks-like I said, some of the most profitable traders out there are Congressional Staffers, ever wonder why?
As for the market today, there weren't a lot of great signal intraday, but as I pointed out, there weren't likely going to be many until the SPY and DIA joined the QQQ and R2K in breaking resistance
-that's where traders step in to act on confirmation, that's where smart money has demand they can make moves in to and that occurred pretty late today, but as I said today,
" I will note that a move above resistance in the SPY and DIA in my view is almost a certainty, there are too many reasons for them not to take out that area "
As for the averages, remember I don't expect to see a lot of short term movement until the target area in reached. If you know (as we were fairly certain as shown above) that the market is going to make a move higher and above a particular level, are you going to start selling early before that happens? Most of us would say no, some larger funds might have to just because their positions are so large and then they average it all out.
Before we get to the averages, lets finish with volatility in the form of VXX and UVXY (The VIX Short Term Futures and the Ultra version of the same respectively).
The 60 min UVXY (leveraged version) has a huge leading positive divergence, look at the area though where the divergence was the largest, it's when buying hedge put protection was the cheapest. Still the point being is this is the bigger picture, the highest probability chart and it's positive UVXY, meaning UVXY should see some very impressive upside in the not too distant future and that means the market goes the other way.
VXX (non-leveraged version) 15 min chart shows a leading positive divergence that sent VXX up from $28 to $36.50, then a smaller negative divergence and as of now with today's plunge we have a large leading positive divergence and we are in the same area the accumulation was built up last time (not that I expect an exact repeat).
VXX 4 hour chart doesn't even need any notations, it was confirming the move down in VXX to the left as 3C made lower lows with price and then a huge change in character as VXX kept moving lower and 3C is leading at a new positive high for the chart, again, this is the longer term, bigger picture, but this could very well be part of the signals that fit with trend #2. Remember there's signs of a third trend and trend #2 should be bigger and more intense than trend #1 (what we are seeing now) and each fit and flow in to each other so the point being, this crazy upside could see even crazier downside in trend 2.
As for the averages, like I said, I don't expect to see a lot of movement as the move in the SPX and Dow were late in the day, but futures overnight may give us information and tomorrow should give us penty of good, actionable information.
DIA 5 min-this is about where serious institutional signals start, the longer the chart, the more serious the signal, below 5 mins is mostly intraday stuff, but we can get good information from the trends if you have enough history. Point here is the DIa positive divergence getting ready for the last 2 day move, note accumulation was at the very lows,
it is not on a breakout as many traders believe as they see volume rise. We see an intraday positive divergence this afternoon that leads to the afternoon leading positive divergence and then the move above resistance.
The longer 15 min DIA trend from when the current cycle started at the 11/16 lows with accumulation about 2 weeks before hand, then distribution in to the top and a leading negative divergence (this is what is leading to trend #2) and a divergence from mid December to late December fueling this move of the last 2 days. This is what people fail to grasp, accumulation started somewhere around the $132.50 level, it picks up and gets stronger at lower levels and it was accumulated down to about $128.50, a lot more is accumulated at lower levels so you take all of that, average it with an exponential emphasis on the lower prices/more recent data and say it averages to be $130, today we're at $133.77, multiple the $3.77 by tens of millions of shares.
This is why I say, "Wherever we first see a divergence start, we almost always see price move well beyond that level.". Still, the larger picture in the DIA is a large leading negative divergence in place now, it's something I warned would happen, price would rise, 3C longer charts wouldn't and the divergence would be even bigger making the market that much more dangerous to the downside.
The IWM is interesting as it made a new high today-all time new high! The 10 min chart is in an overall leading negative divergence since the accumulation in to the start of the cycle at the 11/16 lows. This seems to be inconsistent, "How can you have a new high with signs of heavy distribution?" This is why so many people fail to grasp the market, institutional money can't sell large IWM longs or go short in a meaningful way without buyers/demand. What creates buyers and demand, a breakout to a new high, it's one of the simplest principles in Technical Analysis and it gets used against technical traders in so many ways I can't count them.

10 min IWM (same chart), but zoomed in closer shows the accumulation in to the 11/16 low (kind of the same principle as just explained except on the downside when they are buying and covering shorts). Not only do we have a negative divergence, we have what looks to be an intraday negative divergence in the IWM today as 3C moves lower, suggesting the demand brought on by a breakout new high was used to sell in to by smart money.
When you think about all of this you have to remember the difference between you and them, you can sell a position with 1 order and be done without effecting price, their positions are so large they need massive supply and demand to move their positions, thus some of the crazy extremes and why I say, "Wall Street doesn't do anything without a reason". In this case an new high in the IWM gives them the ability to sell at the best prices in to plenty of demand.
QQQ 1 min with positive divergences last week, remember Friday how much I liked the underlying trade in the Q's and had to go with that Call position?
The 15 min bigger picture, which I believe leads to trend 2 shows the large accumulation weeks before the 11/16 lows that started this cycle, distribution of those shares at higher prices and at least 2 head fake moves, one snapped price lower on a gap down (12/21-12/31) and this second is even bigger with an even deeper negative divergence.
SPY 1 min was behind the QQQ/IWM so it makes sense it saw more underlying positive divergences today, that's in effect support to push the SPY higher.
The 5 min chart which is about where that positive divergence from the support stops.
And the 15 min with a current nasty leading negative divergence as the SPY is at a new cycle high.
Leading Indicators...
For an earlier look at Leading Indicators today (although it was a bit dull),
you can click here.
Commodities as a risk on asset (they should follow the equity market) was diverging negatively with the SPX (green), this was due to Euro weakness which we will discuss in a little more depth.
Commodities again on a 1 min chart, but now the green comparison symbol is the Euro, you can see how commodities tracked Euro weakness earlier in the day and then were caught between Euro weakness and market strength.
This is the Euro (5 min chart) which showed much better relative performance as the market dipped from around the 18th to the 31st, the Euro barely moved and certainly didn't track lower. In normal circumstances (even though the EUR/USD is not one of my favorite currency pairs for leading indications, it is good for confirmation) I'd say there was market manipulation to depress prices to accumulate for an event like we have seen the last 2 trading days, but I think there's another reason and it's probably not one or the other, but a mix of both.
As the year draws to a close, European banks which are severely under-capitalized, need to make their balance sheets look good for the Q4 2012 and full year report, to do this they need to minimize risk and raise capital ratios; the easiest way to do this is to sell assets, but when selling $USD denominated assets (and just about every major commodity trades in $USD's and our stock markets are larger, we have more funds to invest in as well as Markit's PrimeX) they need to first sell the $USD denominated asset and then they need to sell the $USD and buy Euros and then bring them back to Europe (repatriation). When this happens as it did in Fall of 2011, it drives the Euro higher and typically the dollar lower as a basic function of supply and demand (they have a large supply of $USDs and need a large supply of Euros) that supports the Euro. I think that was going on as well as some market manipulation in stocks as we saw Friday and as is linked above, stocks fell, but every other asset class remained stable-clear manipulation and the reason I started my Weekly Wrap with this sentence...
"Well I'd much rather have the NASDAQ call position than a NASDAQ put position going in to Monday."
The results...
The red arrow is Friday for the NASDAQ 100, white is Monday and green is today-that wasn't a lucky guess, that was based on objective analysis.
As for the Euro intraday today, it collapsed vs the SPX, this is NOT a normal correlation, this should be pressuring the market. I don't know if this is because of year end, because carry trades are being taken off, perhaps a leading indication from FX traders, or maybe all of the above, but it is NOT market supportive.
Even the $AUD, which is one of my favorite currencies as a leading indicator, showed some relative weakness vs the SPX, not enough to raise flags, but perhaps the carry trade is being unwound or it could just be coincidence.
FCT for whatever reason is a decent leading indicator and even intraday (although it really shines on larger divergences) it was pointing to a move higher in the SPX.
Yields are what I call " A magnet for the market", today they were largely in sync, they were a bit flat and closed before we could see how they'd react on the late day ramp.
We look at Credit because as the saying goes, "Credit leads, stocks follow" or some say "Stocks confirm", but in my experience a good divergence between credit and the market will almost always break toward credit.
We track High Yield Credit as it is a risk asset like the SPX rather than Investment Grade which is more of a flight to safety like Treasuries.
HY Corporate Credit actually was in an intraday positive divergence suggesting the SPX see an afternoon rally.
Junk Credit also led the SPX and hinted at a move higher, however in to the SPX move higher in the afternoon, Junk Credit didn't make a higher high.
This is extremely myopic, but divergences always start small.
High Yield Credit was the start, it held up as the SPX dropped and pushed to a new intraday high.
As for the SKEW Index which was getting a little scary recently, it is still elevated, but backed off the recent highs.
At the end of December it wan't just SKEW moving out of the 115 zone and to 128, it was more the rate of change which was pretty dramatic compared to the past, you can see that below.

The CBOE's SKEW Index tries to put a probability on an improbable event using options data, in essence a high reading in the 140's is the danger zone and what it is trying to predict is the probability of a Black Swan event or a market crash.
As for futures, there's not much going on tonight, ES is dipping a bit in about a 5 point range. There's no really serious signals yet, but we have seen these turn around in half a day on important timeframes so they need to be watched carefully. I'm hoping futures hold up overnight to so I can close some Call positions that are nicely in the green, assuming there isn't information in the underlying trade suggesting another big pop higher in which case I'd like to hold them.
ES & NQ (S&P and NASDAQ e-mini Futures).
ES 1 min generally is in line with price today, in overnight trade we see a slight leading negative divergence starting, it may or may not hold up, but price is dipping with the divergence at this point.
ES 5 min chart for the most part is fine right now, no major or even minor concerns, this can change fast, but it's what I'd call "in line" or price/3C confirmation.
The ES 15 min chart shows a large area of accumulation and as we hit highs today we do have a relative negative divergence, this is still small (just compare to the positive divergence in white), but it needs to be watched obviously.
NQ 1 min is a bit more negative looking in overnight trade in a deeper leading negative divergence, this has hit a new local low so this one is more serious.
The NQ 5 min chart shows accumulation to the left (again note the flat area in price where we see accumulation and distribution while most traders are caught of guard as they see the market as "Dull".
This relative negative divergence is decent size, it's not at an impending reversal point or anything like that, but it definitely needs to be watched and I'm curious what it will look like by pre-market tomorrow.
The NQ 15 min chart also has a large pleading positive divergence at a flat area in price followed by an explosion in price to the upside and now the first signs of a negative divergence, still very small, but that's how they all start (and obviously some disappear).
That will about do it for now, I'll update any changes I see, but stay alert, stay nimble. Like I said many times today, we weren't in an area in which we'd expect to see too many signals as the SPY/DIA had not made that new breakout high, but the average that did, the NASDAQ, has some clear negative divergences in the futures so we may see a lot more tomorrow or we may have confirmation for some more upside, this is why we bought the calls to hedge and make $$$.