You probably don't need much more in the way of evidence to see how the market has been reacting (especially the bond market) since the F_O_M_C and tomorrow we get the minutes,
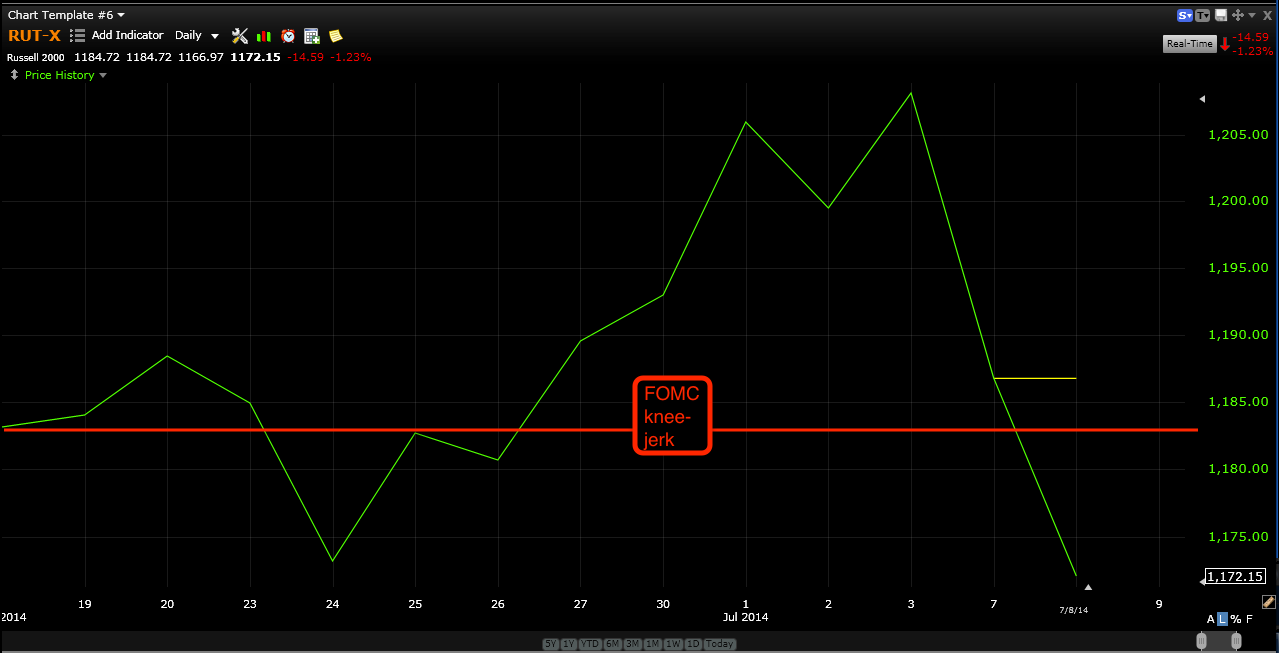
just like any other F_E_D event, I always warn, "Beware the initial knee jerk reaction, it's almost always wrong" and this time it took a bit longer than usual, but we are retracing the last F_O_M_C knee jerk.
In Europe, the major averages are down 6% the last 3-days, the biggest such drop in 13 months with banks/financials getting whipped around the worst and safe haven utilities catching a bid.
As for the US, a few graphs/charts since the F_O_M_C and Non-Farm Payrolls from last Thursday which the equity market took as a positive while the bond market took as a negative, the last 2 days of market action since then seems to be showing (as usual) the bond market was right. However in the mean time, we have documented a number of assets that have been behaving the exact opposite of what you'd expect, I posted them in last night's and Monday night's Daily Wrap.
The market leading Russell 2000 is red since the F_O_M_C in June, the last 2-days have been brutal with a loss of -2.95%,
oh there's volatility in the market, you just need to know the important places to look for it.
The R2K on the year is nearly in the red, from the close of trade 2013 to today, the R2K is only up 0.76% on the year (2014).
Since the Non-Farm Payrolls which equities took as bullish and at the same time there was a flight to safety as bonds were bought as evidenced by the 10-year yield (salmon) vs the SPX
The major averages since the NFP with the R2K leading to the downside.
speaking of money moving out of equities and in to safety (bonds / VIX), these are the momentum names since the NFP as well as the end of window dressing, Pandora, Facebook, Twitter, Netflix and Amazon, not looking too hot, whether they are catching up to bonds' reality at the end of window dressing means managers have a free hand to do what they want until the end of the next quarter.
Speaking of flight to safety, the VIX was shown last night in the Daily Wrap and the importance of multiple timeframe analysis which revealed the VIX had 2- major candlestick reversal patterns, today...
Coming off multi-year lows and the reversal candles, VIX hit 3 week highs today.
As for intraday action, you saw it in all of the updates, I suspect a slightly larger base for a bounce is being put together, I don't think the story ends well, but in case the divergence was for today only to lift stocks off lows, here would be one reason...
To move Es/SPX futures to VWAP, which is where the market makers and specialists try to sell (or buy) for their clients, intraday ES hits VWAP after the intraday 3C divergences.
I still suspect a bounce to the upside
and I think it's a great shorting opportunity, maybe the last.
I've compiled some of the momo names and I want to show you the possible set ups, the way they all look very much like the market not only intraday but also as a major top.
AMZN
3-day chart, notice anything in the character of price between 1, 2 and 3? Remember the "seemingly" bullish increase in price's rate of change right before a change in character, even here AMZN looks like a clear top at #3.
A closer look and another H&S top at the top of the right shoulder, I already confirmed every stock below with volume analysis for probable tops, especially the H&S ones. This is much like the IWM and many stocks on my watchlists, when you have this many looking alike, it's not coincidence.
The daily 3C chart for AMZN with confirmation at the green arrow and distribution through the top which gets worse as it goes as it should.
2 hour chart showing the head and right shoulder distribution/negative 3C divergences.
The right shoulder is one of my favorite places to short a H&S top
the point being, IF WE ARE WORKING ON A SHORT TERM BOUNCE, ALL OF THESE MAKE EXCELLENT SHORT SALE CANDIDATES.
60 min chart distribution in to the head and right shoulder with some accumulation to lift AMZN off the neckline to form the right shoulder.
10 min chart at the top of the right shoulder.
And today's 3 min chart with a positive divergence, a bounce here would open up an already great shorting opportunity, you know I don't like chasing stocks, but letting the trade come to us.
Also note the changes in character since the end of Window Dressing on 7/1.
FB
2-day chart, with stage 1 accumulation, stage 2 mark up or rally, stage 3 top, stage 4 is next and that is decline.
A big part of knowing where an asset is going is knowing where it is, FB seems to be clearly right in stage 3 distribution/top, decline is next.
FB 2 hour chart at the head and the right shoulder, note the deep leading negative divergence at new lows.
10 min chart at the right shoulder, there's accumulation to create the rally off the neckline and to form the right shoulder then distribution in to those highs, the best entry is as close to the top of that right shoulder as possible so today's intraday divergences may lead to a bounce that gets us closer to a better, lower risk entry.
5 min chart at the right shoulder top.
2 min intraday, hopefully this will bounce and give us a great shorting opportunity and extremely timely at that as the right shoulder has officially already broken.
IBB-NASDAQ Biotech
On a weekly chart, notice anything strange about the price's change in character?
We have another semi-H&S top with distribution right where you'd expect it.
the 60 min chart confirming the same, but showing some accumulation to form the right shoulder or second top, Wall Street knows what they are doing long in advance, I've showed this with housing/home builder accumulation during the 2000 tech bubble pop, how did they know housing would lead the next bull market?
30 min chart at top 1 and 2
15 min chart at the most recent top with distribution
And the 5 min chart distribution at the very top of that top, also note the date, 7/1 the first day after Window Dressing is over.
This is not coincidence, it is seen on almost every chart that goes south after having been strong the weeks before the end of the quarter.
And today's 3 min chart as well as the top to the left. A bounce here would give us excellent short positioning at much lower risk.
NFLX which I've already gone over...
Intraday and the top of the right shoulder to the left.
15 min chart at the top of the right shoulder, again note the date of 7/1 and the changes after.
The 15 min chart in context of the entire right shoulder.
And the entire H&S on a more powerful 60 min chart with distribution at each shoulder and the head.
P
Pandora's stages, 1 base, 2 mark-up, 3 distribution/top and 4 would be decline. ANOTHER H&S TOP.
THESE ARE MY 2 FAVORITE SPOTS TO SHORT A H&S, THE 3RD COMES LATER.
60 MIN CHART SHOWING UPTREND CONFIRMATION AND DISTRIBUTION IN TO THE HEAD AND RIGHT SHOULDER WHICH IS AT A NEW LEADING NEGATIVE LOW.
The 30 min chart confirming the exact same thing.
And the 10 min chart going negative at the top of the right shoulder.
This 5 min chart shows distribution right after Q2 window dressing is complete, note today's positive divegrence, if it can build a slightly bigger base, we can get a much better entry and much lower risk.
TWTR
Again the importance of multiple timeframe analysis reveals TWTR at a massive 5-day candle bearish engulfing downside reversal.
The 60 min chart, mostly in line, but recently at the last rally seeing extreme distribution, this is the major underlying trend I want to be on the right side of (short).
The 30 min chart showing the exact same, good multiple timeframe confirmation.
And the 15 min chart with the mid-May accumulation we saw assuming the market would produce a head fake above the SPX's 3 month range as it did, the distribution is what tells us whether it's a head fake or a real move, this is strong distribution. Note the accumulation, again, Wall St. knows what is going on months in advance as they are pulling the strings, this is why we want to follow what they are doing.
And the intraday chart with a positive divegrence, note the gap up/distribution on 7/1, the first day after window dressing where managers sell their worst performing assets and buy the quarter's best performing assets so they look smart when they distribute their filings to clients at quarter's end, it's deceptive and they can't get away with underperformance very long, but they still window dress. What is interesting is their apparent rush to get out of risk assets as soon as the window dressing/quarter's end is over, the very next day in fact.
So we are looking for bounces here, I'd set price alerts and we'll see what intraday trade brings tomorrow. If we can get stronger intraday positive divergences and a wider base, we can get closer to the top of these right shoulders in momentum stocks that will likely be hit the hardest as they have the least fundamentals underpinning them and many as you can see are some form of social media.