Monday, May 12, 2014

EOD Update

I wish I had some big puzzle to explain and all of the pieces fit neatly in to place, but the truth is, this is much more simple. If I had to I could summarize the market in a sentence, for most of you reading last week's posts, you don't even need that.

If I were to summarize the market with 1 chart, it would be this one...
 As we saw all last week, USD/JPY and the VERY significant $102 level is all that has really mattered, ES/SPX futures have been following the FX Carry trade pair all last week, the only two areas where ES either underperformed the correlation or out-performed the correlation, they were both corrected in very short order to bring ES back to the correlation.

We have been expecting USD/JPY to break above $102 (remember all of the Yen negative divergences and $USD positive divergences last week?) So we knew we'd end up here, the probabilities on just about every chart say this move fails and thus it becomes very valuable to short in to price strength and 3C weakness.

Don't forget the multiple trend analysis as well as timeframe and the tone there that also says the market and the FX pair fail, again making it very useful.

The only question is "When does it fail?"...

 From the intraday charts of USD/JPY, they have went from positive last week to negative this week VERY fast and not just on the usual 1 min pairs chart, but on the 5 and 15 min which is almost unheard of.

Almost all of the single currency Yen and $USD divergences that said the USD/JPY goes up last week, have reversed or are doing so already this week, very early this week.

It appears we are seeing the same on the charts of the averages as well.

Take the intraday IWM, we saw leading negative divergences migrate to longer charts all day today like this 3 min which started as a 1 min negative and this is not the only average.

So the question is, does this migration keep up and keep moving to longer charts or is it just for a specific local move? If the first is true, then this shouldn't last long and we'll have a lot of work to complete quickly, but 1-day doesn't make a trend so we will see what tomorrow brings, but that's really about the only question now, just as we knew we'd be in this place last week, we have stronger signals that say we will be below this place shortly with the market in tow.

I'll be looking at details to see if any specifics that help us answer these questions can be found, but as far as trading, the trend is clear, the "Let the trade come to us" concept is in full effect, multiple timeframe analysis is working and multiple trend analysis is at a once in a year or longer area we rarely see. The movement in both the VXX and VIX futures which have gone from 5 min positive to 1, 5, 15 and 30 min positives in about a day are pretty stunning. We couldn't ask for much more except that we have the fortitude to be patience and wait for the right moment to enter, it would be a shame to give up this set up because of greed, or fear of missing the move.

TBT (long) / TLT Update

Last week we saw some signals that TLT would likely be coming down which is good because I like it as a long term trend trade (long), but wouldn't want to chase it and have been waiting for a move to $102 for some time, I think we might get it here.

However, looking very near term it looks like TLT will see a short term bounce, perhaps just some backing and filling (maybe not even that-maybe just early signals like the rest of the market), I decided to hold the position(TBT long, 2x short TLT) as it's the longer term signals that got me in to the position, "Plan your trade, trade your plan".

Here are the TBT charts starting with the earliest that look like a bit of a pullback in TBT on an upside TLT correction VERY near term.

 TBT 1 min relative negative divegrence.

TBT positive divergences at lows and a relative negative divegrence today. I considered maybe trading around TBT by selling the long today and re-entering it, but then thought back to why the position was entered, what the edge was, where the probabilities were and how it fits in to the larger picture and decided that just because you can see a signal doesn't mean it's worth moving positions around for.


The TBT (2x inverse TLT-20+ year treasuries which should pullback on a USD/JPY move above $102) and a large positive divegrence and in line status intraday, the short term negative I suspect are going to continue and will migrate until we are at the reversal point in which USD/JPY and the market fail.


 15 min TBT leading positive and one of the many reasons I decided to go with TBT long.


 And TBT 60 min leading positive.

This suggests that TBT is NOT done and TLT has some serious downside, whether that happens very quickly, that's for the market to show us. If these intraday negative keep migrating I suspect it will happen very quickly.

 TLT which is the inverse or opposite of TBT (the long) has the confirming 60 min leading negative, this is one of the main reasons I liked TBT and opened it and why I like the probabilities of being able to go long TLT around the $102 area on a continued pullback.

 15 min TLT confirming TBT with a leading negative divegrence.

10 min also confirming, but showing some of the signs that I was initially a little concerned with in TBT and whether I should maybe try to trade around what could be a TLT bounce and TBT pullback, I decided against that of course.

And the 2 min TLT chart with a positive divgerence which confirms the reasons I was concerned about TBT VERY near term in the first place, however, the reason for choosing the TBT position was to take advantage of a much bigger move, one that is reflected on 15, 30 and 60 min charts, not intraday charts so I'll stay the course, but it does make me wonder about volatility in the next few days.

NFLX Update

Most of April I really liked what I saw in NFLX for a long play with a dip below $300 to go long, but make no mistake about NFLX, as far as a longer term trend position goes, I have not a bullish bone in my body, it remains a core short position that I'd like to add to.

The idea behind a NFLX bounce that should have better relative performance than the market is that it would also set up a better long term core short position and that's what I'm looking for now./

Here are the charts...
 This is the 4 hour NFLX chart from in line with the uptrend to leading negative distribution in to the top to a leading negative signal currently, any bounce barely shows up here because in the big picture, it's little more than a normal counter trend bounce that you see in any asset that's in a bear market or primary downtrend or even moving that way, it's just not where the probabilities are.

 On a 60 min chart zoomed in we have nothing of interest here, no divergences or anything that would cause me to get excited about NFLX, if I had to make a decision right now on a position I'd go short and stick with it as the probabilities are highly skewed in that direction, but we have better data than this.

On a 30 min chart I highlighted April, you can see why I said so many times that NFLX has been one of my favorite long ideas to outperform the market on a relative basis for "Most of April".

However, since the last post for the last significant set up, a move below $300 (as it is a psychological level/centennial number/whole number) to set up a long position, which I would have expected to spend some more time below $300 and set up a reversal process, instead it hit the stops and orders at $299.50 and then made its move, since then, there have been no significant divergences that I would be interested in playing until the short set up is ready.

 With faster charts we get more details, often more noise as well. This 15 min chart shows the first significant positive in April, a negative bringing it back down and really not another "significant" divergence on a 15 or 30 min chart as far as long positions go. Last week there was a negative divegrence which we'll see more closely in a minute.

This is the 10 min chart, this shows the long set up that would be "BELOW" $300, it wasn't there long, less than a day and just hit the orders like AAPL hit them right AT $600, NFLX hit them at $300 with a low of $299.50 on the day.

While this is a 510 min positive and can be traded, it's not a 15 or 30 min positive. Since, we haven't had any significant divergences and as such I'm waiting and looking for the next set up, short and on a trend or core position basis.

This is the closer look at the negative divegrence last week, a range formed which became very obvious which means, "expect a head fake move before a reversal to the downside" as 3C was clearly negative through the range.  We got the head fake move and then a reversal from about $347 to $315 pretty quickly.

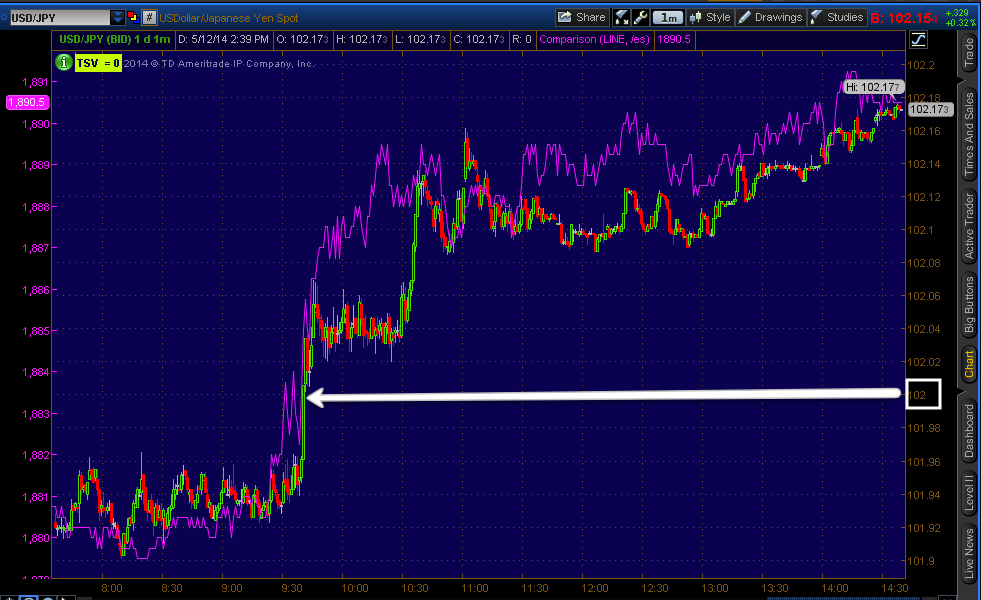
On the 5 min chart we have two smaller positives you can see, this isn't surprising given the $102 USD/JPY level so near by and the probability of it being hit and dragging Index futures and the broad market with it, that happened this morning. You know what we are looking for above $102, distribution in the FX pair and thus in the broad market and assets like NFLX.

Note the small leading negative divegrence today in NFLX.

 The 1 min chart gives us a better view of the intraday action which  is EXACTLY what I want to see to set up the next position in NFLX, that's with the probabilities, short on a larger scale or trend/core position basis.

I sometimes will switch to the blue 3C for NFLX and some other momo stocks in a faster moving market as it moves faster than the orange version, although I like the orange version better for trends. For example, the same 1 min chart in the blue version...
There's some difference in the look, but not at important areas. Where we have an intraday range ( a place we often see a lot of underlying movement), 3C is giving the EXACT same signal, leading negative.


 The 2 min chart gives the exact same signal at last week's range and head fake area and the reversal as well as the smaller positives.

And the 3 min chart is similar to the orange 5 min chart with distribution in last week's range, at the head fake before the reversal, small positives and a leading negative through today like the intraday and 5 min charts above.

I want to see the charts from 5-30 and maybe even 60 min give VERY clear negatives for NFLX before I jump or add to a core short position, let it come to us and once again, what the market does and what the USD/JPY do as well as NFLX itself will be very important in determining the timing of the entry, but I can tell you with about 95% certainty that there will be a head fake move BEFORE the downside reversal, THAT'S WHERE I'D HOPE TO BE ABLE TO TIME MY SHORT POSITION ENTRY FOR NFLX.

USD/JPY Carry Cross Update / Market Update

Last week, the whole week we were watching USD/JPY and the $102 mark, I can't remember how many times it was said, "USD/JPY > $102 is the key to the market right now".

So we saw $102 blown through on the open of regular hours this morning, you can take a look at the FX charts/divergences from earlier today and compare to now if you like, they are here in USD/JPY $102 Update

I'm not posting many if any Yen charts because they are all either in line or moving positive so there is some difference between them now and this morning, but the larger, more noticeable differences are in the $USD and to an extent, the $USD/JPY pair.

As expected, the USD/JPY pair (red/green candlesticks) vs ES/SPX futures (purple) are moving together since the open as we had expected all of last week, thus the reason the psychological level of $102 was so important for us in the $USD/JPY and why we knew it would be hit as it would be pulling price toward it like a magnet, it would also be a great area to create a sham, a bull trap, whatever you want to call it, but we aren't here by accident.


The 1 min USD/JPY shows several intraday negative divergences as well as the ECB comment (I'm guessing it was around the time the European markets opened) and even though we usually don't get very good pairs signals beyond 1 min...

 We even have a 5 min USD/JPY signal which is not common and VERY rarely do we get a 15 min signal...

 However the USD/JPY looks to be largely in line at most areas until we see a move higher where we have a negative divegrence as we expected to see on a move above $102.


As for individual currency futures, as I said, there's so little change in the Yen there's no point in posting them, but they are either in line as some were and some are looking better as we could see earlier today, it appears any movement or underlying action is taking place in the $USDX below.

The 1 min $USDX intraday negative

This 5 min $USDX negative is a much bigger deal and looks a lot like many of the averages, for instance...

The IWM intraday on the 5 min chart and as I mentioned earlier, the DIA...

5 min DIA. I also said the DIA looked particularly bad...

This is the 5 min chart in scale to the shorter of the 3 cycles that started 4/28, remember I said there were at least 3 cycles somewhere either in stage 3 or some variation of late stage 4...

 This is the DIA 5 min chart showing the medium (longer term) middle trend -note the 5 min chart's divegrence. This was around the 11th of April to the 14th (base or stage 1) and finally...


 The February Cycle which is the long term cycle, I can't get all the way back to the 3rd of February when it was still in stage 1, but you see the different stages, "4A" is the shakeout after the initial break to stage 4, again look  at the divegrence. This is what I think is very unique for multiple timeframe analysis and on a larger scale, multiple trend analysis.

Back to the $USDX futures...
 The 15 min chart is leading negative for the new week.


As is the 30 min chart.

The strongest chart for $USDX was the 60 min, it still looks the same as the earlier post today and will be a key timeframe, but it takes a while for a divergence to move to a 60 min chart.


Closing Trading Long FXI position

I'll follow up, this just doesn't have the potential for opportunity I was hoping it would have and a gap fill is looking pretty likely, I don't see any reason to have that open risk out there without the high probabilities of reward matching or exceeding that of risk.

FXP is still a position I'm interested in, I'll post charts of these soon, but for now, I want to clean up and raise dry powder so I'm closing the FXI long trading position.

Larger Market Update

Just to give you an idea of the time we likely have (this will depend a lot on how the USD/JPY acts as it is just holding $102.09 for most of the morning), it's not necessarily a race,, the same concepts of reversal process and such should still apply.

Here are several timeframes of the IWM which also tell us a little more about what's going on with this move, the reaction to the move (how smart money is using it) and perhaps when we'll really need to be backing up the truck, but that's based on signals for individual assets so that won't all be at the same time.
 This intraday chart of the IWM , like all of the averages has deteriorated all morning, it almost looks as if there will be a gap fill,  however, this may continue as part of the larger negative we expected in this area. All of the major averages look like this and/or worse.

 IWM migration to the 2 min chart, leading negative.

 3 min...
We don't have intraday negatives on the IWM< 5 min yet, but a positive at the lows of the 9th which we saw in many different assets.

The 15 min chart here looks similar so as we see migration of divergences from the intraday charts, they should start to deteriorate these charts (5, 10 and 15 min).

 Here's IWM 30 min. of course this is not zoomed out to scale, I'm just trying to show that just because we broke over $102 as we were looking for, we don't have to react immediately.

The reversal process is still a concept that will almost certainly be a part of our set up.

This is an IWM 60 min chart, also where the highest probabilities are and the direction in which I want most of my trades unless I have VERY good reason to do otherwise.

There's a clear top in the R2K, now it's going back to USD/JPY and instead of looking for the positives that will send it higher, looking for the negative that will send it lower as well as the market averages and Index futures, with the added watchlist of our short sale assets, but again, not for a pullback like we have seen the last couple of months, for a primary trend, return to stage 4 which should mean significant new lows like the QQQ below the February lows, etc.

The USD/JPY still seems to be running the show though and the most important asset as each average looks a bit different and it's not the rotation of a healthy market (think about the DIA shown earlier today).


MCP Update

Last Friday I had posted this  MCP Update in which we talked about the continuing positive divergences and the RIMM earnings example. I had posted Friday that we needed to see MCP move more to the side, laterally.


 Here's MCP moving more to the side since Friday, actually since Thursday. The positive divegrence is a positive development, but this could be a dead cat bounce divergence.

This 5 min leading positive divergence is another story, this is the continuing positive divegrence that I want to see, something that may suggest there's more going on here than we realize which makes sense with the base, plus the expected head fake move that never materialized.

 This 10 min leading positive is more evidence of a positive continuing environment.

And here we have migration of the divergence since the earnings gap down on a 15 min chart.

This is the same kind of positive environment we saw AFTER the RIMM earnings missed that eventually led to a major corporate shake-up that sent our shares much higher to a nice profit.

Quick Market Update

This is what I was looking for to happen on a move above $102, remember, "Let the trade come to you, sell short in to price strength with underlying weakness".

This is the intraday 1 min QQQ chart, there's a negative intraday divergence, this is not reason to start selling the Q's short, but so far it is moving in to the more negative charts that were expected on a move above USD/JPY $102, which was the backbone of the set up.


So far the migration of the divergence has moved the 3 min chart to a small negative divegrence in QQQ.

There's still a reversal process, we are still looking for stronger/longer charts to go negative, but this is a great start to expectations.

 This is the 3x short QQQ ETF, SQQQ. Note that there's confirmation as the 1 min SQQQ see a positive 1 min divergence (mirror opposite of the QQQ) in to lower prices today.

And the 2 min SQQQ is seeing migration as the 2 min chart is seeing a leading positive divegrence.

This has been our expectation all of last week and now we are seeing the initial signs of that coming to fruition which is great, but it has all been based on the probabilities represented by the longer term charts, these aren't lucky guesses, they are objective data and probabilities.