Thursday, June 6, 2013

Hot, Cold and a NFP Leak

Well  you probably have heard the news of the day, I heard about this years ago, the G to O to V has had this system in place that has the power to store EVERY piece of information including all Digy_tall since the dawn of mankind, I never doubted it, I'm just a little weirded out about why all of this is coming out at once considering We, the peeps are more apathetic than ever.

I think I'll be switching my Sell Carrier ;) if you know what I mean. Why do you think I write, "F_E_D", because they disclosed they have one of these neat gadgets too.

So could the NFP be "leeked", yeah that's a bit paranoid, the spelling not the subject (but that's the hallmark of a trader, that and superstition) . Um, well considering the F_E_D's mailing list for minutes a day and a half before they're released, my guess would be yes and if I weren't looking at 3C data, I might be a bit more paranoid about the outcome than I am.

In any case, here are a few charts of interest.

Credit leads, equities follow ...
 I'm not changing the thesis put forth Monday, flashed out last Friday and Sunday. The dates of accumulation this week would be the 3rd, the 5th and 6th, the 4th was the "Goodbye Kiss of Resistance" on all of the averages' triangles so I wouldn't expect any accumulation on a bounce and I didn't find any,

This is HYG vs the SPY for this week, retail doesn't trade credit, except we have a few HYG calls, the 3rd it was up, the 5th and today, which was the best day of the year for HYG are in the zone.

Some say the closing ramp of the last 30 minutes was SPY arbitrage levers, specifically HYG and VXX, well whether lever or not, this is one of the biggest Arb. differentials in the SPY model I've seen.

 From about 3:30 to the close, the SPY arbitrage model which is specifically based on TLT, VXX and HYG, went VERY positive at a $1.00 SPY positive (model) differential. Normally I'd think that levers were pulled causing the late day ramp, but remember the model is based on the prices of the 3 assets, not the 3C charts, they'd have no way of seeing those.

So the question in my mind is, was this a ramp (manipulation for the close)?

You my be surprised by my opinion...

This is the intraday VXX, usually if there's manipulation, it's very clear on the intraday 1 min chart, this is just about as weak of a divergence as you can possibly get so looking at the intraday data, VXX definitely was headed down and would cause the arbitrage to go positive, but it doesn't look like "lever pulling".

Instead, remember yesterday I closed a UVXY equity long? There was a reason for that.

This is the longer term 10 min (institutional timeframe) VXX chart, this is why I closed the UVXY position. From what I gather here, VXX/UVXY have been under real distribution this week, not manipulation, it just happens that price action makes it look that way, 3C doesn't';t agree and we've seen a lot of this lately.

What about HYG, HY Credit?

 If we look at HYG, which had it's best day of the year today, we see an important 15 min chart going back the entire year of 2013, we have 3 major positive divergences, you can see all 3 above, the most recent is the largest. This doesn't mean HYG has been under accumulation the entire time of the divergence, it would just mean that the divergence this week has more underlying flow than all of the time in the box, nearly including HYG's highs of the year, so once again, I don't think this is 3:30 Arbitrage manipulation, but a measure of how strong this week's positive HYG divergence has been.

 Here's a closer look, the divergence is largely in the white box, the stuff to the left is showing that the underlying flow in HYG is significantly larger now than it was when HYG was significantly higher, in other words, strong accumulation this week and we know, HYG is one of institutional money's risk assets of choice.

So far it seems like someone knows something.

What about HY Credit, the illiquid type? Here I show why it's called a "Leading Indicator", it didn't participate in the past bounces and the market fell, "Credit Leads, Equities Follow", however this week is the first significant divergence in at least a month.

 Here's a closer look vs the SPX, while the SPX is falling, the illiquid HY Credit that is usually the first out the door when there's trouble because liquidity is so low, is moving higher. This doesn't exactly fit with smart money running scared does it?

The averages?
 Again, not all of this divergence suggests the entire time was accumulation, it does suggest that what happened in positive divergences this week had a higher underlying money flow than the SPY when it was at much higher levels, again suggesting this week saw some serious underlying action in what I suspected would be a bear trap on Monday that has played out exactly as explained Monday.

That's a 15 min chart by the way.

The same is true of the IWM on a 10 min chart. Distribution is clear and so is a very strong positive divergence.

We don't see this often, but that's a 1-day move in the IWM on a 30 min chart, we rarely see a leading positive on a chart this long in a single day unless there's serious underlying activity.

 And the QQQ 10 min.

I think you know what my opinion of events are moving forward, it hasn't changed since Monday.

Volatility...

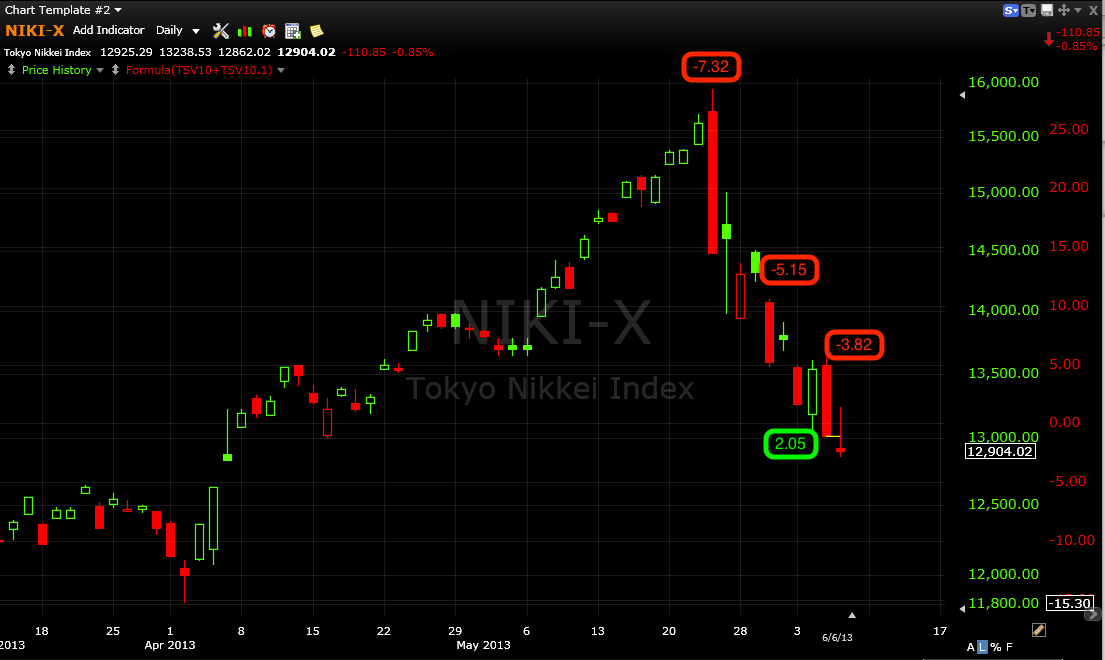
Take a look at Japan's Nikkei
 That's a parabolic climb, it has been insane, but this is why I never trust parabolic moves on any timeframe.

The Nikkei the last  2 weeks now down 20% with a 1-day -7.32% move, now that's volatility!

It looks like downside volatility has run out, it would be interesting if the Nikkei bounced tonight.


Now, you can see from my last post if you are unsure of my opinion, but basically, set up retail to get them emotional, bearish and short, then swing the bear trap door shut and squeeze them sending the SPX to if not a new high, a very impressive one and then create the same in reverse, a bull trap that has its door shut (we aren't there yet, maybe we start tomorrow) and that sets up the real and definitive break of the market lower.

Just to give you some idea because I've been talking this week about the immediate future, but I've been making the bear case for some time and quite strongly so I don't want there to be any confusion. I looked at breadth indicators tonight, every one was hitting new lows for the year, here's just 1 example.

 This is all the percentage of all NYSE stocks above their 40-day moving average (green) vs the SPX (red). In a healthy rally the percentage should rise, in January the percentage of NYSE stocks was 85%, it went down from there, yesterday , even as the SPX sits near the all time highs for the year, we had the lowest percentage of the year, less than 36% of all NYSE stocks were above their simple 40-day moving average, that's a market ROTTING from the inside out so have no doubt about my bearishness on this market, it's just when and where are the proper places to enter and/or exit positions?

As far as the 3C charts in the trend timeframe of 2 hours, I think the chart is self-explanatory, that would be a new leading negative low for the year and done in less than a month.

Any chance I have to short quality set ups at higher prices, I'd be taking and I think this will be the last good opportunity to do so, if all goes as I suspect, this will be a gift.

If all goes according to plan, sell the calls on a pop higher, a strong one and then set up shorts or fill out partial positions, after that it's mostly management and dealing with those killer counter trend rallies that either make you a lot of money or take you out feet first.

After Hours Should Be Interesting

To do a quick recap and you can read the entire posts for yourself as both that dealt with the overall scenario are both linked in this post from earlier today.

A quick recap (and virtually nothing has changed since it was first laid out Monday, fleshed out Friday and Sunday before that)...

The general idea here is that Technical Analysis is so predictable that it is used against technical traders every day in every timeframe as the market is fractal, meaning the same patterns you see on a weekly chart act the same on a daily or even 5 min chart, it's just human nature and emotion. A daily (longer trade) is no less emotional than a short term options play.

Most traders came to Technical Analysis when the Internet became a household staple and cheap online brokers were everywhere. The appeal to all of these new technicians was simple laziness and they've gotten worse since the late 1990's. For example, a H&S top is said to be one of the most reliable patterns in Technical Analysis, I agree that it use to be. This pattern is so simple to verify, but it is essential that it is verified using volume analysis. Traders have become so lazy that they see something that looks like a H&S and assume it is, they don't verify the volume, some don't even care that the pattern is found in a downtrend, they still see it as a top even though a prerequisite is that it be preceded by a decent uptrend.

Prime example of a H&S that cooked a lot of shorts in 2010, early in the trend...
So it looks like a H&S top, the one to the right was a H&S top because QE1 was ending and there was no announcement out re: a replacement program (it even hit its pattern implied price target). These traders didn't bother to verify volume which is the most important thing in confirming a H&S top and even more so in a H&S bottom, there was a little head fake move that lured shorts in and that was that, just laziness.

The SPY and other market triangles shown today (as well as Monday/Tuesday-again linked above) are too big to be consolidation/continuation patterns. My prediction was, technical traders who see a triangle don't care about the size, they assume it's a bullish continuation pattern and even though it seems like a life time ago, it was just a week ago that everyone was still a raging bull.

My prediction was that the triangle would not breakout or breakout and fail and Technicians would go short as I put it in this post from Monday,

"When a technical pattern fails, TA teaches to reverse your position which means they all went bearish as our earlier sentiment report made clear, THIS IS LITERALLY WHAT T.A. TEACHES TRADERS!"

The fact that this pattern worked so well for me is proof enough it was a set up. These failed bullish (or bearish) patterns are what use to be an easy short, you'd wait for a return to resistance (especially on H&S tops) and when you confirmed that it failed to break resistance (in this case the lower triangle trendline or the apex of the triangle) you sell short, it use to be a low risk trade entry. The thing is, these patterns haven't worked since 2003. In fact, one of our best short entries on a H&S top is wait for the break down, wait fro the test of resistance at the neckline and then wait for price to blow through resistance shaking out all of the shorts, then enter as that move starts to fail.

So we have our shorts in place, as admitted Monday, this is the general idea, specifics are difficult,

"*This is what I see as the most probable outcome, some details may differ a bit as there are a lot of dynamics in the market, but that's the gist of it.

Now we have seen this so many times that this is why it is what I'd expect, but the market is as dynamic as anything you can imagine, millions of extreme emotions all being pulled in different directions and we have a big hedge fund, SAC capital that has to sell a lot of stock to meet redemptions, so while this is what I expect, if I see something change or something different, I'll let you know." 

The only thing that is different than what I expected was the degree of the volatility, but the point of the set up is to change sentiment, to turn traders overwhelmingly bearish and these moves are almost always more extreme than you anticipate, especially when 1) volatility in increasing and 2) this may indeed be tied to a specific dat such as the NFP tomorrow.

However to be honest, looking back o the pattern now, it seems very reasonable in the downside move.

From the yellow arrow to yesterday's closing lows, that'a -2.75% move (through today a 1.89% decline), the Nikkei is putting in 9% intraday swings and -7+% 1-day declines, this really is not an unusual decline given increased volatility.

So nothing at all has changed since the concept was laid out Monday (perhaps even Sunday and the previous Friday). 

I don't think this is the final break as the Trend Channel is still in play, I do believe the ultimate decline will be much bigger and more volatile, but I still think the same concepts from Monday are in play.

The Trend Channel hasn't been broken with a close below the lower channel so it is still in an uptrend according to the market's normal behavior over this timeframe. You can see volatility has increased substantially below the price window.

The idea is still this...

A) Is the triangle that proceeded an uptrend, when a symmetrical triangle does that it is considered a "Consolidation/continuation" triangle, this is one of the most basic price pattern concepts in Technical Analysis and why I think they chose a symmetrical triangle, because even a novice technical trader would be familiar with this pattern.

*The problem with the triangle is it's too big, a consolidation triangle is rarely more than a few days, larger triangles are tops and bottoms depending on the preceding trend, but even this one alone isn't big enough to be what I'd consider a top by itself.

B) When the triangle failed to breakout to the upside it was considered a "Failed" price pattern, as mentioned above, one of the basic concepts of Technical Analysis is, "When a pattern or indicator like a MACD divergence fails, reverse your position", that would take bulls and turn them in to bears. 

C) Is a concept that worked well before 2000, before TA  became mainstream, the "Test of resistance", a failed test is your cue (according to T.A. dogma) to enter a short trade.

From there we only had 1 day down, so looking back, this decline wasn't unreasonable at all, I think even I may have got a little "lost in the lines" of intraday trade.

D) People believe in oversold and overbought markets, they believe that these conditions have to be worked off with a bounce or correction, I do not believe in this, at least not any more. I have backtested EVERY trading method / system I have ever read about and have had the ability to re-create in StockFinders, "BackScanner". I haven't found 1 system that is reliable in a robust way through various markets. The only two systems I have found to have some use are a long term moving average system that would typically have about 1 trade a year, but I believe no one would have the emotional discipline to stick with it through draw-down periods and the second system that has had excellent results is using a longer Stochastics and going and staying long when Stochastics are "Overbought" and embedded above 75 and going short when Stochastics is oversold and embedded below 25, this is the exact opposite of the way you are suppose to use Stochastics, you are suppose to sell when overbought and buy when oversold!

The point is... Overbought and Oversold are outdated concepts, in my view the only reason for a move down like this is to create an emotional shift (and that happened in less than a week on a 2.75% decline so its not hard) and that emotional shift is used as a set up to a larger trade. 

E) In this case, all of the retail shorts act as fuel in a short squeeze to run the market above the triangle, creating ANOTHER emotional shift in what will likely be a stronger, more volatile move that will turn traders bullish again.

F) As we have seen, retail can rarely see or think about what is happening more than a day ahead, they are swayed by the moment. If we get a 2+% day up with a candle that looks like this...
(By the way, a candle like this sorry looking one I drew in, is less than a 2% move)
...watch how quickly traders turn from bearish to neutral or bullish. If you don't think a candle like this can occur in a day, consider the volatility indicator above showing increasing volatility, think about this entire pattern being set up for this very reason, short covering fuels the advance, it can easily happen.

After we have again swung sentiment and traders have been ground to pieces, we have the fuel needed to create the downdraft at "F" and I'd guarantee the Trend Channel will be broken.

For our purposes, we already have built a lot of short positions meant for this move, there are some that I and each of you want to fill out, for example AMZN or GOOG. The extreme in sentiment sending the market higher, fueled by short covering is simply a tactical opportunity or a gift that allows us to finish initiating or adding to positions for our longer term strategic out look. The "Call" positions from this week are a secondary trade, they hedge shorts, they make money as hitchhikers and when they are closed, we know we are in the area in which we can finish our strategic planning/positioning.


As for tonight/tomorrow and next week...

I honestly don't know what the catalyst is, from the timing and the way the market acted today when the USD/JPY fell hard and the market failed to make a similar fall and then advanced from the lows to close green, I'd say we are at the catalyst.

Tomorrow's Non-Farm Payrolls (NFP)?  NFP is released by the BLS (Bureau of Labor Statistics) at 8:30 a.m. tomorrow, this is a huge once a month event that is already well known to have leaks in fact, the BLS is installing new press computers to mitigate leaks so the press can continue to write articles on the embargoed information before its release while reducing the chances of a leak, I'll leave my tin-foil hat off for this one.

We already know the F_E_D clearly leaks material, they even have a mailing list of who to leak it to such as the minutes sent a day and a half early to 154 big banks and private equity trading firms. A Mailing list? Really?

Expectations for the NFP... There's consensus and then there's a whisper number so it's impossible to say how the market reacts, but anything that comes in weaker than expected is the "Bad news is good news" effect for the QE crowd which will take it to mean the F_E_D can't back out of QE later this month at the June F_O_M_C meeting. A better than expected report will likely raise expectations that the F_E_D will begin tapering and the market won't take that well.

I don't know what it will be, although from what I've seen the last week, it seems like the market will respond well. Yesterday I said the most effective short squeeze would be  a gap up, with the data out an hour before the open, that is a possibility and any covering in pre-market would just make the gap bigger as it is a less liquid market with worse fills.

It's possible that the market reacts horribly at first and then reverses, anything is possible. This is why I'm curious to see if there are any give-aways in after market trading or in overnight/pre-market trade.

Where we are now... From Equity Index Futures, it seems likely to me that after hours trade will see a decline, here's why...
ES, TF and NQ all have 1 min negative divergences like this, this means little to futures overnight as they have many hours to flip back and forth, but it could mean something to sentiment in after hours and pre-market trade in the equity market.

However, whatever may happen overnight or on the NFP release, I'm not concerned.

Other than all of the data collected all week in the market, these charts give me confidence I'm on the right track-ALL Equity Index Futures have these divergences to different degrees, but they are all focussed on this week in particular.

 ES (SPX futures) 15 min chart which is a very long timeframe for futures is positive throughout the entire week!.

ES 30 min which is even more important is again positive and it is primarily this entire week.

NQ, NASDAQ 100 futures on a VERY long 60 min chart are positive throughout the entire week.

Don't get me wrong, there are plenty of charts that show this market is done, baked, fried, OVER, however, one bridge at a time.


AAPL

Today's AAPL call is also at a decent profit for the move, I'd consider this as well.

This was a pretty large 1-day move in 3C from 2 to 15 min just today.

 2 min

15 min at a new 3C high just today

AMZN

I can't add anymore to this call, it's just not responsible, but if I could, I would right now. I'm not worried about it at all.

Many of you know this is a core short equity position, it's also one I've been waiting for, for some time to add to, but I've wanted a move at least >$272.50 to consider it. I think we'll get the chance

 Lots of growth in 3C lately.

 This 3 min has done an excellent job calling a tight, volatile market here, its flying today.

Same with this institutional timeframe.

I would consider it a long as well in equity form, but you aren't going to get the same move, but much less risk.

Other Calls

The XLF and IWM calls are doing great, I'm almost tempted to take profits on XLF here, but I'm not going to. I wouldn't be adding to these, in fact I think we are right at the point in which even buying FAS is a little late.

URTY (IWM 3x long) is close, if it pulled back a bit in to the close I might consider it, but the time to get in these or the best time has kind of past.

I do like AMZN a lot here, I'm going to post some charts.

GOOG / NFLX

I was asked what I think about GOOG/ NFLX calls, I actually still love them here, I prefer June 22 expiration, but I'd take more on if I could here without violating too many risk management rules.

 GOOG 15 min I have liked since before this started, it's a large base area, the head fake is clear on this chart (today).

NFLX also has a decent size base area behind it, I like them both.

I also want to short/ add to shorts in both at the right time.

Charts From the Last Market Update

Here's the SPY, note the intraday negative is the weakest kind  and only on the 1 min chart.

 intraday 1 min relative negative divergence, I think this is just to slow the SPY down here.

 The 2 min chart, next timeframe isn't effected at all, you'll note the accumulation at the lows, again it's because of good prices and lots of volume.

If the entire idea of this set up is to get retail bearish and short and then use them in a short squeeze to push prices above the triangle, you don't want them getting nervous and covering, they are your fuel so you don't  want this downtrend line broken too much, certainly not a higher high.

You want to keep them in place right up until you pull the trigger.

Market Update

The market is being purposefully held back here on an intraday basis, I'll post some charts.

If I didn't already have enough long exposure vs the short exposure which I want to be the main bulk of my exposure, I'd be adding right now (spec size) to leveraged long ETFs like UPRO, TQQQ, URTY, UDOW, FAS, TECL, etc.

I don't think you need 4 market averages, I like the SPY and IWM (UPRO/URTY), if I had UPRO I'd go a bit easy on FAS as the SPX has decent financial representation, the same as if I had TQQQ (Qs 3x long) I would go easy on TECL (3x long technology) because the Q's have so much exposure to tech.

I still want my portfolio at about 75% of core short positions for the bigger picture, I'd want some cash and the rest (which all depends on your risk tolerance), I'd personally want to take advantage of this move, but I wouldn't blame anyone for sitting it out and waiting for the bigger move to set up and that is shorting core positions in to higher prices; That's the main trade and position, the longs are hitch-hikers that make extra $.

Pulling it Together...

I'm going to try to do this quick, I don't know if there's a leaked NFP or not, maybe it's bad for the market and we see that until the open, all I can say is unless they lost total control, which it doesn't look like they have, they intend to take this market higher, good or bad NFP, a bad NFP would be good for the market and that may seem too obvious, but the SEC never does anything.

As far as the move, increased volatility cuts both ways, this is why I compare the market to a pendulum, it swings way too far one way and then way too far the other.


Starting with the expectations we had and I still believe are in play, in essence, this to me is a bear trap worthy of a top after 4 years of manipulation-everything in the market has a scale or rhythm to it. I'm going to Bold highlight the Key parts of our analysis from the start of the week below.

From Monday, June 3rd, "A Little More Color on the Day"

"there's no significant reversal on any timeframe as the market is fractal in nature because humans always act the same; I can't imagine the market dumping without a decent head fake and that means above the triangle that the SPX broke under Friday- the one we are very close to testing or what use to be the "Kiss goodbye" before Wall St. started using Technical Analysis' predictability against its practitioners."

From Tuesday June 4th, We're also Just about at the Triangle Resistance

"As I mentioned yesterday, traders expect this to be a "Kiss the triangle goodbye" test of resistance so quite a few will short any sign of the market pulling back from that area and I believe the market WILL give traders what they expect, at least long enough to pull in some shorts which the market will need to break above the triangle on short covering.

If the market heads right through it without any kind of look of "failure", I'd be surprised so I mentioned this yesterday, if you see it, don't be surprised."


This is what I said above (before it happened) materializing in the market.

All 4 averages have the triangle and the kiss I said the "Market would give them", in the posts linked above I get more in to the psychology of this set up / bear trap, I think they are good to review, but for now the excerpts above should be enough.

 DIA Triangle and the kiss at the yellow arrow, this is very rare now-a-days because it's such a classic pattern it gets manipulated so often, but in this case they needed traders to buy it (buy the set up), rather to sell it short, so a failed triangle that didn't breakout and failed exactly at resistance is TA 101, it's a part of a much larger trap being set.

You can see DIA has been accumulated by someone and it's not retail as price has moved lower.

IWM has the same kiss at the yellow arrow, again smart money on a 15 min chart is accumulating lower prices, why would that be?

 QQQ, same set up, the apex of the triangle is resistance here, it's accumulated too in to the decline, this is exactly why I've been opening long positions, I find wherever the first divergence starts, even if price drops significantly below that, the reversal sees price well above the first divergence.

 The SPY is the best example of the kiss, the accumulation, the entire bear trap. NOTHING has changed since I posted my theory Monday and that was before we saw the kiss, again read the posts linked above to see why I thought that, its an important concept in understanding what is happening here and an important market concept.

 Financials -I didn't draw in the kiss, although I'm sure its there, the accumulation is what is important.

The same with Tech, these are 2 of the 3 pillars of the market, Financials, Tech and Energy.

During this period, the asset we use to judge institutional sentiment is NOT falling as you'd think, it's rising, it's being bought in anticipation, this is a leading indicator.

Even stranger is the illiquid High Yield Credit, this is the first to drop, "Credit leads, stocks follow", it's the first to drop because of the low liquidity, but it is rising throughout.

HYG Credit accumulated, this is the asset they'd put most money in to.

This is the normal SPX (red) vs Yen (green) inverse correlation from yesterday, this started working intraday a few weeks ago.

Note today's Yen move, the SPX should have been hugely lower.

Then the SPX rises in to a flat Yen.

To give you a better perspective of just how low the SPX should have fallen today...

That's the Yen in green today spiking, the SPX should have had a similar size spike down.

This is what I pointed out before it happened, now it has happened and confirmed in 3C, it's definitely volatile, emotional, but that is the point of these moves, get everyone bearish, it will be just as volatile and emotional on the reversal and seem like it will never stop until everyone is bullish. 

This is why I have been adding longs and have no problem holding them.

USD/JPY Update

Intraday both the USD and JPY have shifted and look like the pair will either  consolidate or pullback here. The signals in the single currency futures are moving pretty fast, I think the last update I did was 30 mins ago and they already look different.

I'll let you know if anything changes beyond that as this is probably the most important driver of risk, but that doesn't mean it's the only clue out there, for instance credit acting the way it is today is very strange, this isn't an asset retail trades, it's an asset known to be the choice for risk on moves by smart money. HY is moving up, HYG is up +.20

There are a lot of other signals out there, but those two REALLY stand out.

AAPL Update

It actually took some time for the AAPL 2 min divergence to migrate to longer timeframes, it kept building stronger on 2 min, but the migration is more important, then bam, it's touching out to 15 min.

This isn't short covering,  it isn't retail buying on 5-10-15 min charts, I'd guess shares were picked up where there was cheap prices and lots of supply, the one place retail traders never suspect smart money to accumulate, while it is the most intelligent place to accumulate, people just get use to the way they do or see things and don't imagine anyone does things different.

It's kind of hard to believe Non-Farm Payrolls doesn't have something to do with this, discount the market right up to the day before, swing the USD/JPY to the biggest dump in 3 years on no news and maintain positive charts through the entire thing? I don't know, but I do know it wouldn't be the first time, the Government is building a new press facility to prevent leaks because they know and admitted there have been leaks, then you have the F_E_D sending out that email a day early to 154 of Wall St.'s biggest firms.


 The 2 min AAPL chart that started it all

Migration to the 3 min

Migration to the 5 min

the 10 min is now seeing migration so we now have a fairly big move in a short period of time...

And the 15 min chart is starting as 3C makes a higher high.

You know the gap theory, a big gap on the open I was talking about yesterday? Well NFP is at 8:30 tomorrow a.m.