Friday, December 23, 2011

Keep AAPL on your radar

 AAPL is underperforming in the afternoon today...

Should it keep up at these levels, it will form a bearish shooting star reversal candle and above local resistance (false breakout) , a move back below the $395 area will likely snow ball AAPL down to at least the $365 area.

Market Seeing same sharp 3C drops as Financials

 DIA

 IWM

 QQQ

SPY

Many of these are single day drops or since yesterday as price starts to round over. Usually one of the last things seen before a reversal in trend is a head fake move, I think the SPY/SPX wedge breakout, which has now broken back below the apex of the wedge or breakout point, probably qualifies.

Confirmation in Financials

I had a member ask me about FAZ and I found the chart so compelling, I wanted to post it for everyone.

First remember that 3C stands for "Compare, compare, compare". The more confirmation you can get, the better your signal is. One chart showing something is great, if all the timeframes or a majority line up, but when you can compare other equities and get the same confirmation, you are really making use of 3C the way t was intended to be used (Not everything you see in 3C or any indicator means something, it's confirmation that makes the difference). Also remember there are 3 main legs on the market's table, Energy, Financials and Tech, of course the other 7 main industry groups are important, but the market can't get far without these 3.

So here's comparison and confirmation in financials.
 Here's the short term on XLF today, t has turned down sharply and remember there are a lot of crummy financials that funds want off their prospectus for the new year, that's why I said any strength in the market and financials will likely see distribution, especially in BAC. I don't think anyone can argue that thus far, the Santa Rally has been a dud, yes, we had a bounce, but nothing out of the ordinary. As for window dressing, today is Friday, Monday the market s closed and Tuesday is the last day they can make trades for 2011 settlement and most everyone will be gone on Wall Street until the new year.


 XLF 5 min as it rounds over.

 FAS, being the leveraged long on financials should look like XLF. Look at the 2 min chart just fall apart today.

 And the 5 min is similar.

 The 15 is also going negative


 FAZ is the financial short, there are some stronger signals here and I believe it is because in FAS you will see selling, but not so much shorting as FAZ will be used to express a bearish opinion in Financials.

 Look at that 2 min chart!

 And the 5 min is similar to XLF/FAS except inversely as it should be for confirmation

 The 15 min chart is now starting to see the strength that has started in the shorter timeframes bleed in to this timeframe.

And 30 min, it looks like it has been basing for a while now.

I might have to look at adding to FAZ here.

USO Update

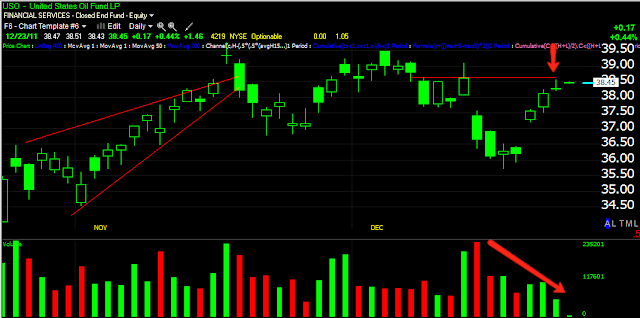
USO is heading lower on what looks like a failed move above some local resistance, buyers bit on the breakout so the level was being watched. The Euro also looks like it's at a transitional intraday point, that won't be helpful for USO.

NYSE TICK Chart Breaking lower as well

Surprisingly for the price gain, the TICK chart has been very tame with no +1250 readings as you would normally see, right now it just hit a very volatile 1 min pop and is breaking the trend.
I may give that TZA long a shot

Update

 SPY 1 min is dropping pretty quickly from the area that I would consider the Wedge breakout. The breakout also peaked above the 200 day moving average and the intermediate term trendline, so there are 3 things that traders would be watching there, making a head fake breakout all the better with 3 different metrics.

 The 2 min is also dropping fairly sharply from that same area.

And the 5 min has been leading negative throughout the apex of the wedge.

About that Wedge...

 Here's the wedge (bearish Ascending) I mentioned earlier and said watch for a breakout (the pattern is too obvious-according to Technical Analysis it is supposed to fall right at the apex, this s why these almost always break out, 4/5 times head fake false breakouts).

 I would consider that a break out...

 ES went negative right in the area...

A longer view of ES shows the extent to which it went negative.

Watch for a reversal...

Market Twain

"History doesn't repeat, but it does rhythm" This could be said to be especially true of the stock market because the two dynamics that move the market are.... supply and demand? Sort of, but really it is perceptions via Fear and Greed and the market has shown over and over that Fear is the stronger of the 2 emotions as it took nearly 5 years to build the last bull market starting in late 2002 and about 18 months (most of the decline was in 8 months) to tear it all down and then some.

The Japanese figured this out centuries ago in rice trading, thus we have Japanese candlestick charts which are nothing more then a daily visual of human emotions, that's why they have worked so well for centuries.

You could certainly say the market now has a lot of similarities to the market in 2007-2009 (mostly in 2008 though). We have liquidity freezes in the traditional and shadow banking system, we have a toxic asset (sovereign bonds) that have tentacles running through the entire global financial system, we have seen some failures that are similar to the failures of Lehman and others, like MF-Global, the difference is this time it's not the US where the majority of the problems are that effected other nations, but the EU with the same effect.

The scary part is between the 2008 hurricane and now, we haven't done anything but kick the can down the road. The fraudclosure crisis is still lingering, unemployment is still persistently high despite over a trillion dollars of stimulus and other programs, we have more TBTF financial entities instead of less. Remember when AIG nearly collapsed, that's somewhere along the lines of Bank of America that has its tentacles in 1 of 2 households. Instead of making the situation less dangerous and breaking up these huge financial institutions, the F_E_D and treasury actually merged them and made them bigger. Worst of all, we are not just talking about a bunch of banks failing (although that is on the plate), we are talking about an entire continent failing and taking everything within the borders down with it. We aren't starting from a position of strength, GDP is not getting better, the F_E_D's balance sheet as well as the ECB's is stretched, especially the ECB's at 30x leverage. China is not the growth dynamo that it was and instead is facing its own 2008-like crisis. Emerging Markets were supposed to save the day, they didn't.

I could go on about the similarities, but I wanted to show you this chart of now and 2008, I used this exact chart and same time period to help predict the October rally and the end of the October rally and I've shown it many times to help members anchor expectations and see the bigger picture.

Here it is...
The two tops are very similar, so is the counter trend rally, I put a red arrow to denote where we are now and where it correlates to 2008. Of course it would be silly to say things will play out exactly the same, but it's scary how similar they are, the white arrow is the first low off the late July 2011 drop in the market which we had said would halt and bounce higher about a week before it did, when everyone else expected the market to keep falling. There was a second low both in 2008 and 2011 at the end of the white arrow, this helped (along with 3C) to predict the strong October rally and the same price pattern in 2008, with the same trendlines and moving averages (which were nearly identical), helped to establish the top of the October rally. Remember in the last post I said it took about 18 months from the 2007 top to erase the entire previous bull market, but about 8 months did the maximum damage, that 8 months started right about where we are now, at the red arrow in 2008.

Ascending Wedge

There's a pretty well developed ascending wedge in the market right now, this is a bearish pattern, often head faked.
Volume is correct for the pattern as well.

John Paulson's Flagship Advantage Plus Fund Down 52% on the year

This is arguably one of the better hedge fund managers out there, certainly one of the most famous. His Advantage Plus fund is the flagship of the line of funds Paulson manages. Reuters confirms that Paulson lost another 9% in December sending the yearly loss to 52%.

Two of Paulson's worst bets, Bank of America and the infamous fraud plagued Sino Forest. As  pointed out yesterday, the average hedge fund is underperforming the S&P and is down about 4+% on the year, not a good year for Hedge Funds, but losing half of the funds under management for Paulson, has to be a killer for the Hedge fund industry.

As I have speculated, GLD/gold may be suffering for this very reason, one of Paulson's (formerly) better performing funds was his gold fund in which Paulson was the largest holder of GLD with 20 million shares. With redemptions coming in as very few investors are willing to pay the kind of fees Paulson charges for loosing half of their money, it is very likely that Paulson had to turn to his gold fund and sell, sell, sell to meet redemptions. This is why I question whether GLD is in a bubble top or an intermediate top.

Still Paulson likely earned about $600 million in management fees at 2% of AUM.

I guess even smart money isn't always so smart.

More Bad News For the ECB's LTRO

If the record amount of cash deposited  at the ECB for 2011, a large part, nearly 24% for the entire year coming in the days following the LTRO, wasn't bad enough, further evidence that the Centrally planned, cash for crap LTRO has been an utter failure (a carry trade buying Italian and Spanish debt was the plan and best case scenario), Italian BTPs have now crossed the 7% mark today. What does this mean? For 1) The LTRO didn't have the intended effect because Italian yields would be falling if banks were using the money to buy debt and 2) 7% is the yield that is considered absolutely unsustainable and it is the same yield that forced Greece and Ireland to seek bailouts as there was no way they could afford to go to the market for their funding needs at 7%, they would have and still may, defaulted.

So now Italy is back above 7% and the Euro is just shy of the $1.30 mark, watch for the market to get jittery.

USO Update/ Trade (short)

Wall Street will want to keep Crude up as long as possible, otherwise it puts downward pressure on the Energy complex which is one of the 3 main pillars of the market (Energy, Financials and Technology). However, I like USO as a short candidate right here, here's why.


 USO is hitting resistance and volume has been terrible on the bounce. I'm sure they'd like to run a head fake above resistance, but if the Euro keeps moving down, it will be hard to do that.

 Here's today's divergence in USO and the Euro, you see how closely they are correlated, so I don't expect the gap to last long between the two.

 USO 1 min this a.m. is going negative.

 The 2 min as pointed out yesterday is already in a leading negative position.

 As is the 5 min

 And a severe leading negative on the 15 min is the decisive chart for me.

 Long term the 60 min has been in a leading negative position and this is why I have kept my longer term shorts in crude open.

 Here's the 15 min Trend Channel that I showed you yesterday that has held the entire bounce, note also that ADX is turning/turned down from above 40 signaling the end of the trend.

A close up of the Trend Channel shows that the Trend was broken yesterday as prices dipped below the highest level of the lower channel, which is a stop out on a long position.

Euro divergence

 The market is diverging way from the Euro ( they usually move together).

 This is causing a little underperformance in commodities.

And financials momentum are seeing the start of a divergence way from the S&P

Operation LTO Already a Failure?

The European Central Bank conducted their rap for cash 3 year loan repo operation earlier this week in the "hopes" that the banks would take the 1% loan and buy sovereign debt from countries like Italy. In fact a few days ago I posted how Italy had lied saying their banks would use the money to buy Italian debt, but after the operation, the Italian banking regulators said t would be illegal for them to do so.

In an ironic twist of fate, the ECB actually ended up with $40 billion in Italian BTPs which were posted as LTRO collateral by the banks, but even more stinging is the latest ECB Deposit Facility numbers. The Deposit Facility, where banks park cash at the ECB as a safe haven (like we saw earlier in the week with the US Treasury issuing 4 week paper at 0.00% interest with 9x more potential buyers then paper for auction as banks rush to the safety of the treasury, even if it yields 0%) saw an increase of $82 billion the day after the LTRO was conducted, that's a lot of the LTRO money which netted out to be $220 billion, this is the worst possible outcome for the ECB's hopes in conducting the LTRO and was predicted by everyone. The newly deposited LTRO funds also brought the ECB's deposit facility to a new 2011 record high of $347 billion dollars ($82 billion came right after the LTRO-coincidence?).

Here's what the Deposit Facility Balance looks like now...
The unintended consequences of monetary policy, no lending, no buying of sovereign debt, no thaw of the liquidity freeze- just banks trying to protect their newly found free money from the probable collapse of counter party banks.

Don't Forget TZA

I featured TZA as a long candidate yesterday, it's a leveraged inverse ETF on small caps, the Russell 2k for a second day is already lagging the market and TZA should benefit from weakness in the R2K.

Early Market Update

The market is leaking lower following the Euro nearly tick for tick, remember yesterday's late day volatility, this kind of change in character is often a sign before a change in the market.

 DIA 1 min showed us a strong leading negative divergence especially into the late day volatility.

 The 5 min leading negative divergence confirms what I have thought about this bounce since before it started, 1) it would be Euro based 2) it would be used to sell for end of year window dressing.

 QQQ 2 min

 QQQ 5 min-both confirm the same, confirmation is what is most important in 3C.

 SPY 1 min

 SPY 2 min

And a rolling SPY 5 min.

ES Update

ES quietly followed the Euro higher last night to the highs just before the European open, after the European open, it was downhill from there.

There was a negative ES divergence into the highs, the second test of the highs that failed was the European open. Note in the white box some extreme volatility, this is when US Durable Goods printed worse then expected.

3rd Time is a Charm?

As described and predicted yesterday in this post... We saw overnight the 3rd triangle/head-fake breakout-failure of the Euro, that's 3 days consecutively now and at each break out the longs think the Euro is going to stabilize and it gives the long $1.30 a crowd demand to sell in to, which was the premise behind this entire Euro bounce idea a few days before it even started.

Here was yesterday's chart in FXE (because the trendlines are cleaner)
 And here's what I said in the post linked above from yesterday: "This is the 3rd in 2 days, the last 2 have been false breakouts, I think this one will do the same,"


Here's the EUR/USD presently, the triangle from yesterday at the left, the break out in green and the failure at the right. Just like yesterday's late day volatility, it looks like every point of strength is being used to sell in to.