Monday, October 28, 2013

Daily Wrap

This will be pretty quick. The SPX makes a new all-time high on some of the most dismal volume you can imagine and a 0.15% gain with no support from the Russell closing in the red and the Dow and NDX both closing up 0.01% which is just ridiculous, I'd venture to say, "Don't look for a follow through day tomorrow.

All of the averages closed with bearish reversal dojis and as mentioned, tiny volume.

I said Friday I'd think today would be a 3rd day of noise within the trend as it was and that likely by Tuesday we'd start to see some downside action, I think I'll stick by that, the wild card I think is whether the PBoC conducts their Tuesday reverse repo overnight, I'm betting they don't, at least not until they hear what the F_O_M_C has to say Wednesday.

Sentiment took a sharp downturn in both indicators around noon time so that's indicative of a leading indication lower, Commodities fell on the open, but worse through the day. As a matter of fact, I think commodities are a good proxy for what a lot of indicators look like.

They were in line with the SPX the last 2-days and today just fell out of bed, many leading indicators or 3C charts like credit, VIX futures, etc. all have the same traits to different degrees.

As for currencies, the $AUD may flip flop around a bit, but I'm going to say trend wise, it has more downside to go and probably fairly significant (short FXA to play that trend). The Euro seems to be topping right in the $1.38 area, since the EUR/JPY has been leading the market I suspect this won't be helpful in supporting the market.
 EUR/JPY in green/red candlesticks vs ES on a 5 min chart, the FX pair has been leading as a risk on carry trade.

Today the FX pair fell short and the SPX ramped just enough to make a new closing high, but well off intraday highs and there's no FX support under ES futures right now.

I can't get a long enough look back at the Yen, but longer term it has a base and a breakout level around $10.60, I think when this happens, the entire market structure collapses on record margin and all, the downside is just impossible to forecast as its like the perfect storm with HFT liquidity disappearing, record levels of margin, and a globally sick economy, we have no model to compare this too except 2008 and I think it's fair to say the F_E_D has blown a bubble that will make 2008 look tame.

Finally the $USD has a small base it's been building since last Tuesday, it put in some upside today and even though it should jiggle around like everything else as there are few straight lines, I'd say the base is large enough to support a larger $USDX move higher.

Gold which I like a lot longer term is definitely in the zone for a pullback, that should make for a nice new trade entry after a pullback with confirmed accumulation. Silver's longer trend looks the same as Gold's, but in the near term it's harder to read, I suspect it will act similar and gold miners should hitch along for the ride with gold.

Finally I think we'll see that TBT long pay off very soon and then we can look at a TLT long...
 TLT's larger 60 min base is very supportive for much higher prices, but...

near term intraday charts all look like a pullback is in the cards which is good as I'd like it around $100 or so and the TBT long will move up on a TLT pullback.

That's it for now, I'll check futures later tonight, but I don't expect any big surprises, remember the F_O_M_C 2-day meeting starts tomorrow.


USO Position Update

Friday I posted on USO and my opinion was USO and Brent crude were both headed for upside. Today USO closed up +0.65% and 1.72% over the last 4 days. I was asked by a member today whether I'd add to USO right now (today) and my answer was, "No". At the time he asked (early today), USO was looking great, but my opinion was USO still needed a stronger base and it is there that I'd ass to USO. (Please see Friday's post for the larger picture).

Lets take a look at the update because I think this can be a very lucrative trade, more so with a little leverage and I think a high probability, low entry with low risk is right around the corner.

I've been expecting a decent move in oil, this is Brent Futures 60 min leading positive.


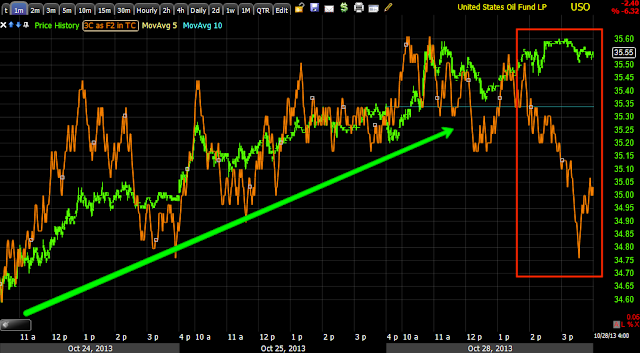
USO 60 min is also leading positive. My initial target is back inside the channel, which would be quite a move, but oil showed good resiliency even in the face of a rising $USD today.

This is the very recent, very strong 30 min leading positive divegrence.

and to ge the timing kicked off, the 5 min chart joined them.

 Earlier today when I was asked, USO was perfectly in line, but I still expected a wider base for a more powerful move, later in the day the 1 min chart made a move toward that direction.

The 3 min chart and even the 5 min to some degree all show the same, I believe it will be a constructive pullback that can be bought with an excellent entry and very low risk.

I drew basically what I envision from here in yellow, there could be a head fake move (yellow arrow), but it's not as common on short term commodity moves. Then I expect a breakout and move in to the channel around$39-$39.50 as an initial target.

A very sharp "V" like we have now would have trouble supporting such a move, but if it were to widen its base with a "WE" bottom, then it should have little trouble, you might want to set some price alerts.

AAPL Down Around -2.5% on Earnings

Well if you don't already know, AAPL beat on Revenue and EPS, their I-Pad units missed, but it was the gross margin squeeze (apparently) that the market didn't like, although there is a CASH concern that AAPL is burning through cash with certain buybacks, dividends, etc and only netted 140 mn in cash when previous quarters where in the billions (9 billion) etc.

Whatever it is, I should think we should have some nice looking December $535 puts tomorrow morning as AAPL is down almost 2.5%.

 3C was first developed on the TOS platform for AH trade, so here we see the initial pump in AAPL with a 3C negative divegrence and then a dump in to a small positive divegrence and AAPL settle.

This is the 15 min chart that grabbed my attention, accumulation at an island bottom and distribution recently on a strong 15 min timeframe, leading negative.

In any case, for all of you in AAPL puts or short, best wishes for a nice return in the morning.

End of day close, VIX, SKEW and Credit

Here are the end of day prints on a small ramp attempt. Also we take a look at the SKEW and the VIX, how the SKEW is pricing in a lot of tail risk fear and the VIX is judged to be complacent, but not so fast. HY Credit is also seeing a significant shift in character/distribution.

 SPY intraday in to the close did not look good.

My view has been Monday would act similar to Thursday and Friday and that is to say, be a "Noise in the trend" day, not make any moves that would redefine the trend. I'd say we were right on target.

 If you look at the behavior in which last week I said I expected Friday to act like Thursday and today to act like the two previous days, you can see very clearly that is what has happened, however look at the very distinct change in the close view of the 3 min 3C chart, "Changes in character precede changes in trends".
 I also said although the leading negative divergences were still there, they were "Hung up", not making lower lows, today that changed.

 The Channel also shows more volatility within it with increased volume.

 I just updated the MSI (Russell 3000 Most Shorted Index) and as you can see, it has peeled away from the Russell 3000 trend with heavily shorted stocks underperforming rather than being squeezed.

 The IWM I said earlier was the strongest of the bunch, here's a 1 min chart that shows an unusual positive in the IWM that is at odds with the other averages.

The Q's didn't fare to well in to the close - 2 min. that may have something to do with the after hours beating AAPL is taking, but I don't base much on AH trade.

Finally, today was the first day someone sent me an article with another site finally picking up on the SKEW Index and they only did so because a reader sent it to them. 

As a reminder the SKEW Index is by the CBOE, it looks at out of the money options to try to understand "Tail risk" or what some would call a Black Swan event or market crash (sudden).

This is the SKEW in green very elevated indicating tail risk and the VIX which measuresSPX front month at the money or close to the money option premiums is considered here to be "Complacent", no fear. Taken together they'd say "Near term little fear, slightly longer term, lots of fear", however I'd caution about making assumptions of VIX complacency based on it's closing price.

The VXX (short term VIX Futures) in blue hasn't mad a single lower low since 10/18 while the SPX has made several higher highs, this is not normal and it shows the supply demand dynamic is keeping a healthy bid under VIX protection, otherwise it would be lower,  the 18th date is just another curiosity seen EVERYWHERE.

HYG (High Yield Corp. Credit)
 HYG 1 min trend, again the 18th figures prominently, in fact HYG was one of the first assets that set off alarm bells on the 18th as one after another asset showed some strange behavior.

The 5 min 3C HYG cycle...

The 15 min 3C chart

And as I said, the 30/60 min are now negative as well.

60 min after a very clean trend of confirmation.


TBT / TLT Update

I'm still tracking what looks to be a decent pullback in TLT, I do like TLT and would like to be long around $100-$102, but for a pullback last Friday TBT (2x short TLT essentially) was opened as a way to play a pullback, I'm still on board with that position.

AAPL Final Regular Hours Update

I don't have really anything new since the last update and there's really nothing standing out on the charts except that 15 min which is what caught and held my attention. There is a 30 min negative right at 2:30 today, it's curious, but not a smoking gun.

I'm still holding the December $535 Puts

EOD Market Update

I'll of course update you if anything dramatic changes, but as we stand now, here's basically what's going on in both the near term and the longer term which I'm defining as the cycle that started off the 10/9 lows.

I'll also say that the SKEW Index (which I'll have something to say about soon) and the VIX are showing what would be referred to as "Tail Risk". There's an assumption that because the VIX or VIX futures are in complacent territory that there's complacency abound and that' just not the case if you look closely, but that's a different post, the point is Institutional traders are buying protection as if they expect a market crash. More on that soon.

The intraday in line status is starting to change as I suspected, it's a slow grind, but it is getting there. I wanted to show some near term action and and some trend action as well.

 SPY intraday going more negative in to the afternoon

The 5 min chart and this subject of the 18th is really making me wonder what it's about, although I suspect China, tomorrow morning we'll have a better idea.

DIA min intraday is showing some clear breakdown from the last two days price action.

The trend here is as clean as could be with all of the cycles, this is a near textbook chart.

 The IWM has been one of the stronger of the averages, intraday some weakness is presenting...

The 10 min chart and even here the 18th plays dominant.

QQQ intraday change, interesting in front of AAPL earnings.

QQQ trend 5 min and the 18th again

ES 5 min, as I said last night, these are negative and stronger unlike the 1 min which can move around a lot.

ES 60 min

NQ 5 min (NDX futures)

NDX 60 min

TF 1 min futures.
TF 60 min with a clear trend.

I suspect the very closing 3C prints are going to be most important, but this is as close as I can cut it and get it out before the close.

AAPL Dec. $535 Put Update

Earnings for AAPL are only a few short hours away and the Dec. $535 contract can still be exited where we entered it for at least break-even, earlier it was near double digits.

I've decided to stick it out, but there are some charts that are moving in confirmation with price intraday so I thought I'd update AAPL. I'll also say any change to that situation would occur on the fastest chart first, the 1 min and there is a change on the 1 min chart.

 This is an intraday 2 min chart that is pretty much in line with price action, that would mean the current trend (intraday which is up) doesn't have anything peculiar about it and there's no reason to believe it should make any drastic changes outside of the market, but that's usually reflected in the charts as well.

 The 3 min is also in line, not leading, not lagging, but in line with price.

I'll remind you from earlier if you were to zoom the 3 and 5 min charts out to their trends, you'd have something like this 3 min chart above that appears to show a very clean cycle from accumulation to mark up to distribution and borderline decline. There is no effective head fake in place in AAPL as of this capture.

 AAPL 5 min in line, again though if zoomed out, it would look more like the 3 min chart above, but I'm mainly concerned with intraday trade as earnings approach.


 This 15 min trend is still what has me hooked with AAPL and December is a fairly liking expiration in case I need to ride out any rough weather, so long as this 15 min chart stays ugly, I'm okay for the most part with remaining in the AAPL put.

This is the 1 min chart (intraday) I mentioned at the top of the post, it is going negative, for it to effect longer timeframes it would need to grow in strength (leading negative) and migrate to the 2, 3 5 min etc.

Since the capture, there's no migration, but the 1 min chart looks worse now than in the capture above.

Financials / FAZ Position Update

About a week ago FAZ (3x Financial Bear) was entered (long), since there have been updates on 10/22 and 10/23, the position is just in the green and I still like it.

Here's a view of XLF which is the Financial Industry as well as the 3x leveraged ETFs, FAZ and FAS (3x bear financials and 3x Bull Financials respectively). I also looked at the 2x leveraged UYG (long) and SKF (short) and found the same confirmation.

XLF-Financials
 1 min intraday

3 min intraday

5 min, more trend and a much more important timeframe.

XLF 15 min with a previous cycle (accumulation, mark up, distribution and decline).

 XLF 60 min with continuing deterioration with lower 3C highs at higher XLF prices.

FAZ 3x Financial bear- this should look almost the mirror opposite for confirmation.
 FAZ 3 min intraday leading positive, pretty sharp and very recent.

FAZ 10 min trend, note the strength pick up at the 18th.

FAZ 60 min is pretty self-explanatory.

FAS 3x long Financials, this should look similar to XLF for confirmation and opposite FAZ above.

 2 min intraday leading negative, I consider this to probably be connected to FAZ's 3 min leading positive.

FAS 3 min leading negative, similar to FAZ's 3 min leading positive.

FAS 15 min with accumulation for the cycle in to the low at 10/9 which is a theme we see everywhere and negative at the 18th, again a common theme. These themes are seen, but I've seen few that are so clean and consistent through varying and very different asset classes.

Longer term FAS 60 min, this shows previous cycles like the XLF 60 min, accumulation, mark up, distribution and decline, right now we'd be in distribution and borderline decline.

All in all, I still like FAZ long or SKF long or for less leverage XLF short or for more leverage, XLF calls, although I haven't checked on their liquidity.