Friday, April 17, 2015

Daily Wrap

What a difference a day makes after nearly 2 weeks of rally and reversal process.

After a crackdown in China on shadow bank financing of stock purchases, warnings to retail investors about risk of the market and expanded short sale list as well as encouraging finds to lend shares out for short selling, China (futures) were hammered. I suppose the Bloomberg Terminal blackout didn't help, nor did the Greek Exit fears with German Bunds now trading a mere 5 points away from a negative yield which will have consequences on what the ECB can buy in their QE as well as the obvious flight to safety in bunds. The DOJ's also is leaning toward blocking Comcast's bid to buy Time Warner.

The effect, the Dow loses 18,000 and is now unchanged YTD, the SPX loses 21000 and is up less than 1% YTD, the NASDAQ loses 5000 and transports, well they just look horrible. This leaves US equities as the worst performing asset YTD vs credit, gold, bonds and oil believe it or not!

The major averages YTD with Transports (salmon) looking HORRIBLE).

AAPL wasn't pretty today...
And is now very close to breaking below its triangle's apex, this "should provide some upside next week on an oversold basis and a Crazy Ivan head fake, that's if we don't see continues follow through in a major change of character. It was volatility we were looking for more than anything after all and today's closing candle on the SPX takes out 6-days of longs, now you probably have some idea as to why I didn't like the thought of trying to piggy back this move up, volatility increasing, a large downside break when the move was done and this kind of unpredictability that changes the entire landscape of the market YTD is a single day. Most everything is about 1 to 1.5% lower on the week, so our Week Ahead forecast from last Friday was pretty well on track as we saw the move pretty much topping and reversing this week.

This all occurred on Huge ES/Futures volume as well.

All of this and the real downside break isn't even here yet. I suspect you'll know it when the VIX completes its Crazy Ivan Shakeout and breaks above its triangle and 50-day moving average, something we've been watching over a week now...
VIX tested the waters, but closed below the line in the sane, although I do believe it will be closing above the 50-day (yellow) very soon.

Bonds overall were down 6-11 bps on the week with the long end outperforming today.

Remember our $USD forecast, bounce and then lower on a larger move? The $USD's performance was the worst 4-day loss in a year and the second worst weekly performance since October 2011 and to think, it was just a few days back it was still in the forecasted bounce with a Larger move lower to follow.

The USD was forecast to bounce on the same day the market was, Thursday April 2nd.

You may recall the recent chart's and correlation in which the $USD has led the market I have posted numerous times...
SPX 60 min chart vs UUP (white) which shows the $USD in almost the historical legacy arbitrage, but still leading the market as it turned down earlier in the week as this relationship/chart was posted with today's move lower... hm...

Gold and silver were down on the week overall, we should be close to a new GLD trade.

Interestingly for next week , especially the early part, Today's Dominant P/V RElationship was SUPER Dominant across the board: 27 Dow stocks, 91 NASDAQ 100, 1141 Russell 2000 and 327 SPX 500, ALL CLOSE DOWN/VOLUME UP.

This is obviously a very bearish relationship, but it's also a strong 1-day oversold relationship and most commonly we see a short term oversold bounce the next day or so.

Of the 9 S&P sectors, ALL NINE WERE RED. Utilities were the best performer at -0.36% and Consumer Discretionary lagged at -1.48%.Of the 238 Morningstar groups, 226 were red.

Only 11 Dow stocks remain above their 50-day moving average, only 1010 (almost half) of the Russell 2000 are above their 50-day.

Overall, the market is at a deep 1-day oversold point so our forward looking analysis for early next week doesn't look so far off, a 1-day oversold bounce and INCREASED VOLATILITY sounds very reasonable here, that should be an excellent entry for positions, options/puts, etc.

However, I think if anything, this week demonstrates just how deteriorated those pilings that support the pier (market) really are, just a bit of impact and you might be surprised how fast and hard they break.

Have a great weekend.


Shout Out

Most of you have been long term members with me since the start and I have ALWAYS been amazed at the quality and kindness of Wolf on Wall Street members. I believe in the 80/20 rule for the most part which would suggest that at least 20% of members will be, well difficult.

I think in the 5+ years I've been running this site, I've had 1 difficult member of hundreds, which is amazing to me. Statistically, it doesn't make sense how so many people can be so kind, so easy to talk with, so pleasant, caring and what I often call "remarkably close" when I talk to others about what I do.

Obviously working on the computer all day deprives you from the typical co-worker experience that most people are privy to and it can be strange not to have that basic relationship, someone you have small talk with during the day, someone you go to lunch with or celebrate events with.

 I've always been VERY open about my life with members, because I don't have anything I'm ashamed of so I'll answer anything you want to know and because I feel very comfortable sharing things with each of you. As a result, I've made hundreds of incredible friends across the globe. I share my life with incredible people from all walks of life and they share their lives with me. The whole thing just absolutely defies the most basic statistical assumptions.

Some of you I have met in person, even had to my home. Many of you I look forward to meeting in person, but all of you are always in my thoughts and my concerns as I want to do the best I can by you because I know you are not just good and deserving people, but some of the best people I've known which makes me work even harder to do the best I can by you.

In any case, know that I appreciate you. I suppose I said all of that so I can say this.

After many years of pure insanity in marriage as many of you know, and only after I decided I would spend the rest of my days as a single person with the market and the people I call friends every day over the internet as my true love, I met the most incredible person I've ever known. The lovely and very talented Andrea. Most of you know a little about Andrea, some of you know a lot about her and some of you have even been in touch with her.

Andrea is a veteran, 15 years in the Army with a few years as a medic and most of them as a Black Hawk pilot and flight lead in charge of "Air Assault" planning, which is quite detailed and intricate with only 15 seconds of  slack between the actual plan and being on target , coordinating with 3 to 5 other Black Hawks, two Apache gunships and sometimes Chinooks. This basically means she planned all of the flights, coordinated all of the communications and appropriate counter measures for the areas and threats known to the area. She has been deployed in war time to Afghanistan, Kosovo and Iraq as well as the DMZ in South Korea, but you'd never know any of this about her as she's very humble. She's still a pilot today, having flown Emergency Medical/Trauma, she now flies for several news stations.
Andrea in Iraq...

Andrea and our second girl, Angel.

In any case, I'm very proud of her for so many reasons I wouldn't even know where to start. I'm proud to have her on my arm and in my life which is why I share things about her with you.

In any case, she knows how much I work which is typically 12 hours straight with no lunch or breaks beyond the bathroom and I often have a laptop with me even then. You may know that after more than a year of trying to get the new website up and running, sending emails back and forth from FL to NY where my web designer was, Andrea took over the mission and now has the website within days of going on line as soon as I find the time to write some script. She knows a lot of you by name and knows a lot about many of you as she knows I care about my members so it's important to her as well.

To my surprise in an effort to make my life easier, to make my time more efficient and maybe just to allow us to spend a bit more time together, she surprised me with this yesterday as I was writing the "Daily Wrap"...
AN APPLE I-MAC.

I have quite a few computers running and multiple screens, but this was fantastic as it's clean, fast and over the course of a month or so, she's been asking little questions here and there as she's never owned an Apple computer before.

By the time I was done with yesterday's Daily Wrap, she had already downloaded 3 of the 4 charting programs I use. She knew that one of them only runs on Windows and had already bought both Windows as the second operating system as I use with my other macs and the VMWare Virtual machine that allows Windows to run on the Mac. She had installed all of that, my charting programs, downloaded all of the historical data and set up the "Dragon" voice to text software you see in the foreground and did all of this without interrupting me with a single question while I was working on last night's post. The Dragon software looks especially cool as my typing style is "Hunt and Peck", that's two index fingers hunting for the letter and then pecking it so it should save me hours every day.

It's obviously much more than the gift of an I-Mac, it's the thoughtfulness, all of the details that I wouldn't expect anyone to know and the reason she did all of this, to make my life easier and to make the service I provide better for all of my members so I just wanted to give her a shout out as many of you know her and know this is something she would do, although I'm grateful beyond words for so many reasons to have this incredible person in my life that I couldn't imagine if I tried to, just as I'm grateful for each of you.


Have a fantastic weekend!

THE WEEK AHEAD Part 2


Leading Indicators are largely in line very short term and longer term, this would be the "Week Ahead" forecast as we have largely completed the reversal process, we have moved from an uptrend to a lateral reversal process trend and today's events have broken the charts, but I suspect Wall St. will not accept the losses represented by the gap and there's still some question as to whether or not we see a head fake/false or failed breakout as the SPX daily chart has the MOST obvious resistance line in the most watched index, with a concept that occurs any way about 80% of the time before a trend reversal (the reversal of the price trend since the April 2nd forecast and upside since).

While I believe a gap fill is the most probable outcome based on the concept and more so on the losses intermediaries like market makers, specialist and the numerous HFT algos that fill the liquidity demand of market makers and specialists as the bid/ask spread is their profit on thousands of trades run per hour, in some cases I'm sure they could do that per minute if the demand was there.

While the short term Flameout occurred today as posted in the last update, Intraday Flameout-
from here the difference between a gap fill and a head fake shakeout/false breakout is significant and I suspect will only be answered as we see the intraday trade next week and whether or not it is capable of forming a base strong enough. Either way, I would encourage you to start worrying less about the very near term intraday or day to day trade, and start focussing on the longer term trend positioning as represented in today's earlier post, Important Trend Market Update
Granted, a new high on a head fake move would be emotionally moving event near term and cause doubt about the trend, however, everything that we need to know is already in place regardless of whether we get a gap fill, a new lower low or a head fake / false/failed breakout based on the VERY obvious SPX resistance area / trendline that is exceptionally obvious in the form of the March trendline...the more obvious and closer watched the asset, the more probable a head fake move, but just like we used the +25% 1-day gain in HLF to short in to, knowing it was a head fake move in advance, I'd urge you to not focus on any such possibilities beyond the opportunity to use them to your advantage and rather focus on the longer term trend PROBABILITIES.

 The intraday capitulation event on a spike in volume and bullish candlestick lifting prices since, but if there's to be a gap fill where there are likely significant institutional losses from market makers, specialists and HFT algos, there needs to be a stronger base formation and/or a closing bullish candle on what is already increased volume. Although we closed off the lows, we did not get the kind of bullish reversal candle such as the one seen above intraday at the intraday capitulation event, not only represented by the bullish Hammer candle on a 5-min chart, but the increased and significant volume on the same candle. This concept works in EVERY time frame and in any asset, so you can use it with intraday, daily, weekly, monthly charts, etc. The concept here is capitulation or a selling climax that represents (in this case, a short term) bottom. 

The inverse coming after an uptrend with a "Hanging man" candlestick or a Star/Doji Star on large volume represents the exact opposite, a Distribution or "Churning" event in which a top has been hit. THE KEY IS NOT ONLY THE CANDLESTICK, BUT SIGNIFICANTLY INCREASED VOLUME. Again, this concept can be used with any asset and in any timeframe from an intraday high to a longer term trend capitulation/top on something like a daily or weekly chart...ONE FOR YOUR TOOL-BOX.

As you can see above, the price/volume trend since the intraday flameout is losing impact, suggesting a pullback to form a stronger /lateral base near the flameout lows.

The Daily SPX chart with a deep, large bearish candlestick thus far (which closed slightly higher off the lows, but not enough to represent the kind of daily flameout we saw intraday). If this candlestick and trend today are to be overcome for a bounce to the gap (yellow lateral trendline) or even more impressive and helpful, a breakout (HEAD FAKE) above the March SPX downtrend line (#2 where the yellow arrow up represents the head fake and the arrow down represents the failure of the move-thus these are EXCELLENT timing indications and in this case, Put Option entries) where the last 2-days have put in bearish downside reversal candles EXACTLY at resistance, then the market will need to gather more strength in the form of a larger base than just the lows of the intraday flameout above. #1 is the gap fill, #2 would be the head fake/false breakout ABOVE the March resistance trendline which is now VERY obvious and the obvious target for the normally high probability head fake/bull trap set-up (I'd estimate this occurs about 80% of the time in various timeframes as an event just before a trend reversal which in this case would be lower as it reverses the trend forecast on April 2nd and starting the following Monday after the Easter Holiday) before a stronger downside reversal.

It is the longer term downside reversal trend I would start paying attention to and not have your attention dragged to other corners of the market based on short term intraday or day to day price action which if effective emotionally and is designed to touch emotional extremes and cause you to make short term decisions based on short term factors rather than focus on the longer term realities.


AS FOR LEADING INDICATORS...

SPX:RUT RATIO
 Intraday the indicator (red) vs the SPX showed broad confirmation, but a leading signal right at the intraday market flame-out lows as seen above with the potential to come back down early next week and form a "W" base that has a better chance of fulfilling a gap fill or even a head fake move, which doesn't "look" like a strong probability right now even though conceptually it is always a strong probability when we have the end of a trend with very defined support or in this case resistance (The SPX's March trendline).

Looking at the same indicator on a slightly longer basis, the 2-days (Wed/Thurs.) of the reversal process are seen with non-confirmation and a leading negative indication in the indicator leading to today's downside, whether coincidentally or whether that was going to happen any way, but perhaps not to the same degree in relative price terms. Going in to next week, the indicator is largely in line with the SPX and not offering much in the way of directional input other than staying with the current trend of downside/lateral trade.


 Since just before the April 2nd (Thursday just before Good Friday) forecast, the SPX:RUT ratio diverged positively vs the SPX pointing to a short term bottom from which the market could push higher from, one of the many indications that went in to the April 2nd market forecast for a triangle based breakout to the upside  FOLLOWED BY A LARGER DOWNSIDE MOVE, very similar to the $USDX forecast made on the same day as it has led the SPX (see the Daily Wrap after this post for more on that).

PROFESSIONAL SENTIMENT
 Once again, our leading indicators make a perfect bottom call as the SPX moves laterally before the forecasted move higher while our Pro Sentiment Leading Indicator leads the SPX to the upside. So why should we take the leading negative divergence between Pro Sentiment and the SPX any less seriously? We shouldn't, these are EXACTLY the kinds of Leading Indicator divergences that I was looking for in to the trend higher (based on triangle price pattern breakouts from April 2nd).

Yesterday and Wednesday's "Tweezer Top" and Harami Top were both confirmed by the lower leading print in Pro sentiment just as it called the bottom and rally on the 7th, 8th and 9th of April.

Confirmation/2nd Indicator
 This is the second Pro Sentiment Indicator used for stronger confirmation. Intraday today it has been leading the SPX, pointing to a gap fill or perhaps even a head fake move, in either case, the lows put in this afternoon on selling capitulation leaves the market in a neutral area early next week to build a stronger short term base to effect either of those potential outcomes, however as stated above, it's time to worry less about intraday and day to day and time to worry more about the larger trend which was also forecast in advance on April 2nd in both $USd terms (and its leading correlation to the market) and AAPL/Broad market terms.

YIELDS
 INTRADAY 30 YEAR YIELDS LED THE MARKET LOWER WITHOUT ANY DOUBT. This is a flight to safety trade in to bonds as yields trade opposite bond prices.

On a larger time basis,  the basis which I think is most important to focus on now other than intraday moves or day to day short term moves that may be useful for tactical trade positioning,  the 30 year yields trend is doing EXACTLY what we expected to see from leading indicators as it has called the last 2 tops in the choppy 2015 range-bound trade and now it's calling a 3rd top here and the worst of the year.

 Intraday the 5 year yield was initially strong early on as the market looked for an early low/capitulation selling event as we were also looking for, Market Looking For A Bottom posted at 11 a.m. where yields are leading, of course the market did not find that bottom and yields led intraday to lower lows and then reverted short term / intraday to the mean.

The larger trend view is what's most important right now as it was in line very early in the year at the green arrows and then called a top at the February cycle highs, the March bounce highs and once again in what looks similar to a bear flag  (white arrows represent the trend of a bear flag)  with a new leading negative low in yields.

THE BASIC CONCEPT IN YIELDS IS THAT THEY ACT LIKE A MAGNET FOR EQUITY PRICES, THUS AS THEY DIVERGE EQUITY PRICES ARE DRAWN TO THEM, (In this case when looking at the more important trend view, a move to the downside).

 The 5 year yields since the forecasted trend (April 2nd) with "In line" confirmation early in the trend and then  the expected leading negative signal that is now in effect and clearly seen at new leading negative lows.

THIS IS WHY I BELIEVE THE LONGER TERM TREND VIEW SUCH AS THE ONE ABOVE IS FAR MORE IMPORTANT TO POSITIONS/POSITIONING THAN SHORT TERM INTRADAY OR DAY TO DAY TRADE. LEADING INDICATORS HAVE DONE EXACTLY AS EXPECTED AND CONFIRMED DISTRIBUTION AND WEAKNESS IN THE MARKET ON THIS MOVE AS EXPECTED WHEN FORECAST.

 On an even larger trend view, the 10 year yields have a huge dislocation to the downside, remember that yields tends to pull equity prices to them like a magnet, thus the importance of focussing on the larger trend view now that we seem to be at the ending phase of the forecasted move to the upside (with the gap fill and head fake caveats).

HY CORPORATE CREDIT
 HYG has been showing 3C negative divegrence suggesting HYG's prices fall. It is actually the divergence in price between credit and the market that forms the basis of a leading indication, however the 3C divergences are early warning as HYG is one of the most overused assets to manipulate the market (Part of the SPY Arbitrage scheme also using TLT and VXX). There's a clear negative divegrence at the SPX candlestick reversal "Tweezer Top" and Harami top of the last 2 previous days.

 While High Yield Corporate Credit is most often used for short term manipulation of the market and is deeply dislocated on a primary trend basis as HYG is already in a primary trend bear market...
SPX (green) vs. HYG High Yield Corporate Credit (red). Note  the confirmation at the 2013/2014 green arrow then a series of at least 3 lower highs and lower lows putting HY Corp. Credit in a primary downtrend and leading the SPX o the downside.

This is one reason why I'm very focussed on the larger trend of the market as I've never seen HY credit fail like this and not take the market down with it, especially not Corporate High Yield credit.

As to the less manipulated HY Credit (doesn't have the liquidity of HYG , therefore is not used for short term manipulation like HYG is)...

HY CREDIT
Intraday it posted a positive divegrence in to the reversal process of this week (tight range running mostly lateral or rounding over)  and then leading negative before today's decline and now in line or near term reversion to the mean.

However, as I said, it's about the longer term trend now, not the short term signals we have been watching in trying to uncover the end of this move...
 Since April 2nd, HY Credit is initially confirming or in line at the green arrows and then leading negative at the red arrows, so whether this morning's Bloomberg/China events occurred or not, it is pointing to a move lower on a larger trend basis.

As for the 3C charts. interestingly they remain negative in just about everything beyond 1 min charts
 SPY...
 SPY 3 min with a relative positive divegrence suggesting some attempt in to early next week to fill the gap from today, possibly more if there's a stronger base built, but the market is in a very dangerous spot right now based on the trend and signals.

 SPY 15 min was in line for quite some time, but we stayed patient and waited for the 15 min chart to go negative as the other averages had already done,  there's a clear and resilient 15 min negative divegrence now in SPY which was 1 of the 3 indications I have been watching for in order to forecast the next move in the trend.

QQQ
 QQQ 2 min has been leading negative and pulled the Q's down, however today at the Flameout lows, there's a slight positive divergence.

QQQ 3 min calls the negative divergences at the top areas well, in fact despite the unexpected events this morning/overnight, the chart looks as if it called the move perfect and has a very small, short term positive divegrence at intraday flameout lows.

The longer term 30 min trend was leading negative and was the highest probability on April 2nd which allowed me to forecast not only the bounce, but what comes after the bounce and the fact it WOULD NOT hold. The last two significant tops were called by 3C divergences as was this one, nearly flawlessly.
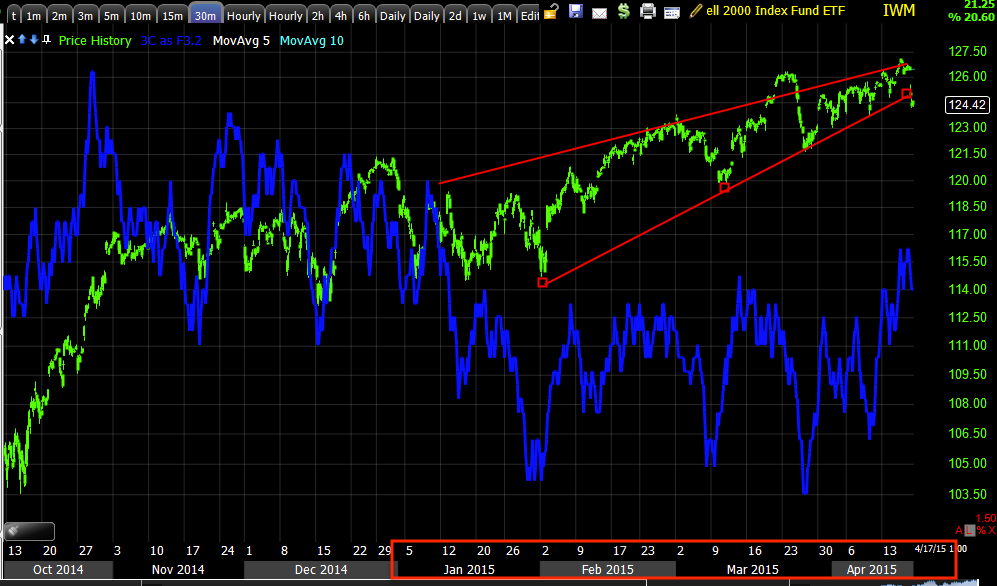
 IWM
 The EXACT same can be said for the leading negative IWM 2 min, as I have been saying, anything beyond 1 min has been very ugly and as of 2-days ago, started forecasting the market well on an intraday basis as well despite being deeply dislocated. The leading negative divegrence of the last 2 previous days (Wed./Thurs.) which were also Bearish Candlestick Reversals, called today's move perfectly.

Again, there's a small intraday positive divegrence at the flameout lows of the day this afternoon.

 IWM longer trend 15 min chart which was already negative on 4/2, has only deteriorated more with previous positive divergences calling lows/upside pivot points and and extremely large negative leading divergence recently at new leading negative lows, it seems hard to believe someone in the market wasn't aware of events that transpired overnight leading to today's losses.

DIA
 DIA 2 min is both leading negative and then positive at this afternoon's flameout lows which were also an intraday head fake/stop run below intraday support levels. Again, like most everything else, it points to some early strength next week, but not a lot of it.

 The DIA 3 min chart shows the break of intraday support and then the flameout lows with a 3C positive divegrence right at those lows as institutional money picks up the stopped out shares represented by the higher volume, allowing them to set up for a gap fill, even if the gap fill doesn't reach yesterday's close, the fact they were able to buy at lower levels allows them to get out closer to break even or a profit on the upside move.

And DIA 15 min with the previous 2 "W" base lows as well as the previous two tops and the current top area with the deepest leading negative 3C signal of the year.

As for early Monday, I'm expecting some market strength and likely either a pullback to create a larger intraday base for either a gap fill or perhaps even the head fake breakout move above SPX $2111.

The IWM 1 min chart's close argues for early Monday strength in price, however everything else above argues for weakness in the trend.
Intraday IWM 1 min showing a leading positive divegrence in to the close and at the Flame-out lows of the day. This argues for the market to pick up where it left off on Monday with price strength based on this leading positive intraday 1 min divergence, however the larger trend doesn't tell us anything even close. In fact, quite the opposite.

The Week Ahead Part 1

Since it will take a bit more time than I have before the close to finish the Week Ahead Post, here's the first several paragraphs to be followed by the full post, but I think you'll get the general gist of the post from these paragraphs. The point is, FOCUS on the trend now, not intraday or day to day trade beyond for tactical reasons.

THE WEEK AHEAD PART 1


Leading Indicators are largely in line very short term and longer term, this would be the Week Ahead" forecast as we have largely completed the reversal process, we have moved from an uptrend to a lateral reversal process trend and today's events have broken the charts, but I suspect Wall St. will not accept the losses represented by the gap and there's still some question as to whether or not we see a head fake/false or failed breakout as the SPX daily chart has the MOST obvious resistance line in the most watched index, with a concept that occurs any way about 880% of the time before a trend reversal (the reversal of the price trend since the April 2nd forecast and upside since).

While I believe a gap fill is the most probable outcome based on the concept and more so on the losses intermediaries like market makers, specialist and the numerous HFT algos that fill the liquidity demand of market makers and specialists as the bid/ask spread is their profit on thousands of trades run per hour, in some cases I'm sure they could do that per minute if the demand was there.

While the short term Flameout occurred today as posted in the last update, Intraday Flameout-
from here the difference between a gap fill and a head fake shakeout/false breakout is significant and I suspect will only be answered as we see the intraday trade next week and whether or not it is capable of forming a base strong enough. Either way, I would encourage you to start worrying less about the very near term intraday or day to day trade, and start focussing on the longer term trend positioning as represented in today's earlier post, Important Trend Market Update


Granted, a new high on a head fake move would be an emotionally moving event near term and cause doubt about the trend, however, everything that we need to know is already in place regardless of whether we get a gap fill, a new lower low or a head fake / false/failed breakout based on the VERY obvious SPX resistance area / trendline that is exceptionally obvious in the form of the March trendline...the more obvious and closer watched the asset, the more probable a head fake move, but just like we used the +25% 1-day gain in HLF to short in to knowing it was a head fake move in advance, I'd urge you to not focus on any such possibilities beyond the opportunity to use them to your advantage and rather focus on the longer term trend PROBABILITIES.

 The intraday capitulation event on a spike in volume and bullish candlestick lifting prices since, but if there's to be a gap fill where there are likely significant institutional losses from market makers  , specialists and HFT algos, there needs to be a stronger base formation and/or a closing bullish candle on what is already increased volume.

As you can see above, the price/volume trend since the intraday flameout is losing impact, suggesting a pullback to form a stronger /lateral base near the flameout lows.

The Daily SPX chart with a deep, large bearish candlestick thus far. If this candlestick and trend today are to be overcome for a bounce to the gap (yellow) or even more impressive and helpful, a breakout (HEAD_FAKE) above the MArch SPX downtrend line where the last 2-days have put in bearish downside reversal candles EXACTLY at resistance, then the market will need to gather more strength in the form of a larger base than just the lows of the intraday flameout above. #1 is the gap fill, #2 would be the head fake/false breakout ABOVE the march resistance trendline which is now VERY obvious and the obvious target for the normally high probability head fake/bull trap set-up before a stronger downside reversal.

It is the longer term downside reversal trend I would start paying attention to and not have your attention dragged to other corners of the market based on short term intraday or day to day price action

Intraday Flameout-

While I don't consider this to be a significant event, I know some of you have had questions about the DIA positive short term chart intraday divergences working in to the close.

I would not consider this AT ALL a trade with an appropriate Reward vs. Risk ratio, but if you need to know for some other purpose (as a gap fill would likely take more than just a selling / capitulation event, but a base of some substance) then you should see these charts. Again, I would not consider them useful for an intraday trade in to the close, I think we need a "W" base or something of the like before there's enough support to even consider a gap fill. However as a Fractal concept that works both intraday and as I already posted in the last post on a daily basis (hammer on increasing volume) as that's something to look for in to the closing daily chart, 

These are good examples of an intraday flameout of selling event also known as short term capitulation.

The actual concept is useful in ANY asset and in ANYU timeframe from 1 min to a monthly chart.
 SPY 5 min with a Hammer on increasing volume, making the bullish reversal candle about 3x more likely to be a valid signal, although VERY short term as there's no "W" base in place, but it may play in to the closing candle's formation, possible hammer if we see some upside in to the close intraday.


A closer look at the same chart, Note the 5 min Hammer Candle (bullish support/reversal candle) on significantly higher volume, suggesting the intraday flameout or selling/capitulation event mentioned as a possibility to watch for earlier today.

 The SPY 30 min chart has a similar candle, this is more significant as a 30 min chart.

 The same on the IWM 5 min chart AT THE SAME TIME

AND THE QQQ 5 MIN CHART, AT THE SAME TIME.

Important Trend Market Update

I have a few more data points to go through, but since the April 2nd forecast for a volatility-induced upside breakout (largely from various triangle price patterns in the averages and a high number of individual stocks, which we have seen and the forecast that the 3C charts would give clear negative signals out to the 15 min charts (condition 2 was the Index futures negative on 7-15 min charts and condition 3 was Leading Indicators leading negative, which many are as I have been showing), I think we can start to deduce what the market holds in store over the next week, although I have some additional charts to post, Leading Indicators, etc.

Today's gap down was on what I'd call a fundamental surprise event, the breakdown of Bloomberg quote terminals (these are widely used in institutional circles, apparently more for communication which makes sense given divergences tend to cluster) than the actual data/analysis. The number of comments from traders today reduced to having to use telephones to facilitate deals and their feelings about that shows just how much they talk to each other over the Bloomberg terminals and how reliant they are on them, as most described the lack of terminals, which didn't see full service restoration until around 11 a.m. this morning.

A fundamental event is a surprise to the market, one they weren't prepared for, otherwise I believe the SKEW Index would have been much higher as they hedged positions (SKEW is at a mediocre $119 far from the Black Swan hedging we have seen in the recent past). These events are discounted on the Fly, Black Friday was a fundamental event, the tragedy and market reaction of 9/11 was a fundamental event, etc. The market had no way to discount them and had to do so on the fly.

We do have a gap which I suspect holds large losses for middlemen/market makers/Specialists, HFT algo trading firms that have been filling that role, etc. so other than the fact that the market has been RELENTLESS about filling gaps the last 5-6 years, I suspect this one needs to be filled as well otherwise some large , unhedged losses will be taken by institutional money and they don't generally like that.

The DIA's short term charts as well as TICK seems to show their attempts to work on a gap fill, although the premiums from the max-pain pin which should have been somewhere around yesterday's close, are likely a total loss now.

 TICK has been unable to get anything going today, as mentioned earlier, each uptrend attempt failed, the capitulation event failed to materialize and the tight "U" bottoms that the market attempted to move up from didn't offer the support as we suspected or outright knew in advance. It's a bit hard to interpret whether today's overall TICK index will create a 1-day oversold event and chance to bounce in to today's gap and allow middle men, algos, etc. to recoup losses from higher inventory in the cash market as there was little that could be done as they were flying in the dark with the Bloomberg Blackout. I've read many comments from institutional traders that they were reduced to catching up on administrative work today, obviously overly reliant on the Bloomberg terminals, but not so much for quotes as you can get that nearly anywhere, but the deal facilitating that the Bloomberg terminals allow as they have largely been reduced to institutional Chat programs which you'll see if you read the comments of institutional /Wall St. traders.

I do find the Chinese events interesting given the FXI analysis since last Friday suggesting a top and something ugly coming.
 FXI-China FTSE 25 parabolic move. With all of the warnings to the general public recently by Chinese regulators and the number of illiterate housewives suddenly become leveraged Stock Operators , taking out loans to enter the market, etc., I wonder if the Chinese were leaking data or upcoming regulatory changes in advance and perhaps trying to deflate the bubble being created, it's an interesting story on its own, but as you see, FXI started to see sharp upside gains in yellow and then simply parabolic in red. I never trust parabolic moves in either direction, they tend to end badly.

FXI 3C 15 min around the area of the parabolic move, it seems someone was in the know in advance, leaks in China are common place.

As for the US market...

 Remember the reversal process, last night's Daily Wrap showing a bearish candlestick pattern in the SPX of a "Tweezer Top" as well as several other signals like SPX Bearish Harami?

If today's SPX daily candle ends something like what I've drawn in above over the green arrow, a Hammer , we already have the increased volume; then I suspect a gap fill to recoup unforeseen /unhedged losses in a market that's near obsessive/compulsive about filling gaps (which is a shame as they are/were fantastic information) anyway. However, I think now more than ever, a certainly more than anytime this month, it's important to back away from the charts and take a wider perspective view of the market and of what we expected when we forecast the Triangle/volatility pinched-based move to the upside on April 2nd which has been right on with last Friday's Week Ahead forecasting a top in the market and a reversal process, which was elaborated on with numerous examples Tuesday (all links can be found in last night's Daily Wrap post).

The important thing to ask is, "Did the market do what we forecast? And did the indicators act as we suspected?" 

The answer to both is YES as the forecast of April second, just like the VERY ACCURATE $USD Forecast of the same date has played out EXACTLY as we forecast. 

Now consider the second half of the forecast, which assumed a rally BEFORE it even happened, assumed the indicators would fall apart and distribution would be heavy as it was and this before it even started. The second half of the forecast, just like the $USD's similar forecast of UP and then a larger move DOWN which has already started with the "UP" portion complete, again forecasted WELL before any price moves in the direction (the $USD was actually down on that day) as you can see in numerous posts the last several days has had a tight and leading correlation with the market in general.

IF our forecasts about everything else from 2 weeks ago have been this accurate, why should we assume the next step or second half of the forecast would be any less so?

Intraday DIA divergences...
 After a negative in to late yesterday, today has seen a 2 min leading positive in line with the overall selling even t of flameout in the market, just not seen on a single 15-60 min candle, but rather lasting all day. The closing candle and whether it's a bullish hammer or similar candle is very important as it suggests a gap fill like the chart above, this is VERY helpful to TRADE POSITIONING and I doubt Wall St. takes those losses even beyond the high probabilities of a gap fill in normal circumstances.

 DIA 3 min is showing migration or strengthening of the positive divegrence from the 2 min chart. The TICK chart shows PLENTY of assets/shares to accumulate on the cheap as reading are solid below -100, -1250, -1500 and even more than -1700.

\However as I said, it's time to step back from the day to day analysis and look at the bigger picture as we did on Thursday, April 2nd just before the April 3rd, Good Friday holiday.

 SPY 5 min positive at the April 2nd forecast, the note says "Forecast for B/O (break out) Move Higher"

Look at the 5 min chart's reaction and signals at the base area and since the move up, currently horribly leading negative. This is the larger perspective view beyond a short term gap fill bounce probability. This is the TREND.

 SPY 5 min showing the distribution area with the April 10th "Friday Week Ahead forecast (last week) for market topping this week" And Tuesday April 14th "Forecast for reversal process"

Just look at the 3C chart for a moment, even beyond my annotations.

 10 min chart since the 4/2 forecast and trend up, with a clear and VERY accurate 3C signal in to the reversal process this week.

 Remember the one of 3 conditions of the averages all showing 15 min charts, the "gas in the tank" to go negative. SPY held out longest and confirmed the trend, but that has ended. The white area and green triangle represent the confirmation of the trend, the Yellow area represents the Reversal process with a leading negative 15 min 3C chart for the SPY, the last average to go negative.


 3- min SPY charts with two "W" bases and positive divergences and the negatives at the end of the trend they supported both earlier and right now.

 Charts such as the QQQ 30 min had given us the probabilities and most probable outcome of the bounce forecasted on April; 2nd well before it started, based on this stronger 30 min chart's leading negative divegrence, we already knew where the highest probability resolution of the move lay, WHICH IS WHY IT MADE THE MOST SENSE TO USE THE PRICE STRENGTH TO SELL IN TO WITH LONG POSITIONS OR SHORT IN TO AT THE APPROPRIATE TIME FOR EACH ASSET.

The red on the time axis represent the year 2015, note the largely lateral price trend through the year,  A HUGE CHANGE IN CHARACTER VS THE 2013/2014 PRICE TREND.


 IWM 30 min leading negative through all of 2015 with a bearish Ascending Triangle that has come to an apex.

And the DIA 15 min chart, as forecasted and expected, the chart went negative and is at a new leading negative low. You can see the positive divegrence before 4/2 and why this formed part of the basis of the forecast.

The point being, although I have said "We are close", look at these larger trend based perspectives, I think you can see how close we are, not only how close, but in any prior circumstances, we'd already have broken to the downside as this is one of the worst divergences on the charts as we had expected based on larger negatives already in place.

I'll add additional analysis,  but I don't think we need it for the trend perspective, just for pivot/timing or near term perspective. Price and the charts did exactly what we forecast 2 weeks ago. EXACTLY