Tuesday, August 19, 2014

Daily Wrap

Another day of epic low volume, in fact today beat last week's -40-55% below average volume that carrie through yesterday, today was the lowest non-holiday volume for S&P futures for all of 2014, 8 days of this which is ultimately unsustainable as if we didn't already realize that this bounce was unsustainable.

However for the bullish, "Buy the Dip" crowd that just mindlessly buy the dip, not even realizing why buying the dip worked and what's different now, there was a little victory lap in the NASDAQ 100 making a 14 year high and AAPL making a new all time high.

Meanwhile as that happens, the NASDAQ composite's Advance/Decline line is broken beyond repair...
NASDAQ Composite (red) vs the A/D line (green)

And while AAPL made new all time highs as $100 was a psychological magnet, I wouldn't be holding that one much longer, in fact... well we will cross that bridge when it's time to cross, but in the meantime,
If the last divergence at AAPL all time highs looked like this (apparently quite a bit on Third Point and followers, selling, I really have to wonder what might become of AAPL with this divegrence considering the last one took -45% of AAPL's value in 8 months.

While most of the averages closed around a 1/2 percentage point gain, the R2K and Transports especially lagged, +.34% and +.11% respectively and once again it seems something is scaring off buyers or encouraging selling in to the European close.

We noted this last week and I saw it today in the SPY, I wouldn't expect to see it in the IWM yet until/unless it makes some gains worth selling in to. IWM in yellow) and transports (DJ-20) in salmon as we approach the European close.

The $USDX made an 11 month high today, the biggest gain in 3 months which may explain why the 1-5 min 3C charts were showing negative divergences there today, likely profit taking, the $USD is now up +0.55% on the week.

USO continues to be slaughtered, you may recall our July 14th, USO Trade/s Set-up ,

"Initially I was looking at USO as a long/bounce trade and I still think there's a decent long bounce trade there, but the bigger trade is shorting the bounce as you get a better entry at much lower risk...Upon a closer look at the charts for Brent Crude Futures and WTI, it looks like both are set to come down, what the catalyst is, whether political as there's a strong correlation between the price of oil and economic activity or perhaps something in the works as far as a counter-insurgency in Iraq, who knows, but both Brent and USO (WTI) are showing the same trade opportunities/set ups."

The above post from July 14th was looking for a bounce and then a bigger trade in USO/Crude short, the next day USO bottomed and bounced and of course headed lower and apparently on US counter-insurgency attacks!

We've been noticing some odd behavior in VIX short term futures this week as well as spot vix today...
What happened to banging the close with VIX, above VIX is inverted to show the normal SPX correlation, it outperformed during the afternoon today.

Nine of nine S&P sectors closed green today ,  but the defensive "Utilities " sector led with a +1.27% gain while financials (which were showing all kinds of weakness today) came in last at +0.18% gain.

Of the 239 Morningstar Industry/Sub-Industry groups we track, the winners were down today from yesterday at 185 of 239, but still respectable, although likely closing in on an overbought condition which is odd as the market still remains in a deeply oversold mode as actual market breadth has fallen apart, in other words, it's not transient, but indicative of market health or lack of.

 Percent of NYSE stocks trading 1 standard deviation above their 40-day moving average has recovered from the deeply oversold condition at 10%, but is nowhere near recovery which is what I suspected we'd see even on a strong bounce, in other words,  the damage is done, much like the NASDAQ Comps' A/D line.

 Percent of NYSE stocks trading 2 standard deviation above their 40-day moving average or momentum stocks are far from any recovery, even from the yellow trendline where they had already fallen apart badly.

As for  Percent of NYSE stocks trading above their 40-day moving average, we went from 20% to just over 50%, still far, far from a normal area considering the relative relationship between price.

To give you an idea of how bad 20% is...
During the worst part of the 2008 decline, there were only 2 times we saw a reading lower than 20%, the first was just below 20%, the second, a capitulation event was at 10%.

Yields dropped early in trade today, but recovered through the rest of the day...
5/10 and 30 year yields... I'm not reading too much in to this.

There was no Dominant Price/Volume Relationship today, there was a co-dominance which really doesn't count, but it was between Close Up and Volume Down and Close Down and Volume Down.

Other than that, the most notable risk event may be the rising SKEW that I have recently pointed out and it's very fast ROC.
SKEW bottomed on 8/8, the same day the base finished up and just before our bounce started, I find that somewhat interesting, since though, they've been busily buying low strike puts at higher than normal premiums to protect against tail risk, otherwise known as a market crash.

As you probably know, tomorrow we get the Bank of England's minutes from their last policy meeting and at 2 p.m. the minutes from the last F_O_M_C meeting, there likely be a lot of language about accommodative policy for a "Considerable" amount of time after QE winds down in October, but the market will pay a lot of attention to anything that resembles information about the timing of the first rate hike and if more voting members are moving closer to Plosser's dissent and an earlier rate hike.

As  usual, expect the typical F_E_D knee jerk reaction, but remember that more often than not the initial reaction is faded. This is the main US eco-data other than MBA purchase apps and EIA petroleum stats.

As for the bounce, the Index Futures' 5 min charts are what I usually align trades with, however this week we've already seen the 15 min chart start going negative which is unusual and now we have charts from 30 to 60 mins going negative and on a scale larger than , well on a scale that suggests this bounce was used for what we expected, net distribution, whether selling or short selling.

 5 min ES already leading negative which is usually all I need to align my trades, in this case I'd be looking for short entries. however it didn't stop there...

The 15 min chart is leading negative, I don't think this would have normally shown up unless the distribution was extraordinarily large.

TF 30 min is leading negative

And now NQ 60 min which shows the last negative divegrence taking prices down and a smaller relative positive divergence compared to the current negative, is obviously telling us that at the end of this bounce there's significantly more shares sold or transferred from smart hands to dumb ones, just as the Institutional net sellers charts from BofA/ML have shown.

I'll likely use any upside minutes volatility to close some long positions if it makes sense and other wise be on the lookout for short position entries as I don't think we are far from the pivot, even though we'd almost always expect a reversal process, it's getting pretty insane with breadth readings and looking more and more like there's not enough support in the market to prevent a collapse if that spark should trigger.

EOD Market Update

Today was actually pretty quiet, I suspect this has a lot to do with tomorrow's 2 p.m. release from the last F_O_M_C meeting as well as the BOE's minutes release tomorrow. There's not much more on tap as far as US macro-economic data except MBA purchase applications at 7 a.m. I'm hoping market internals will have better data than today's intraday trade.

Remember the F_E_D knee jerk reaction, this is on almost anything F_E_D released, especially F_O_M_C. Very often the initial knee jerk reaction is faded as it tends to be the wrong reaction so don't make assumptions too early.

The SPY and XLF have the worst intraday 3C performance and that is now clearly visible in Financials performance today.

 Financials underperforming today.

Also the SPY as mentioned, even the Index futures show the same as TF and NQ are pretty much in line with ES with a negative divegrence.
 Both NASDAQ and Russell 2000 futures looks like this NQ chart intraday, pretty much in line, however like the SPY divergences which are quite sharp, ES is also showing...

ES intraday

 HYG and it's market manipulation abilities are being tested, we've seen recent deterioration in HYG's underlying trade as it was once in line or leading before the bounce took off. Today HYG is lagging the SPX rather than leading as it has been.

VXX/Xhort term VIX futures continue to add positive leading divergences and...

Intraday vs the SPX (prices inverted to show the correlation), VXX is performing better than it should, not making lower lows as it should which is often a sign of demand for protection.


 USD/JPY has been the market leader as we expected this morning, but like AUD/JPY which led yesterday, late day negative divergences are starting to set in, this is almost entirely $USDX based.

$USDX intraday with a clear negative divegrence, a move lower here sends USD/JPY lower.

And the MSI is also starting to underperform the market as Most Shorted Stocks can't maintain a squeeze beyond the open.

It seems the Q's are benefitting from AAPL's move >$200 as well as the NDX's break of $4k yesterday. The IWM is much flatter which is surprising considering how it has not met anything more than the very lowest price target set about a week ago while other averages are well beyond the minimum, into the medium and some at the expected target level like the QQQ.

Index futures have not seen any let up of their negative divgerences on the 5 and 15 min charts so that looks like it will be an influence on the transition to the next step which should be lateral, but the minutes release tomorrow may create some volatility, I'll be looking at this area tomorrow for either profit taking on certain long positions and/or maybe some option entries as I prefer to enter them on price extremes.

We'll see soon enough if market internals have anything interesting to tell us, otherwise today has been a bit boring.


HLF Position Update

I like HLF a lot for 3 reasons, 1) it's a great example of real world Head and Shoulders' top entry points, the head fake moves associated with H&S tops that work because over a hundred years of TA has taught an H&S should look like, "X" and technical traders should enter H&S at "Y". The second reason is, despite Carl Icahn and a feud between major hedge fund managers in a spitting contest, ignoring all of the noise and talking heads, ignoring fears about who's on what side of the trade and just following the objective data and our concepts has yielded excellent gains.The third reason is the ability to ignore emotions and fears as long as you have strong objective evidence and enter trades that are otherwise very difficult emotionally to enter. Having an objective edge makes entering them a little easier, but it's still difficult, however in this case it really was the lowest risk, best entry available and without 3C's objective evidence contradicting price, I doubt many including myself would have entered the last position when we did.


Our HLF short is up nearly +21% since our most recent entry on 7/21 (an add-to) which leaves me about 25% to fill out before HLF reaches full position size.

 This is the daily chart of HLF which has been the subject of Bill Ackman's relentless desire to prove they're an illegal Enron-like scheme and the stock (according to Ackman and his 300-page report followed by a live analysis session) should go to zero.

The daily chart shows a stage 3 H&S top and the 3 places I've learned over the years to look for short entries and the one place that Technical Analysis has taught for nearly a century to be the best entry, is actually the worst, but a great set up for the final area in which I'll enter a H&S top.

The 3 entries that are highest probability and lowest risk are "A" the top of the head, the only problem is you have to clearly identify the pattern as a H&S and not a random price pattern as the right shoulder is not yet formed, volume analysis is one of the only ways along with understanding the 4 stages of an asset's life-cycle. You also have to be able to wait out the real move you are looking for, but as long as you get in close to the top of the head, your stop shouldn't be challenged very often.

"B" is the top of the right shoulder, it's the second place I'll enter. This is not as good of an entry, but more timely.

"X" is where T.A. teaches technical traders to enter a H&S, on the break of the neck-line or "price confirmation", however every Wall St. firm knows traders will all react the same and enter at the same place which is why almost all H&S patterns have a shakeout back above the neckline where new shorts have placed stops upon entries on the break of the neckline, thus I never want to enter there, but be patient and wait for the shakeout move which is the 3rd and final area I'll enter a H&S top; it is the lowest level, but the most timely.


 This is the shakeout of new shorts above the H&S resistance/neckline after the initial break, the big move on the upside was HLF's biggest daily move ever which was the same day Ackman made his presentation. We saw a 5 min positive divergence just before and I suspected it was Icahn trying to humiliate Ackman as the stock made it's largest daily gain ever on the day Ackman said he was delivering the "Knock-out" blow evidence against HLF. In any case, the 5 min positive only had so much gas in the tank and was not a game changer so as HLF made its move higher, we entered our add-to short near the daily highs well over +20% on the day and have reaped the rewards since.

The daily 3C chart continues to show HLF as a long term short and most of the damage was done on the short-shakeout move as you can see.

There are a few smaller divergences and a flat area in HLF, but I don't see anything that would make closing HLF worthwhile, I think this is one to just put away and let it do its thing over the next several months, I think you'll be glad you did if you aren't already at a 20+% gain with no leverage.

SPY, HYG & Transports Weakest

There's always some rotation among relative strength, although this is not the healthy bull market sector rotation we are talking about. For instance, the Q's intraday 3C signals are holding up better today than yesterday, of course AAPL which is the most heavily weighted NASDAQ 100 component broke 100 so it's going to pass along some of that intraday strength to the NASDAQ 100. *I'm not talking about price percentage performance, but underlying trade.

Transports are also looking weaker today despite another drop in crude, of course outward appearances have gapped Transports up, but you'll see what I mean.

Finally as shown last night, there's a big difference in the performance of general High Yield Credit and HYG (High Yield Corporate Credit) which is very liquid and is used by the algos to determine whether  smart money is in risk on or off mode and buys stocks accordingly, making manipulating HYG one of the easiest market manipulation levers even if HY Credit is going the opposite direction as shown yesterday in the Daily Wrap. We've been watching HYG as it led the market the entire time the base was being formed for a week (8-1 through 8/8) and continued, but recent deterioration seems to be showing smart money not wanting to take the chance of being caught in HYG when the music stops. Of course tomorrow's release of the last F_O_M_C meeting's minutes will likely hang the market up in the area until those come out.

 SPY 1 min since Friday afternoon's positive divegrence which is why this week's forecast was for a few more days of bounce before a reversal process starts. Today the SPY is seeing the sharpest negative divegrence. Like the NASDAQ has a high percentage of tech representation, the SPX has about 22% representation in Financials which are also interesting. You saw my earlier target for XLF, but that doesn't mean things aren't deteriorating below the surface, that's 3C's edge, the ability to contradict price and when those contradictions are sharp, that's when we have a strong edge.

XLF'x trend since breaking out of the week ling base. Just like the two previous bounces (which were much less effective, but also had much smaller/weaker bases), this move has seen the same immediate distribution which we hadn't seen often until after July 1st, typically the market would run up for a few days before distribution would start, not the case the last 3 bounces (since July 1 when a number of indicators turned sharply to the downside).

 The SPY daily chart is near some of our upper targets posted last week before the bounce started. Today's gap up and small body are bearish candlestick indications, however the ones that are especially reliable will have increasing volume over the previous day, the higher the better so I'm guessing we are in the area, but until I see heavy volume I don't have a lot of interest in today's candle as a breaking point for the bounce.

Transports intraday are also among the weakest of the major assets/averages I track.

This is a longer 15 min chart which has remained leading negative, meaning the base divergence was never strong enough to reach this timeframe.  This also means that shorter term charts like the 1-10 min charts, no matter how strong their base divergences were, have an exceptionally high probability of failing, like "Rock, paper , scissors", the 15 min chart trumps all timeframes faster than it and becomes the chart of highest probability resolution at least for intermediate term trade (longer than swing).

 IYT is a current open short partial position entered just after the ascending (bearish) wdge saw a channel buster at #1, we entered just after that and as such with excellent positioning, the IYT short which was left in place, is still at a slight gain and offering us the ability to fill out the rest of the position at excellent levels rather than short it as most technical traders do on confirmation of the break of the wedge at #2 where risk is very high. #3 is the base area, and #4 was one of the potential targets for Transports, the wedge resistance area or just inside it.

I'd be very interested in a small bodied candle like today or any other bearish reversal candle with higher volume which makes these signals much more reliable.

HYG has been deteriorating , but it was also one of the early signals we'd see a bounce as it led the SPX ever since 8/1 when the base just started forming and continued to lead through the end of the base and in to the bounce. I've posted several times the last several days showing underlying HYG trade starting to deteriorate badly, however as a short term manipulation lever it will really only effect the market when price starts to slip. So far today's lateral price trend is a good start toward that end.


AAPL Takes Psychological $100

These are the kind of targets head fakes head for, areas where retail is attracted to, areas they'll have limit orders to buy. Thus these are also the areas where stronger hands hand off their shares to weaker hands, the facilitator is demand, the trigger is a psychological level that creates demand.
AAPL hits exact $100 resistance until just after noon time today...

You probably can imagine what happens when strong hands abandon positions and leave them with tapped out (margin/negative investor net worth) retail....

AAPL will be on the radar, although just crossing the psychological levels isn't a call to action, it's usually the last step before that call to action comes in to play. Don't forget AAPL's strong weighting on the NASDAQ 100 as well.

For those holding AAPL (I know a few of you are), we'll likely get other signals before this kicks in, but to give you an idea of where I'd be looking at a stop for the bounce trend that started 8/8-8/11...


The 60 min Trend Channel has held the entire AAPL move since it started with the market out of the week long base on 8/8 - 8/11. The current stop on a closing bar basis is $95.25 and will continue to move higher locking in more gains.

Adding a Little To FEYE Aug. 22nd $30 Call

This is still a speculative position, but it looks like they just wiped out a bunch of stops.

Market Update

While I was putting together the last post, a few interesting indtraday indications came in to play, they are the same trend over the last week, although it's getting much sharper now.

For instance...

 As expected this morning, USD/JPY (red/green) is driving and ES/SPX futures are following, yesterday it was AUD/JPY until that started to fail at the EOD. There's no major divergences in USD/JPY as of yet so it should keep moving to the upside.

The objective of this bounce is to sell/short sell at the best levels which are typically graded by institutional investors (who typically hand off larger positions to be filled by specialists or market makers in the particular asset) using VWAP, the objective of the middlemen is to sell/short sell at either VWAP or the upper standard deviation as has been the trend for the last week or so.

The TICK data however is pretty tight with nothing above or below +/- 1000, intraday market breadth is much poorer than the market averages appear.

 SPY intraday has hit a new leading negative divegrence. Below is the trend during this bounce, it's pretty easy to figure out what's going on between volume, 3C, VWAP, but it was pretty easy to figure out even before the base was mature.

Here's the trend of the intraday chart, positive in the base and since mark-up, distribution started almost immediately. This is more of an art than a science, figuring out how big the base is, how strong the divegrence is and essentially breaking it down to "How much gas is in the tank for an upside bounce?" and how much has been used up already. The 3C chart above gives us a pretty good idea, no time was wasted in selling in to any move higher just like the last two bounces since July 1st when there was a very definitive change in character leading us to NYSE breadth readings that were worse than most bear markets.

This isn't a signal to take action, it's confirmation of the distribution trend and that we are on track. I'll see what else is going on and take a look at the watchlist to see if there are any significant changes among a majority of stocks in my watchlists.


XLF Update-Bellwether

As far as early market indications, there's nothing too interesting as of yet, pretty much what I'd expect to see on a day like this, this early, but that doesn't change anything about what is already in place (take yesterday's updates, yesterday's closing Daily Wrap), there's just nothing that I consider to be immediately actionable or of any great interest as afar as moving toward our destination.

Shifting gears, when I originally wrote the articles, Understanding the Head-Fake Move... How Technical Analysis Went From an Asset to a Trap and Understanding the Head-Fake Move... Motivation (both of which are always linked near the top right side of the members' site), I intended to write a 3rd article for the series that consisted mostly of examples.

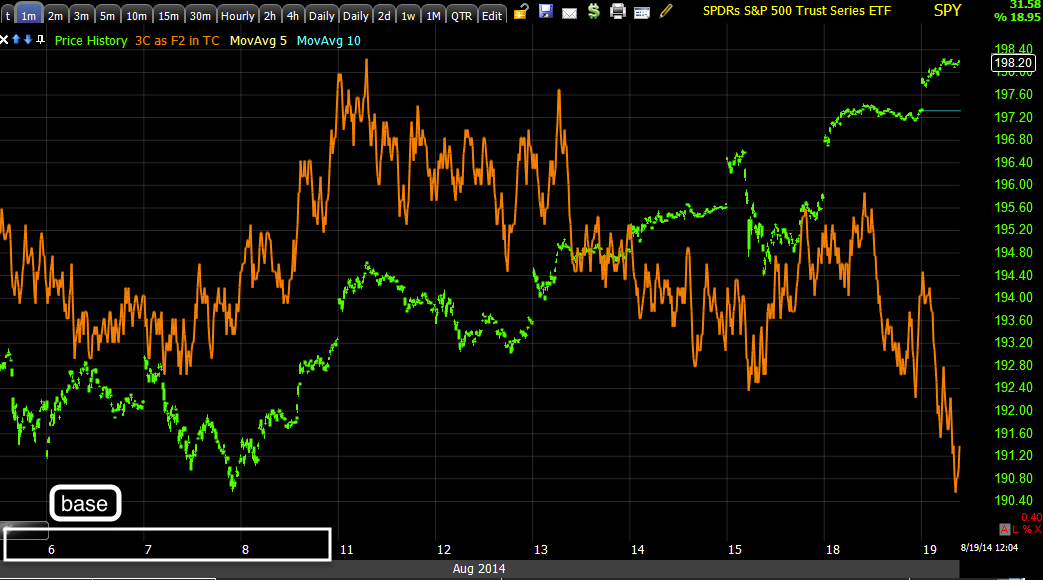
You may know I had a partial FAZ long position (3x short Financials) which I wanted to fill out on a move in XLF above the range that persisted from June to late July as it would have made the perfect head fake move and entry which I'll show in a moment.  I closed the FAZ long on August 1st in an effort to keep the gains it had made and because I suspected we'd be forming a base (based on both 3C charts and the deeply oversold market breadth ) and I also thought, "Why not just add the entire position where I initially wanted it. If you saw XLF on 8/1 when I closed the 3x Financial short (FAZ), you probably wouldn't have looked at it and thought I'd ever get close to the entry that I wanted, but I viewed it as a very high probability which is half the reason I closed the position (hold on to the gains made and re-enter at a better price with less risk and suffer no drawdown in the FAZ long as well as have a prime entry for a full size position.

Fast forward through the formation of the base (8/1 through 8/8) and the bounce off the base expected since then and suddenly XLF/FAZ are MUCH closer to the entry I wanted.

The point being, XLF is an excellent example of a head fake move and if you read the two articles you'll probably understand why and why there was a head fake move in XLF to start with. For those less interested in Financials, XLF is still an excellent barometer for the broad market and target for a pivot reversal area.

  Through June and July, even though I got excellent positioning in FAZ (3x short Financials/XLF), I didn't add the full position, I saved room in my position size/risk management to add above the range on a head fake move or "False breakout / Failed Breakout".

As you see, that move never materialized, but rather XLF broke down below range support and rather than sticking with FAZ, I recognized what was going on and closed it the first day below the range, as you can see, I didn't leave much on the table as price moved sideways (forming a base) for the next week and then set off higher.

XLF didn't have the strength to make the head fake move on its own. Wall St. firms could have bought XLF and sent it above the range as they likely want the exact same thing I want, to short Financials above the range and for a specific reason. For smart money the breakout above the range means retail buying which means demand which means larger Wall St. firms can sell or sell short in to price strength and demand, both of which they need when trading positions of their size. I want to do the same because I know that's where the big boys will be doing it and I want to follow those who move the market.

However, buying XLF to soak up enough supply to send prices higher means spending a lot of money when in fact you want to do the opposite and sell/short XLF so that method doesn't work well for the objective as they just have more XLF to get rid of.

This is where the head fake move comes in and this is where XLF's probability of a head fake move became a high probability on 8/1 when I closed the position, here's the link to that day... Closing FAZ Long and here are a few excerpts from that post on 8/1, the day XLF broke the range (which would normally appear as a good thing for an XLF short like FAZ)....

"This is just for now to lock in gains, I'll decide later if I'm going to add a long like FAS for a bounce."

I wanted to lock in gains because I didn't expect any more on the downside in the very near term. I hadn't decided whether I'd enter FAS, 3x long financials, for a bounce because the base had not formed yet (it formed from 8/1 to 8/8 not only for XLF, but the entire market). Whether I entered FAS long as a piggy-back trade until XLF got to where I wanted to see it go, all depended on how strong and reliable the bounce looked. As stated many times before, the probabilities of a bounce were good, but there's a difference between probabilities and high probabilities/low risk trades. If there's not a strong 3C divergence for the bounce, then even though probabilities are for a bounce, I put the position at risk of a sudden decline that can wipe out the entire position on a morning gap, that's not worth the risk without very strong charts to back the trade.

Now, here are the charts which will hopefully show this entire process, probabilities, where the strongest trade is and why XLF is an excellent barometer for the overall market and its reversal point although as we saw yesterday, there will be differences in relative performance , for example Financials could be one of the only sectors really performing while the rest are mediocre as we arrive at the end of this bounce move.

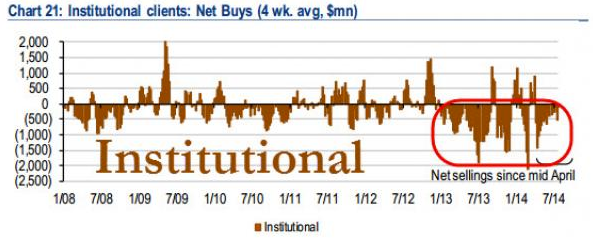
Clearly the long term 4 hour XLF chart shows distribution on large size, it's not really that much different than the Institutional net selling charts I've posted such as this one from last night...


Without even considering Apollo capital's manager at a financial conference last May saying, "We've been selling everything not nailed down for the last 15 months", you can see in the client type net buy/sells that institutional money has been actively selling and handing the bag off to retail in a classic market top since 2012.

Market breadth and 3C have shown the same things. This is just no ordinary market though, it's a F_E_D construct and smart money knew the party wouldn't last forever and started dismantling their huge positions a while ago while there was still demand by retail (who picks ups the supply -see the green line). 

One thing 3C has taught me is the major volume spikes and big price declines are not smart money selling, they are long gone before that happens and positioned to take advantage of the decline, retail has been taught by T.A. that this is smart money selling, they just don't operate like that.

Here's another Institutional net buy/sell chart...

 Here it's very clear that the trend has been distribution since Jan 2013 in size that's even larger than the 2008 decline.

The point being, the 4 hour XLF negative divegrence above is right in line with what we know about institutional selling in size, we just knew it long before these two charts came out in the last couple of months/week.

 Here's where the head fake move and Wall Street abuse of Technical traders' predictability comes in.

The 15 min chart showing more recent action went leading negative at the far right of XLF's range, it was apparent then that I would not see my head fake move above the rnage so I just held the FAZ long (3x short financials) for the time until it broke below the range.

The range was very well defined, this means a break below it is going to hit all kinds of stops right at the range's support and retail short sellers will enter the trade on what they consider to be "PPrice confirmation",  this creates huge supply (sellers from stops being hit and sellers from short selling) and at lower prices. In this case Wall Street doesn't need to put a bunch of money in to XLF to push it above the range, they absorb supply on the cheap , create a base to bounce from, trap shorts in a bear trap from which they'll be squeezed and let the market take care of the rest. The resulting short squeeze of brand new shorts pushes prices up without Wall St. having to do anything except sell in to higher prices.

 The entire reason for most head fake moves is to create sling-shot momentum without expending a lot of resources, just let the short squeeze do the work and they can make some money on a piggy back long for a week or so until they are at their target short entry which is the same as mine, above the range, which causes new longs to buy the breakout (again price confirmation) creating even more demand that can be sold/sold short in to and at the same time creating a new bull trap that will create downside momentum when price fails back in to the range, hitting longs' stops and creating more supply, forcing prices lower until the range is broken again with new shorts entering with even more supply created sending prices lower, but smart money and those like us who follow got the best entry near the top whole others are entering shorts below the range again.

 This 2 min trend shows the far right corner of the range and distribution sending prices lower and below the range where they are accumulated in a week long base, short sellers are locked in and the start of the move up / short squeeze allows smart money to sell in to higher prices as you can see to the far right (red arrow).

This is just confirmation that our original plan and thinking are right on track, but this isn't anything knew, this is a typical head fake move which was predictable sinceBEFORE the base for a bounce even started (8/1 exit of FAZ).

 The 5 min chart and XLF range, then the base (white arrow) and as price moves up, distribution in to higher prices which confirms the highest probabilities on the 4 hour chart are being realized as we move higher. I would have said the chances of distribution in to a bounce were 90+% before it even started based on the long term chart's probabilities, so this trade is not that hard to envision or forecast.

The 10 min chart showing the same.

As for a market barometer, the most probable outcome is a move above XLF's former range, it couldn't be accomplished before until this head fake/sling shot momentum move was set up, now it has a good chance and that's where I'll be looking to add FAZ back, although I'm monitoring it just in case it can't make it all the way to the intended target, volume has been very weak.

As you know, we use multiple asset and multiple timeframe confirmation for the best signals, I'd say you can use XLF and a move above the $23 range as a signal that we've arrived at our destination and therefore very close to our downside pivot which is the area where we want to take our most significant actions in entering or adding to trades (mostly shorts). Thus last week's "Patience"post was right on and based on this entire scenario that was predictable as a high probability before it really ever began.