Tuesday, August 31, 2010

This may be my last update for the trading day

I do see what appears to be some building accumulation in the SPY, but more in the Q's and DIA on a 5 -min chart. Price action is in a consolidation, almost the entire day since the move of the opening lows, this could suggest we are seeing a quiet effort to move the market higher perhaps toward the last hour of the day. Again, it is a listless market and indicators are not highly reliable in a consolidation zone as they react to the swings up and down, that's why I used a 5 min chart to give better clarity.


USO Update

The 1 min positive divergence continues-remember though, we saw quite a few in the market get run over yesterday, however we do have the oil inventory report tomorrow morning, that "could" spark a Catalyst-

Thanks GG!

USO Struggling to Gain a Foothold?

It's a 1-min positive divergence, not anything more yet, but it is in the area of the continuation flag I talked about last week, that flag may be acting as support.

TICK INDEX

This index is useful for day traders and those looking for some extra confirmation in small intraday moves that may be at very important levels. Here the Index in green goes into a negative divergence after the breakout in the QQQQ, you can see the SPY in red moving higher, the Tick Index moving lower which created the small pullback we saw right after the breakout in the Q's triangle. So far the triangle held up to the first test. Anyway, another short term tool you should look into.

AAPL GOOG

Interestingly, both are in different size triangles, that have not broken out yet, GOOG is bigger then AAPL's, but the Q's did break-these are two stocks to watch as they are bellwethers for the market. Tech like the semi conductors will also be an area of interest.

Interestingly USO and the dollar are both down now, but the dollar looks short term to medium term to be in better shape, I don't like the way oil is behaving at all, the negative divergences are getting stronger there, as yesterday, oil seems to be one place smart money is operating.

Why so Quiet?

I know some of you are wondering that, I'm just not seeing that accumulation by market makers that would propel a bounce higher, it's another day s if it's just retail traders running the show, there seems to be no plotting scheming or planning. It's strange and it makes me look at the charts in a more typical view since 3C is not showing anything really. I see a continuation triangle from just after 11 am that is breaking to the upside, so now I suppose the thing to watch for is if this bounce can stand on it's feet and the point in which smart money re-enters the market, it should be on the sell-side. That's why so quiet, there's just a strange listlessness in 3C, it's not common, I'm going to look around some more, at market leaders and such and see if there are traps being set there.

Watch this little 1-min triangle and make sure it doesn't break below the $43.60 area on the QQQQ, that would probably lead to a downside move.

Update 2

I've seen this relative divergence, it was there last night and I talked about it when I mentioned that the 1 min charts were not that far gone and sat in pretty good posture, well the relative divergence has held and prices have moved up a bit, but I must admit, this was not the kind of accumulation I was looking for, I was looking for something beyond that, something more decisive.

We'll see what develops.

Morning Trade Notes

The gap down is not much of a surprise considering how we ended the day, however whether we finish our bounce today or head lower, as we have seen so many times, the opening gap is reliable to predict just about nothing.

If there is to be a recovery and a bounce today then we should see accumulation into the opening gap, it won't be there right away, but it should appear soon.

Monday, August 30, 2010

TRADES ARE UP

I have a few shorts up for you, looking at the charts, I'm just so hesitant to put up a lot of shorts here because so many look like they will bounce and if they do so, they are in nearly perfect position to enter with such minimal risk. This market is truly in trouble. When AAPL is on your short list, you know the market's in trouble and these trades that I have for you are not already half way through a down trend, they are sitting just below major tops. If you had a high risk tolerance as I do, I'd short many of them right here and now and ride out any bounce, but that's not what is good for most people and it's the easy way, the cheap way out. Most of the trades would succeed, but you'd end up being stopped out and looking at them saying, "I could have made so much money if I wasn't stopped out on that bounce". So lets give tomorrow a chance to show us something, if we get what I think the highest probability is (unfortunately I don't feel a high degree of confidence in that probability), then we'll have amazing trades that are textbook. If the market just falls part, then we still have plenty of room to make money.

Note several trades are reminders, we've already made decent money in them and still look good. This raises the point, when you have a chance look at the trades on the short side on the list from the last few weeks, there are gems in there. Email me if you see something you like and I'll give you the update on them, just don't look at the most recent because many of those trades were waiting for something to happen that may be close to happening and others, if you have the risk tolerance are worth a shot now. Please set alerts on limit trades, please review the members only video for the SWING Entry 1 set up and PLEASE, review and stick to a risk management plan. I have a link again at the tip right of the site of how I handle risk management, it's so important and if done correctly, you could enter anyone of the shorts I out up tonight-even the limit orders, at market in the morning and still not risk more then 1% or 2% of your portfolio.

Best to all and to all a good night

The TRIN WINS


The TRIN Index in simple terms to understand works like this, a close below .70, the lower the better, the chances are good for a close lower the next day. Friday night the TRIN Index was at .56 which suggests a probability of a close lower the next trading day-(today). At 1 it is neutral. At 2 or greater it strongly suggests a close higher the next day. Today it closed at 3.81-a very high number with a strong indication of a close higher Tuesday. As of Friday though, before the market closed I had updated and told members they may want to take some profits because I had a feeling today would either be down or kind of go nowhere. The TRIN can not be used to predict anything beyond a day so it is not a concern for long range planning.

Interestingly, the market internals were extraordinarily strong on Friday, today they were extraordinarily weak, almost as if the market is entering 1-day overbought, oversold levels. The dominant price volume relationship was pretty useless, stocks down, volume down, it is the most typical relationship seen in a bear market, one thing it does tell us though is that today was not characterized as a panic sell-off, in that case volume would have been higher today.

First, lets just put this bounce in perspective-it's a bounce, not a market trend and as I warned, I would not go swinging for the fences here, but 3C still does show some revealing character about it. I just want you to understand the larger plan and strategy is a bear market strategy and this bounce's primary function or usefulness to us was not as a long trade, but to set up high probability/low risk short trades and to perhaps get the Judo concept rolling. This is not off the table as today took back about half of Friday's gain, it didn't set new lows, although it could. In that situation most of you have short positions in place by now and it would still be good for us. Now as to the analysis...

As I noted in an earlier update, gaps provide some of the strongest and most reliable support and resistance, today's highs were halted right at the gap resistance seen below in this chart
Also, as I looked at the approach to resistance tonight I saw this Ascending Wedge which is bearish.

Wedges are known to retrace their base, today's close did exactly that.

As I mentioned several times today, we did see several nice 1-min 3C divergences that were positive, a few that were negative (red=negative, white=positive). The posture below is indecisive as it could lead to a positive divergence from it's posture, but also it confirmed most of the trend today which suggests that smart money was not active and was more or less letting the market do it's thing. As I have said many times, the initial reaction to the Fed is almost always reversed with in a day or two, Friday's reaction was bullish, today obviously that reaction was reversed. Keep in mind, these 1 min. positive divergences are usually market makers (on the 1 min time frame). So what we may be seeing here is a series of accumulation at lows by market makers, then they sell into the high, operating as day traders. With seemingly little institutional orders to fill, it would make sense that they are just trading their own accounts. It's said up to 30% of the volume in a stock is the market maker trading their own account.


What was interesting was that the 5 min also confirmed the downtrend, again suggesting no real interference on the part of smart money. See above-3C is in almost lock-step with price.


The hourly chart above where the positive divergence seen for a bounce was strongest did not loose any ground today and still remains in a positive posture (see above). From what I see for the most part, it does not appear as if there was much interaction between smart money and the market today at all.

USO-or oil was a bit different. Here's the long term chart where the positive divergence was spotted and consummated.(see below)


However, below you can see a very clear leading negative divergence on the 10 minute chart pulling prices lower (below)


The dollar did close up today and that may have had something to do with it, but the dollar looks exceptionally vulnerable on the price chart of further downside (which is good for oil generally speaking). On one min charts there's confirmation with a negative bias, on the 5 min chart there's a clear negative divergence. (below)


This is one of those moments that doesn't make a lot of sense. Both oil and the dollar seem to be under short term distribution, oil was effected negatively today, while the dollar seems as if it will be affected negatively shortly. The trouble is that direct comparisons between the two commodities can not really be made with 3C. It's just telling us that there's distribution, how long, how much, how deep, we can't know with precision, although the negative bias of the 1 min chart in the dollar suggests it may turn very soon, presumably good for oil. To further complicate matters, when looking at at the candlestick formations between the two, the dollar's short term is positive, while oil's short term is negative.

This is one of those moments where there is no clear edge as of now. If I had to absolutely bet on the short term direction within the next day, I would bet oil has another day of downside at least and the dollar has another day of upside-or at least that would be the first half of the day's trading. Notice I used the word “BET”. When I trade, I don't bet, I look for high probabilities and I don't see them here right now. There's long term 3C room for more upside in oil, but as I mentioned, there's no way to know how much their average accumulated price is, therefore no way to say, “They must take oil to $XYZ to make money on this trade”.

Looking purely at price action, being I can't find a strong edge in the mixed readings (which can be a function of the short term charts leading in the probable direction while the long term charts take longer to turn) I see very bearish looking patterns in all 3 major averages, it's a daily bear flag. Being an obvious pattern it is susceptible to a false breakout to the upside, which would make sense with our analysis up until today-that is what we were looking for-a malicious bounce. A bear flag is a bearish, downside continuation pattern and is obvious in all the charts below.


There is no real support anywhere to stop these averages from crashing. A false breakout-the malicious bounce or Judo Concept- would fit perfectly into this scenario. Again, this is why I stressed that the bounce for our purposes is not so much about a long play as it is to set up the bigger short play picture. If tomorrow, we do see a breakout above these flags, I would seriously consider selling short into it or at least getting my positions started, or add to them if they are in place. On the other hand, we also must watch for a false breakdown and then a rally back into the flag, in my opinion it is the lesser probability. If prices broke down from the flag, I would be very tempted to increase my short holdings.

There are very few long term 3C charts that do not look bullish for a bounce, however, as I explained, the change in character will always start in the shorter charts and filter it's way into the longer charts unless there is intense institutional activity which I did not see today. On the other hand, we can see short term moves that take the market lower with the short term charts negative all so they can accumulate positions at lower prices for something like a bounce, the difference is, at some point, we must see the short term charts turn positive indicating that the accumulation has begun. So you could say we are at a cross roads of the unknown at this point.

In cases like this, I want to be prepared, but I don't want to commit or over commit until the probabilities have lined up in my favor. We do have the high TRIN reading, it could produce a false upside breakout tomorrow and the short term 3C charts are not so far gone that they could not produce that bonce with a close higher tomorrow. The downside projection of the ascending wedge was fulfilled. As you know from my analysis last week, I expected this bounce to end at some point this week- many of you who have emailed me have received that response. This is what makes logical sense to me, but I want proof.

So, if there is a bounce tomorrow and I had any long positions in the market-oil needs to be evaluated separately, but it it also true to a degree- I would be looking to unload them into strength, Furthermore I'd be looking to go short into strength. I would not at this point be chasing any more long trades other then those that trigger, look good and you understand and treat them as counter trend trades with excellent risk management. For that reason I will be adding short ideas to tonight's trade list.

One last chart that suggests some earlier strength in the a.m. which could lead to further strength, as price sold of into the close, you can see in the blue box a strangely positive looking Tick Index. (Tick is in green, SPT in Red-red arrows are tick negative divergences, white are positive divergences). See below


On one other note, I have heard from several people, mostly dealing with Scottrade that they have had positions, profitable short positions that are being closed by Scottrade. The only way around this that I can see is to buy inverse ETF's, meaning you are long the ETF, but you have short exposure to the market. They can not call back a long trade for a lack of shares to loan. Understand though that I do prefer a mix of inverse ETFs and real shorts as each have their benefits and short-comings.

On a personal note, as you may know, my wife and I are going through the immigration process, so I will not be around tomorrow after about 2:30 until after the close. Thursday we have our interview at 10 am, I'd hope to be home with great news by 12 pm. She's very patient with the time I put into the market and WOWS, so I hope you can be patient with me for these two days. So that is my schedule this week. Please wish us luck!


Update -close

The 1 -min positive divergence is still in place....

TRIN INDEX

As a member just pointed out the TRIN is nearly at 2, typically a TRIN reading of 2 sees a close higher the next day.

Update 2

It looks like we have a pretty good positive divergence in the SPY 1 min chart, suggesting we should see an upside move shortly

Update

You can see the negative divergence earlier today, but right now there's the start of a positive divergence on the 5 minute chart, which is more important then the 1 minute chart. It appears there's buying going on here. Lets see how it develops.

Update

3C is still pretty much in line with price action, there's no short term positive divergence yet really that would turn the intraday-1 minute trend up. There's a support zone at $106 on the SPY, which makes breaking that and triggering stops an attractive option for market makers/specialists. Whether they do or not, I do not know. If they did, I would think we would see some sign of accumulation in that area. IT may accumulate before then too, I just can't say until I see it.

Actually we just got something that looks a little positive as a possible 1 -min positive divergence. Let's see how it develops.

Still There

That negative divergence is still there, I would not like to see the SPY cross below $106.25.

This is still early trade and I shouldn't be hitting alarm bells or anything, but this could be in relation to the low TRIN results from Friday. The Tick index started looking more positive around the 10:30 lows, there were also a few positive looking 1 min divergences, but nothing that has turned the 5 min chart yet.

Resistance Zone

We have some shorter term negative divergences that seem to fall at a decent area of resistance. Being it's still early trade, the market makers tend to rule this portion of the day and they have a million games. It's difficult to judge as of yet whether this has any broader implications for the bounce or is just normal morning action.

The first trendline shows an intraday low on 8/20 acting as resistance and the more important in the higher trend line as it is gap resistance which in my opinion is some of the strongest resistance and support, that's at the 8/23 close.

The Weak Behind, The Week Ahead

Sorry for the delay in the post, we (my wife and I) did some house hunting and ran into the absolute worst rain storm I've ever seen about an hour and a half away from home, it also takes me several hours to put together an update like this.

So last week I hope we all learned something about the market. We saw oil under accumulation, horrible economic news which does not benefit oil much and then a US Oil Inventory report that was so far from consensus, it's absolutely amazing it didn't break down and sell-off. We saw accumulation into the lows and I know many of you bought them on the updates (that's great-you conquered fear) and we saw one of the most improbable rallies in oil I've ever seen. The dollar was even up the first day so it didn't contribute to the oil rally (a sinking dollar can rally oil). The only explanation I can think of is the accumulation we saw days earlier. Smart Money bought and they were taking oil higher, THEY DON'T LOSE. They set the game board.

Here we see the early warning I told you about with accumulation seen on this 15 minute 3C (version 2) chart as early 8/18 and a huge spike on Wednesday the 25th at the initial sell-off lows. Like I said, they had the game board set, it was going up one way or another, this chart makes their intentions clear.

Then we saw nearly the same thing in the market, economic news coming out was one bad story after another, but we had been seeing the same tell-tale signs of a bounce brewing. They (smart money) broke the market below $10,000 on the DOW which is a huge psychological area for investors and the media, but in reality in means nothing. Dow $10,000 is no different then $10,017.11. This is part of the game, part of how Wall Street and their pals in the financial media brainwash us to do what they want; they know the human mind gravitates toward whole numbers and they make $10,000 a big deal so they can take advantage of it. Why do you thing a retail outlets always sell something for $9.99? It's psychology, that $.01 deep down in our subconscious makes $9.99 sound like a much better deal then $10. So when they broke $10,000 on the Dow Jones-30, stops were hit, short sellers jumped in, we saw accumulation and I know many of you bought for the bounce down there below $10,000 where Smart Money was buying (again, great job in controlling fear and using risk management). The average trader thought that the market broke such an important level, surely they believed it had to keep going down, but it didn't-it went up. Again, the game board had been set up in advance. Last week, those two calls I had to make were extremely difficult for me to publish. 3C said it was true, but everything in my mind, had I not seen 3C, probably would not have agreed. It was a major test for 3C and it passed and I breathed a big sigh of relief-these were very strange rallies to see.

The SPY 60 minute 3C chart above (3C in blue-version 3) shows distribution (red box) from about 8/2-8/9.Price is headed higher as you see with the first red arrow and 3C does not go higher-this is a sign of institutional distribution or selling, what we call a "negative divergence". We see what happens with the second red arrow-prices fall, but it's not long before they (smart money) start buying cheaper prices as you see 3C rise at the white arrow while prices fall-this is an accumulation or an institutional buying signal. Look at the two white boxes, at the lows in price, 3C heads consecutively higher showing even more accumulation and then prices jump.

This is the same chart but the DIA ($100 on the DIA=$10,000 for the Dow Jones-30). Note the same sell off at the highs, and the same accumulation as price declines. Note the white boxes, both times Dow 10,000 is broken (under the red vertical trendline) and 3C moves higher-then, the price reversal up.

So now we have this bounce that has started and where it will go is unknown as of yet. My first impression is that it is there for a reason and my impression is that the reason is it will be used as a scare tactic, a short squeeze and to bring longs back into the market. That's another lesson to understand; humans generally speaking are hopeful in the market. We want to believe the market will rise and that's how to make money. One reason is because Wall Street has done such a good job in scaring people to go short a stock. People have an irrational fear of being short, they believe that losses can be unlimited while the potential gain is limited to only 100% (that would be if the stock went to zero). They also make it seem confusing by letting us know what the mechanics of being short are. They are simple, you hit the “Sell Short” order, your broker will do the rest. You don't have to worry about the mechanics. Your broker will also stop out your position or issue a margin call if it goes against you, losses won't be unlimited because they'll cover the position themselves and you should NEVER meet margin call with cash in my opinion-you close the trade. This article from Trade Guild will show you that you CAN make more then 100% being short.

And this chart will show you that you can make money much faster being short then long. Why? Because fear is the strongest emotion in the market.

It took 4.5 years for the SPY to rally, in 1.5 years that entire rally and more was destroyed. You see how being short can make you more money, faster?

Why does the market want you to fear being short? It's simple, most Americans or many more then you'd think, participate in the market through things like 401k plans at work. Even though they may not be the active traders and investors like you who watch over your portfolio, they are tricked into buying Mutual Funds with names like “High Growth” or “Low Risk” or phrases to that effect. Whenever you have money in the market, it is always at risk, why would you not want to make as much as possible considering it's at risk anyway? For decades Mutual Funds were only allowed to buy stocks long, it was relatively a short time ago when this ban was lifted. So there were decades of Wall Street brainwashing to make people afraid of being short for the simple reason that if people had known the truth, it would be harder for them to sell their products. They demonized short selling as un-American, risky, complicated, etc. That stereo-type has stuck and Wall Street knows it's still embedded in the mass collective cultural thinking of Americans.

Back to the bounce this week....

I believe it may be a scare tactic. The market does bounce as a normal function of profit taking by shorts and enthusiasm by long traders. However, what we saw this week was very well thought out and planned in advance. I even talked about what might happen on Friday with the revision of 2010 Q2 GDP and Bernanke's statements in Jackson Hole, WY. I said this was likely a catalyst to start a bounce, even though his statements meant nothing and... the market rallied. Think about this for a second, GDP was revised DOWN from 2.4% for Q2  to 1.6% and the market took that as good news and rallied all because the analysts and economists of Wall Street had set the stage for expectations to be lower. So the GDP that was revised down to 1.6% was taken as good news and sparked the rally according to the talking heads-however we know that this was a setup because we saw them setting it up before hand. Can you imagine, GDP went from 3.7% in Q1 to 2.4% in Q2 and then was revised even lower to 1.6% and Wall Street had people fooled into thinking this was good news because “it wasn't as bad as expectations” that Wall Street set in advance? The economy is flat-lining, it's nearing a double dip. Look at the GDP, 5% , to 3.7% to 1.6% in 3 quarters. Does that truly seem like good news? Again, I repeat, Wall Street set expectations lower and created a bounce on a HORRIBLE revision, they set up the game board and the bounce.

Again... why? I think it is what I would call a malicious bounce that will scare people who are short, bring in the longs and when it goes high enough they'll drop the market and use what I am now calling the “Judo Concept”

The Judo concept is when Wall Street uses your actions, against you to achieve their goals. Imagine that they can get the market up higher by creating a lot of demand from both shorts that are buying to cover and long traders who are hopeful that this is a recovery in the market. At some point smart money goes short and they drop the market. The longs are now selling and the shorts are now re-entering the market. Their using us to create the snowball effect both up and down as they play the opposite side of the trade. In Judo (a form of martial art), the Judo practitioner uses their opponent's own energy against them.

Above is a version of the “Judo Concept”. In the blue box the market makes a new high on relatively lower volume, a new high should see buyers aggressive, the lower volume shows them backing away from higher prices-this was a warning. The red box shows two days of “Doji-reversal candles”-there's no momentum left on the upside and volume is rising here on the sell-side. The next day the S&P-500 makes a new high on even lower volume (yellow box)-this is the false breakout, the Judo Concept. Buyers enter the market buying a new high, institutional money goes short selling short to the average Joe long buyer. Then they take the market down the next day. The longs from the previous day are now at a loss, short sellers think this could be a false breakout and enter the market, you can see what happens next, supply overwhelms demand and the market falls. Institutional money didn't have to do anything other then create a slightly higher high and the Average Joe did all the rest of the work.

Here's an hourly chart showing Institutional money selling short into the higher prices (this is the same period as the chart above, just on an hourly chart).

So we have to watch this bounce, understand that this may be the plan and do not panic if we do see a big bounce up (if you are short) and not get overly optimistic if you are long the bounce. The idea in the end will be to bring the market down quickly and far, that is my opinion as of now.

However, we did see a very low TRIN reading Friday of .57. A reading this low often means the market will close lower the next day, but not always.


Look at this chart of the TRIN Index (above) in green and the SPY in red. We see a red square with a reading of .38 and the next day the market was down. However, in the blue square we see a reading of .29 and the market was not down the next day. The difference between the two is momentum; early July was the start of a strong rally and late July was near the end when momentum was fading. Friday was strong momentum, so while there's a statistical chance of a down or weak day on Monday, I wouldn't be too concerned about it.

So now we watch for distribution, it may give us an excellent opportunity to get into excellent short positions at great prices, with much lower risk-if this is a scare bounce, it will only help us and I have hundreds of shorts lined up for this. If you want to play the bounce, on Friday I listed a number of leveraged ETFs (UPRO, QLD, UWM, SOXL, URTY, TQQQ, FAS and UDOW) that would be better then most stocks. The reason being is stocks are subject to sector rotation, some are in favor while others are out of favor. However a broad market ETF will rise with the market, there's no need to worry about sectors. I'd recommend not taking this bounce too seriously, I would not invest a lot on the long side as it can turn quickly and it is counter trend, however, if you can watch the market and updates you may be able to make a decent little profit, just don't get greedy and don't be fooled into thinking that this is a new bull market.

Right now 3C is a little mixed very short term, so I'm not making predictions on tomorrow, but both the market and oil have several 3C charts that are in line with price, meaning making new highs with price or confirming the uptrend. A couple are lagging, but none are showing anything ugly that suggests the bounce is over. I believe even if we have a weaker day tomorrow, the bounce is just getting under way. My guess is that it lasts throughout the week.

PLEASE, set alerts for the stocks on the watchlist. You can use www.FreeStockCharts.com if you don't have a charting system to do it with. These are REAL-TIME charts, are one of the only free real time charting systems I've seen. Or you can check out TeleChart and StockFinder (the software I use) by clicking the tabs for them at the top of the page.

If anyone has stock specific questions or any questions about the risk management I use (links are at the top right of the site- RISK MANAGEMENT) please email me. If you email me during the trading day and it's urgent, please put “URGENT” in your subject line.

Have a great week, lets hope this is a scare bounce as it will do wonders for our core short positions. After all, our main strategy is short this market.

I apologize for the late post, now I have to apologize to my wife :)


Friday, August 27, 2010

Short Term Profits

I was just made aware of the TRIN being at .53, this usually will mean a close lower the next trading day, that is not uncommon in a bounce, but there's a chance and I wanted to let you know. It doesn't in itself mean the bounce is over, just Monday has a piece of the puzzle suggesting a close lower.

I get a little help from my freinds

keeps playing over and over... look at what happened to that divergence I showed you in the last post...

It turned into a leading divergence. It's leading because price has not yet attained the highs we see in the middle of the chart at $106.80 or so, but 3C is at a new high. That's called supporting the market.

Possible intervention

Red=negative divergence, white=positive. It's not the strongest divergence and again, I'm really getting microscopic on this, but it's possible intervention to support price. This is not the kind of strong, obvious divergence I'd bet the house on.

Hopefully my typing will be faster

I suspected this triangle, it hasn't failed yet, but I'm not getting good 3C signals and I'm guessing it's because the market is not being run right now by anything other then "dumb money". So I switched over to the Tick Index...

In white is the SPY, in green the tick index. You can see to red trendlines which show the SPY triangle and then the breakout, tick should have headed higher, it didn't (red arrow), however, there are the first signs of a possible positive divergence here (white arrow). Any of you who have TeleChart of StockFinder can watch this too, just go to symbol "$TICK" and put in a comparison symbol like the SPY or whatever average you choose. As I write the Tick index looks to be carrying on the positive divergence. I'll keep watching 3C as well for any sign of institutional or MM support. As I said, their strategy seems to be clear, but tactics are always a question.

So I don't Blow This Out of Proportion

This is a very robust 30 min chart. As I said last night, a 30 minute chart with a positive divergence can create a rally like July, I'm not saying to expect that, just making the point it's important. Between 8/17-8/18 the negative divergence (relative) pushed prices down to their lows. Accumulation can bee seen here on 8/24, again below Dow 10k on 8/25 and again today. The divergence now is in leading position so overall, despite the intraday bumps and dips, we still have a healthy looking bounce ahead. For 3C users, there's also a negative divergence between 8/19 and the opening gap up on 8/23.

Sorry I can't type faster.

There's the triangle, there's the breakout as I was typing the last post. Note volume is curious, the red spikes should not be there and the breakout should have more in the way of volume. It's possible/probable that is retail short activity. Smart Money will support the market if they feel it's needed, but right now they are counting on retail to create that momentum-especially this am's shorts under Dow $10k. I'd suspect they'll come into the market at some point and cover, I'm not sure we have seen that yet and may not until the gap is filled.

Watch for a retracement that does not fall below the triangle, it should be on lighter volume and then a push to new highs-hopefully on heavier volume and then we can put the question of this triangle behind us. Remember, this is kind of knit-picking.

Watch this triangle

There's a small intraday triangle from about 2 pm on, it's obvious and I have a couple of 1 min charts showing a negative divergence. Watch for a break below, we want to see that recover quickly to a break above, otherwise they may be setting up an afternoon sell-off, perhaps with a rally into the close.

3C can give "fuzzy signals" in a congestion/consolidation zone, as most indicators do. I checked the more robust 10 minute which is devoid of the intraday noise and it appears to still be on track in confirming the trend, but a little low compared to equivalent past price levels. This may be a function of the fact that there is little accumulation occurring, that was already done. What we want to be on the watch for now is the signs of selling or distributing and i can't see that on the 10 min as of yet. A breakout north of the triangle that holds will probably pull 3C up to appropriate levels. However, as we talked about this a.m.-obvious patterns are easy targets to take out. So watch for a breakout, good volume wold be helpful. On the SPY, it will be around $106.70.

An afternoon retracement is not something to get worked up over, they are common especially as day traders exit the markets. The close is what will be meaningful.

Managing the Oil Trade

Really the concepts here can be used to manage any trade, you just have to find what works and what works for you. Unless something major changes, I always try to stop out of trades on the close, there's too many intraday games and you'll be knocked out of the trade like with the false break down this morning.

Above we have a large bull flag which is an upward continuation pattern. I tell you, when something is obvious to you on a chart, it is obvious to most traders and certainly the mrket maker who specializes in that stock, all day every day knows it better then anyone. The market maker also knows where the stops are, both because of the pattern and where hundreds of technical analysis books have taught technician's where to put their stop in a pattern like this and because the market maker has the order book at their disposal. Just about any order entered with a broker is in their book. So they run the stops, just like we saw happen yesterday when the Dow broke below $10k and this am as well. So you have to be aware that this is always a possibility, a false move. Now that the flag has broken out to the upside, in part propelled up by my "Judo Concept" , it's time to move your stop up to lock in gains and not let this turn into a losing trade.
My Trend Channel that I wrote is a very good tool for this, but you need TeleChart or StockFinder to use it as that is where I wrote it. If you want, there is information at the very top of the site on both programs, I'll be happy to share the Channel with you. Right now, the highest point of the lower channel line represents the stop on a market close, it will continue to move up as long as the stock does.
Above is a tool you can find in almost any free charting software called an Envelope Channel, it's not as good as my channel but it can work. You can see the settings and the timeframe on the chart. This is another possible solution. Feel free to contact me with any specific questions.

Update

There was a small negative divergence at the highs a few minutes ago. The 5 min is in an improving leading divergence.

A bit early, but...

I don't know what CNBC usually sounds like, but I'm hearing the market being pumped a bit, I'm hearing them talking about moving into S&P stocks for higher yields then bonds, I'm hearing that Berenanke's speech was pretty much the right balance at the right time.. it sounds like Wall Street's spokesman are pushing this as a positive event, which is what I expected to hear under my scenario.

The market is now positive so it took the revision news in stride and seems to taking the bait. The fact the market hasn't sold off is telling us something in itself.

We are positive and close to new highs. There are plenty of leading divergences in the 1-5 min 3C charts right now.

Unconventional Measures?

That may be what main street will buy, and that which Wall Street knows to be a joke.

The Fed released 3 things they can do to stimulate the economy, none of which seems unconventional at all. It's if the Fed is implying, without saying, they have a secret weapon, something no one has thought of, an "unconventional approach", however as I said, the 3 measures laid out were far from unconventional. This is what I was looking for, something that bolsters the confidence of the ordinary Joe in the market, but something Wall Street knows is nothing more then a shadowy, vague set of words. We could have our spark that ignites our bounce.

Since I refuse to, anyone watching CNBC, let me know what the climate is there, how they are spinning this story, especially as it relates to speculation regarding unconventional.

Ahh I guess I should do my job and put on CNBC-just remember though, I'm doing this for you.

It takes me time too


Here's the DIA with the start of what could be a leading divergence.

Update

I think the failed gap, plus a break below 10,000 was blood in the water for the shorts. As you can see, at 10:03 we got a positive divergence. The first story I've seen out of Bernanke's speech was 10:07 although it broke earlier obviously it takes time to get it out so I think that had something to do with the timing of the divergence.

I'm surprised so far, what's he's said doesn't seem to be anything more then, more of the same. We'll see what else comes out.

No Surprises Here

As usual, the a.m. retail gap up has been faded, the red arrow shows that clearly and we had a small white arrow divergence sending prices briefly higher from there. Remember though, if my assumption is correct (and so you know, I hate making these-I prefer rock solid evidence) then we won't see the catalyst for a rally until Ben's statements are released to main street, so don't read too much into what we are seeing just yet.

In the World of Wall Street Lollipops Taste Like Rotten Fruit and Rotten Fruit Taste Like Lollipops

The GDP was revised down as mentioned to an astonishing 1.6% from the initial 2.4% and that's good news, the market looks set to open higher! That's because economists (they're worse then weathermen-sorry if any of you are weathermen/women) expected a worse reading. However, just stop and think about that, from 5% to 3.4% to 1.6%, that's an alarming trend.

In any case, we are in Mr. Wonka's Wall Street and the pressure is on Bernanke to ratchet up the rhetoric. Wall Street knows and has known, their not waiting on Bernanke's speech to make plans, but Main Street is and the Administration is. The public is a panic that things are going to actually get worse is going to actually make things worse so Bernanke is going to have to pull out a remarkable speech to turn that tide, even if it is meaningless. This was the thrust of my reasoning behind what we are seeing in 3C. At 10 a.m. MR Bernanke starts his speech, watch for Wall Street's reaction because from what I understand it will be behind closed doors, at least fora bit.

Honestly though, consider what our core strategy is, it's not a bounce, but a bounce will help it. Now consider the state of the economy after every kind of stimulus you can imagine has been unleashed. Can you say Double Dip? I can even spell it D-o-u-b-l-e- D-i-p and the world will be right there with us. Again, this is why I tell you, we have an opportunity perhaps not seen in our generation to operate in a market that few will play in and far fewer will understand how to play in. The Wolf Pack is gathering, the full moon is rising, the scent of prey is in the air and the hunt is beginning. Welcome Wolves,  to Wall Street.

Thursday, August 26, 2010

If This Doesn't Get You To Set Alerts, I don't Know What Will

The GOK Trade 

Jackson Hole

Tomorrow morning the Commerce Department is set to revise Q2 GDP which came is at 2.4%, it seems that the market has already anticipated and accepted that GDP will be revised lower. These things, unless they come as a huge surprise, are generally priced into the market already. It may be a shock to main street, but it's not likely to be a shock to Wall Street.

It will be difficult for Bernanke to standby idly as he did at the last FOMC meeting and announce half measures in the face of a GDP number revised lower, there will be an expectation at least from main street that he's going to be more aggressive about it. However, most on Wall Street already know that there are few tricks left up Uncle Ben's sleeve, especially when considering all that has been thrown at this economy already. Perception of the general public will be important, even if the measures announced in reality do not add up to an empty glass in the middle of the desert. The last thing the Fed wants to see is consumers running in greater fear,  not to spending, not purchasing homes, small businesses laying off more employees; I think Bernnke understands he's going to have to put on a show. Will Wall Street buy it? I think the answer is they know the truth and literally have already bought it (see 3C charts).

A hyped up bunch of main street investors may offer Wall Street an opportunity to make a little extra money and set up the game board to their advantage. Nothing passes by Wall Street without some bright mind figuring out a way to take advantage of it.

So the positive divergences that have been seen on recent 3C charts suggest Wall Street may be trying to use this opportunity to do what they always do, make money and set up small investors for the fall, holding the proverbial bag.

As you can see by today's charts, it appears that there wasn't a panic sell-off, it appears that the market makers and specialists worked the bid and ask lower all day until the ultra important and absolutely meaningless, Dow $10,000 level was breached, which also happened to coincide with a support level in the SPY that was breached at the exact same time.

What happens below $10,0000? As I've expressed many times, the human mind gravitates toward whole numbers and Dow $10,000 is the Royal Flush of whole numbers, but beyond that, can anyone tell me why $10,000 is an important level to our society? I bet you can't, there's nothing anymore special about $10,000 then there is about $10,019.21; it's simply in our minds-just like the $9.99 sale rack-retailers don't want you thinking in whole numbers because that extra penny makes a big difference in our minds. The market has a lot to do with our minds, we create these meaningless benchmarks and when they are broken, we act on them. Look at the volume as 10,000 was breached-whatever majority of longs were left in the market they set stops and were stopped out. The salivating shorts jumped in on the short side, after all.... “WE BROKE 10,000!”

While all this was happening, 3C was one of the only indicators probably in nearly all of technical analysis that was on a steady march north, this is a positive divergence and implies healthy accumulation, but this isn't the first time we've seen that recently. Think of the unthinkable rally in oil yesterday.

I'll explain my “JUDO Concept” one more time. It boils down to the simple exercise of using one's own momentum against them. For instance, short sellers below $10,000 are salivating at the chance to make quick profits as the market heads lower in their collective imaginations, but what if... the market headed higher? Retail or regular guy perception of short selling is very badly flawed, even for those who participate in it. There's a bigger fear of being short then long and it is totally unfounded, but it is what Wall Street has sold us for decades because the simple fact is, the products that they are able to sell to the middle class masses do not include short selling; on a managed account basis, that is reserved for the elite who are called “Qualified investors” and invest in Hedge Funds that can go short. It's all marketing.

So assuming our market goes higher, between the real losses short sellers will feel and the instinctive fear of losses greater then what is actually possible, we get a “short squeeze” which simply means the shorts try to mitigate their losses by covering their positions and covering a short position is in reality, buying the equity back or put another way, it alters the supply demand dynamic and shifts it toward an imbalance that is heavy on the demand side. When we have more demand then supply, we see rising prices. The more prices rise, the greater the loss for remaining shorts, they then cover and increase the demand, prices move higher and the cycle continues. At some point in that cycle, the average investor, whose psychology is arbitrarily and inherently bullish (again, this is due to decades of Wall Street brain washing) becomes fearful, fearful that they are missing out on a real rally, “maybe this is the bull market” they tell themselves and they further throw off the supply demand dynamic with their buying. Before you know it, we have a real bounce and the further this bounce can carry, the more it favors the game board Wall Street has set up. If the bounce can break some technical levels or show extreme momentum, even the hardcore shorts are forced to cover. Technicians now look at the market and see a technical breakout. Really though, of you are biased enough, the market will show you what ever it is you want to see. As Wolves, you job is not to see what you want to see, it is to look for what really is. A wolf would never imagine a rabbit, but if it sees one, it surely will give chase.

This is the scenario that I hypothesis is taking shape. As I said, it's a guess, but everything we do in the market is a guess, the only difference is whether it's an objective, or an arbitrary guess. That last sentence is the difference between gambling in the market and trading/investing.

So I'm looking for stimulus that triggers upside momentum, a scare rally (which will not scare me out of my shorts as I have no objective data to suggest this market is or is about to tun bullish). At some point it will end and now the bulls, the longs will be the ones being setup. The market declines (remember that initial Fed policy statements are almost always reversed within days. As the market heads lower (and the bounce will set up hundreds of high probability , low risk shorts) this time the supply demand equation will be shifted toward supply and the further it falls, the more supply there will be, this equates to lower prices. This will probably be the last Hurrah before the market takes out it's last bastion of support and when that happens, we enter a trending market, with our portfolios stuffed full of short positions that gain every penny the market drops.

I also believe-bounce or not, we will enter a new kind of market that most people have never seen, a secular bear market. We've been in a secular bull market since the early 1980's. Most traders have never experienced such a market and all of their concepts of the market will be in direct contrast to reality, this is why I say over and over that we have a historic opportunity to make money.

Now, I was asked has 3C ever been wrong before, the answer is, I think so. Whether 3C is wrong or whether smart money changes it's mind, I can't tell, they do change their minds and smart money is not always so smart, think Lehman Brothers. However I do not recall ever seeing a divergence this complete fail. If you study the charts that I post you will see a nearly perfect correlation between divergences and reversals. IT tracks smart money, it does it better then anything I've seen in well over a decade of studying and teaching technical analysis. The biggest drawback to 3C is user error, not understanding it's complexities or looking for what they want to see rather then looking at what is.

Tonight I'm not listing any trades. We have plenty in place and I've given you many ways to play the bounce. You don't have to make this harder then it needs to be. Consider the longs from last night which are all short squeeze candidates or just use a simple leveraged market ETF-I prefer ones based on the Russell 2000 or the QQQQ. Here are a few symbols: UPRO, QLD, UWM, SOXL, URTY, TQQQ, FAS and UDOW. Keep in mind that if you play this bounce (or what I believe the odds favor as a bounce) that this is a quick counter trend trade and should not be a huge position. You may even want to consider a 1% rule. Keep your eye on the real prize and those are the short positions that are for long term trending, the positions we'll probably hold for 6 months or longer. I want to enter those positions on market strength and a little at a time to get exposure, but take advantage or rising market prices if possible-sometime you never know when that turn will be exactly and how far the first day of it may carry the market down.

Here's an update on the dollar. I feel longer term the dollar has more upside, but in the near future I believe it will take a hit. Eventually I feel it will go down. So maybe it's best to say long run down, midterm up, short term down.


This is a daily chart, you can see the red negative divergence and the white positive divergence.


This 15 minute chart is a little more difficult to understand, but just remember this, if 3C confirms a trend, there is no accumulation or distribution and it does almost exactly what price does. However, when price moves lower and 3C either moves higher or fails to move lower, you have a positive divergence or accumulation. When prices move higher and 3C fails to do the same, you have a negative divergence/distribution/selling. In the box, price is close to a new high, 3C is making a new low, or vice versa, this is the strongest divergence.

Also, the longer the timeframe chart, the more serious the divergence.

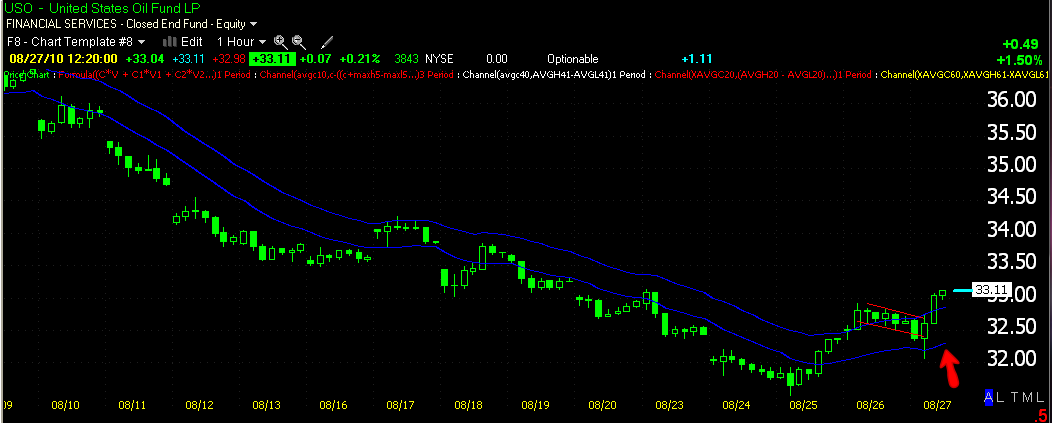
Here's an update on Oil.


This is a 30 minute chart so it is significant. The July market rally was caused by a 30 min divergence.


Here we have a 5 min chart of USO, it's the earliest timeframe that can still show direct institutional investment. Note that it started in a positive divergence as we had already been seeing that days before in the 30 min chart above. The second arrow makes particular note of the accumulation that happened after a horrible inventory report and at the lows of the downtrend. You can see, 3C confirmed the uptrend today and of note at the far right is the pullback in the late afternoon today, 3C carried on higher to form a leading divergence. IT appears the oil trend has more room. I think I published a rough VWAP estimate of the target yesterday on a daily VWAP chart.

Today's market....


SPY 1 minute. As you can see, the gap higher was immediately sold off. The second red arrow shows the highs of the day, sold off-remember this is the market maker/specialist timeframe-part of their job is to accumulate positions for institutional money, the lower the price, the better. After the highs were sold off we saw a moderate, but persistent downtrend in price, 3C was slanting up the entire time. And the second white arrow shows where the Dow broke 10,000-no selling by the market maker, just accumulation of the supply that was available when supply outweighed demand as sell- stops were triggered and shorts sold. Finally as the Dow plunged in the last half hour or so of the day, 3C went into a leading positive divergence.


If it were just one chart and 1 3C version, I may not feel as confident, but here's the DIA and a different version of 3C, I didn't draw any lines because they are exactly the same as the SPY chart above. What are the random chances of that?


And here's the institutional 5 min chart of the QQQQ

Questions about the market's bearishness?
NASDAQ 100
S&P-500
Dow Jones 30

Nuff said?


How About The Oil Trade? Anyone Make Some Money There?

A lot of analysis went into that one and a big step out on the proverbial limb. Please tell me someone made some cheese there?

Time to Go Out on a Limb

I hate doing this without really clear evidence. I have that on the 1 min 3C, the 5/10 min are mixed, the 15 is positive.

Bernanke is the big deal tomorrow. I always assume that what he's going to say for the most part has already been leaked to the market.

Today we saw the retail gap up and a slow, steady descending channel down right through Dow 10,000. The way the channel moved down slow and steady leads me to believe it's the work of market makers just adjusting the bid and ask all day to bring prices down, right until they cracked Dow 10,000. At that point volume picked up for two reasons, any longs most probably put their stop at that level-it also correlated with a support line in the SPY/S&P. Once broken longs stop out, shorts dive in. I would think if I were institutional money and what Bernanke was going to say was going to move the market down, I would want to keep prices elevated all day and short into them. The fact they moved prices down and 3C moved up, suggests they were accumulating today and drawing shorts into the market. This is the Judo concept.

So don't take this as the gospel and don't send hate mail if I'm wrong, it's my working hypothesis and it's the most likely course that I see right now. As the market moves off Dow 10,000 higher, the shorts are squeezed, they cover adding to demand which=rising prices.

That's my take. You have to decide whether it sounds whacky or plausible and what you'll do about it. Remember-CASH IS a position.

Now Above Dow $10k

This smells like a fishing expedition for stops under an obvious $10k Dow. Lets see what kind of momentum we get.

I can't Believe I Missed This

Even more important, the break at the same time took out the 10,000 level on the Dow-30, volume increased dramatically. Remember what I say about putting stops at whole numbers and that is the most obvious whole number in the market.

Gunning For Stops?

This is today on a 1-minute chart, note the descending channel the SPY has been trading in since about 11:15 a.m. The lateral trendline is the close two days ago, which was resistance before yesterday, once broken it becomes support and a very obvious area for stops to congregate. If you look at the intersection of the channel and that support zone, that is where the market broke out of the channel, the increased volume is order flow, probably mostly stops.

 All 3 versions of a 1 minute 3C chart show a positive divergence at the break-really a positive divergence throughout the descending channel. My interpretation is this is accumulation into lower prices and especially when the stops were triggered, someone has to absorb the supply and we didn't get a negative divergence there so it would seem again, they took shares on the cheap. This is also the false breakdown concept I talk a lot about, sometimes I call it (the Judo concept) of using your opponents energy against them, in this case, if it is indeed a false breakdown as the charts seem to imply, then we would expect to see a move up very soon that is fueled by this false move down. We will know very shortly.