Tuesday, August 24, 2010

TONIGHT'S TRADES ARE UP

I ran about a dozen different scans looking for different things, some are limit orders for the potential bounce, many are position trades-that are core positions, a few are short term swing trades,it's all in the notes. Please set alerts so you don't miss any of these.

I see so many excellent short positions right at support, that alone leads me to believe that we'll see a move up, but the greater things about this is there are so many great positions for our main strategy. Some are ready to go now, some will be ready in a few weeks, but all have shown exceptional weakness and are trades that aren't already half spent, on other words, you are getting excellent positioning on them, that's why I don't want you to miss any that trigger.

When I use a lot of limit orders it's because we have short term uncertainty in the market and they give you an edge, you sacrifice a little profit, but with the excellent positioning of the trades, it's a moot point.

The dollar broke out right after the market close, it has declined significantly since then, this is also an indication of a higher probability of a bounce. As of now the dollar is about where it closed, that's quite a reversal tonight.

I don't want you to get lost in all of this bounce talk though, if I had to value this I'd value it at 10%, meaning the longer term short strategy is what is really important. A bounce provides a little extra money, better positioning on shorts and potentially helps the down trend accelerate faster and further for reasons I've mentioned several times today and the last few days.

So we'll see what we have in store for tomorrow, but remember, in this environment you want to be quick about taking any "gift" gains, anything double digit in a day or two I consider a gift. Unless I make mention of a long being a possible "position", "trending trade." Management of these quick trades is essential so if you find yourself with a nice gain, feel free to email me for a second opinion. NEVER let a gain turn into a loser.

Until the a.m....... I wish you all the best and I'm here for you. By the way, my short sale list, trades that I'm waiting for that perfect positioning, is now over 200 stocks.

This will be a short post

I don't have to write much because you saw all the intraday updates and know just about everything I do. As I suggested in one of my earliest posts this morning, I thought we may see some sort of reversal signal today at the close, I mentioned star, hammer or a doji. We closed today with a star on increasing volume.

As far as price/volume relationships go, increasing volume early in a downtrend indicates panic selling, but other then the gap down today, I didn't see much that looked panicked. So the other possibility for this price volume configuration is one we have talked about the last few days; churning. Churning at a top is when we see heavy volume and no price appreciation, it is indicative of distribution. When we see the same thing at a low like today, it implies the opposite, accumulation. Retail sellers are exiting, and institutional buyers are taking their shares, there's a sort of equilibrium between the two which makes sense if you are the institutional buyer trying to accumulate, you don't want to push prices up, at the same time you want to take as much of the sell-side retail out of the trade so they do not start selling into your party-"a bounce". We had a late day divergence right around the area I told you in an update to expect resistance, that was the $106.40 area, we got the turn around $106.30-this could have been institutions trying to pick up more shares or it could have been disappointed longs selling because the market failed to make any headway today. Or the remote possibility is institutional sellers, but the don't usually operate that way, on increasing volume-they sell into strength, not weakness, unless they themselves were panicked over something that hasn't hit the market yet.

Considering the amount of positive divergences through the major averages and the quality of them-some reaching 10 minute charts (which have turned markets for 3-4 days in my past experience), I'm going to say this was the best example of accumulation we've seen in probably weeks.

After hours trade is nearly flat, this is why I warned you if we didn't see a strong close we may see an early gap down, this is not in itself saying anything about a bounce, it only allows institutions to shake out the rest of the weak longs and take their shares on the cheap.

As I mentioned, considering a gap down and using risk management on a speculative position, you could enter a trade like UPRO and not risk more then 1-2% of your portfolio. You can also sit it out. I chose to hold onto short core positions through the ups and downs because of reasons I mentioned earlier.

So in my opinion, the most likely course of action for tomorrow's close is a close up, perhaps followed by another day or few days of bounce. Tonight I'll go through the charts and list what I see, but alerts are important. We had several trades trigger today, long and short that could have made you some money, so get those alerts put in place.

I'm here for your questions, sorry if I was slow today on any of them, I was watching a lot and posting a lot. If the posts are annoying to you, email me and I can take you off the mailing list. Most people love them, but I can see how 10 in a day might get annoying.

Look for trades later tonight.

For those watching the oil trade,

USO has positive divergences from 1 min to an hourly chart. UUP is in a bear-pennant-ish pattern with a descending triangle-continuation pattern and it would presumably be continuing the early morning drop as it formed right after that. The drop in the dollar will also be helpful for a market bounce and the TRIn is now at 1.88 with an intraday spike past 8

VIX and TRIN

The VIX finally moved but more importantly the TRIN is at 1.78 right now, typically 2= a close higher the next day. The TICK index is also seemingly confirming the positive reading in other indicators. We have resistance around $106.40 on the SPY. 3C is pretty much in line with price, there's a little lagging in two, the other is right on-they are not negative divergences. This suggests to me that they may be done accumulating, otherwise they'd be tying to knock the market back down to buy cheap. Don't forget, if you play this potential and in my opinion, likely bounce, chances are probably 50/50-depending on how strong the close is, that they may gap it down in the a.m. If the market closes strong, those chances diminish.

UPRO as a bounce trade

If I had to choose I stock it would either be a long leveraged version of the QQQQ or UPRO-it gives you leveraged exposure to the market, if you missed any of the long trades triggered today you can take a look at those as well, but not every sector will rise, however in a market bounce, an ETF like UPRO or QLD should.

I would use good risk management, this is still speculative and chances are fairly good we see another false downside breakdown-gap down that they start pushing up in the afternoon. Your risk management should allow you to absorb such a move, but still not put your portfolio at more then 1-2% risk on the trade-RISK MANAGEMENT!

I feel there's a decent chance now that we will see a move up, how far? Take a look and be sure to remember this is a short term speculative trade for some extra cash, not a trending position.


Get Ready-

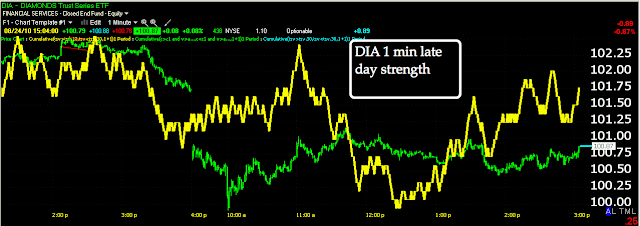
Below you will find the Q's, the DIA and SPY on all 3 versions of 3C. All of them look pretty darn positive to me. Now gap up or bounce, it appears that there has been fairly robust accumulation today and the confirmation between the different indicators and ETFs is what I look for. I'd say this is the strongest signal I've seen yet since the idea of a bounce came about


A New Method

I'm experimenting with a new method.  As I have told you before, market makers fill orders for large institutional clients and their performance is graded according to the Volume average Weighted Price or VWAP. If the market maker is accumulating a position, then they want to come in under the VWAP, if they fill the order above the average price paid, then it's unlikely they'll get that institutional business again, so I used a 1 min 3C chart which is where I can best see market maker activity and I compared it to a 1 hour VWAP. What the market maker is graded upon as far as VWAP time frame, I don't know, but using a daily VWAP, anybody could fill the order below, so I chose a 1 hour. As you can see by this chart (red arrows indicate distribution and white arrows indicate accumulation-the white boxes indicate areas of accumulation below the VWAP in light blue (yellow is 3C).

As you will see, there's accumulation nearly every time below the VWAP at 3C accumulation signals. When price rises above, they use a little or their market maker magic and it appears they knock prices back down below the VWAP where the order can be filled. Since UPRO has good volume and it is a leveraged ETF with broad market exposure, I chose that as my ticker.

The results, if I'm on track here, would seem to indicate accumulation and below the VWAP as the market maker would want. Take a close look.

ERX (oil) vs UUP (dollar)

These are both the same 3C chart on a 1-min scale, which calls intraday moves, usually it is picking up on market maker and specialist activity. It is important in calling swings, but it is also the first place we see any change of character. Other then that, market makers/specialists are often called upon by institutional money to fill large orders, they try to do it in small chunks as to not drive up or drive down price, depending on the position. A VWAP is helpful in analyzing the market makers performance, as they accumulate, they will usually try to accumulate below the VWAP or distribute above it. A good fill for an institutional customer guarantees more business.
 Oil you can see saw accumulation right off the open, when prices got a little high around 11:45, they sold some, most likely to bring their target zone in line with the VWAP.
The dollar on the other hand saw distribution right on the gap up. Near 10:45 there was some accumulation although not heavy-just a relative divergence. Since then it seems the dollar is being sold.

Noon Update

ARNA L>7.29-keep an eye on this one.

DGW L gave us a pretty decent entry considering the risk profile, again it's worth a look.

Last night's SPRD at market was a great entry-right at the stop-on a closing basis-and it's up 2.65% for us

AGM listed last night and originally from 8/19 (short) is at an 11.5% profit, a bounce near $12 would make for a good entry/add to or at least a good look at it .

NZT also triggered, a bounce here could provide a good entry or add to.For a trending trade I'd move the stop as high as $7.56

The market...

We do have a bit of a negative divergence at the 11:45 area, it doesn't look very serious yet. The more important 5 min. charts are showing positive placement, they appear to be using these lows to accumulate.

USO just tested the resistance area at $32 again and what do you know, another volume spike, stops being hit and short orders filled-these guys just don't learn-DO NOT PLACE STOPS AT WHOLE NUMBERS-THE MARKET MAKER AND SPECIALIST CAN SEE IT AND EVERY OTHER TRADER IS DOING THE SAME THING! It seems like the specialist will probably do this as many times as they keep doing this, it's all pay day for him/her.

The dollar has momentarily stabilised, which is interesting considering the 5-min positive divergences in the market. While the dollar showed A 5 min positive accumulation signal just before stabilizing, it is not in line at all with the same positive divergence in the market which is close to a powerful leading divergence. One thing is for sure, there's not aggressive selling which means this is likely (as to what I see as of now) to put in a doji, star or hammer reversal day as I mentioned earlier this morning.

USO/Oil Update

Ok, USO has broken a mjor support level and taken out the obvious $32 stop level, look at the volume as it passed below $32, a sure ign the specialist was gunning for stops. At the same time we saw a 3C divergence (positive). False breakdowns are always something to keep a close eye on or false breakouts. If we move back above support levels, the longs may jump back in the trade, the shorts that jumped in on the break of support are now at a loss and being squeezed, this is my "Judo Concept" where the market uses retail or dumb money's (us common folk) actions to feed (in this case) a rally. The short squeeze would propel the market higher, so we want to watch for a move above the $32.40 area as this will put a real pinch on shorts and create that upside momentum. As a friend of mine says, from false moves come fast moves (in the opposite direction). Here's the chart and considering the dollar's performance this morning, it's not so far fetched that the oil trade may still be alive and well.

At 10 am exactly there was a huge red volume spike as prices broke $32-again, the human mind gravitates toward whole numbers and makes it easy for market makers and specialists to go on fishing expeditions to trigger those stops and create a nice payday.

Assuming It Holds...

This is the first real positive divergence in the SPY.
It's a little strange with the poor existing home sales report....

UUP Update

Well that divergence was the real deal-remember though, being so early it's only a 1 min divergence, we need more prints to get into the longer intraday timeframes, but it certainly called some market maker activity and the dollar has plunged off it's gap.

AAPL

Just triggered a short limit order. Again, if you like the trade, you may want to leave a little room to add on any strength.

Very Early

This however is the strongest signal I've seen suggesting the gap will be faded to the upside.

An opening negative divergence on the dollar (via UUP) which trades opposite of the market. It's not fully formed yet, but it does appear to be there working on it. Remember, to fade the gap down, they need to be buyers down here, so unless another wave of selling starts, I'd assume for the moment that is the higher probability, at least for the a.m. trade.

Triggered From Last Night's List

Right on the open  FCX, SANM and LIZ all triggered short. Because the gap could be faded, if you like the trades, you may want to take part on now and part on later if we see some strength. Right now I think I like SANM the best followed by LIZ. In about 30 minutes we should have some 3C information, maybe less.

Gapping Down

Thus far the gap down appears as if it will take out any recent support areas, this could be one of those days I mentioned in a down trend-about 1 in 5 that actually moves a market significantly lower, this is the reason I try not to trade my long term positions, I consider them trend or position trades. The 25% cash that I always like to have on hand can be used to trade bounces and countertrend moves.

What will be interesting is if we get accumulation on the gap down, I except it to be faded and the market to rise a bit off the gap, if we get accumulation, then we could be looking at a star, doji or hammer close. We'll see, for right now, keep an eye on those short limit orders.

Don't forget about ideas from the recent past

I just got an email from a member that took the GNBT trade from the 18th of August,  today that member saw a fantastic gain, maybe tomorrow there will be some follow through. This is why I say, set those alerts. Pay attention to some of the older trades like a couple I highlighted on tonight's list. Risk management is the key that allows us to give the high probability trades a shot, if we lose, we lose 1-2% and hopefully not more on a gap down, that is why risk management is so important and setting those alerts.

Congratulations again, you know who! Excellent entry into a trade that might not have emotionally been the easiest trade to take. Lets keep our fingers crossed that she sees more upside!